ALGO BULLISHALGO is forming a symmetrical triangle, and i think its good idea to entry :)
Note : wait for retest
#DYOR
ALGOUSDT

ALGORAND 4hrBroke the resistance, ready to PUMP.
Algo have been in this triangle pattern for more than a month.
Since btc reached its all time high, it shows how bullish market is.
So we expect algo to pump.

AlgousdtHi . Cup pattern confirmed. Take profit in dipp.we can expect more than 80% profit. However in some cup pattern target goes upper than we accept.

Algorand is close to new ATH: Price discovery phase as Total 2Massive Cup and Handle on Total 2 Marketcap excluding Bitcoin. Algorand is right there. Watch out for Bitcoin dominance around 47%, best time to buy upon rejection from there.

ALGOUSDT Retest EntryHere we can enter a trade when/if the price retests at entry around....
Entry 1.8215
TP 1.8949
SL 1.7847
Not financial advice, do your own analysis aswel.
Good luck

ALGOUSDT AnalysisHello friends.
Please support my work by clicking the LIKE button(If you liked).Thank you!
Everything on the chart.
open pos: market
target: 2.75 - 3
after first target reached move ur stop to breakeven
stop: ~1.75 (depending of ur risk). ALWAYS follow ur RM .
risk/reward 1 to 2
Good luck everyone!
Follow me on TRADINGView, if you don't want to miss my next analysis or signals.
It's not financial advice.
Dont Forget, always make your own research before to trade my ideas!
Open to your questions or suggestions(Looking for investors!).

ALGOUSDT AnalysisHello friends.
Please support my work by clicking the LIKE button(If you liked).Thank you!
Everything on the chart.
open pos: market
target: 2.75 - 3
after first target reached move ur stop to breakeven
stop: ~1.8 (depending of ur risk). ALWAYS follow ur RM .
risk/reward 1 to 2
Good luck everyone!
Follow me on TRADINGView, if you don't want to miss my next analysis or signals.
It's not financial advice.
Dont Forget, always make your own research before to trade my ideas!
Open to your questions or suggestions(Looking for investors!).


ALGO GOES DOWN MY FIRST IDEAAlgo is in a huge bearish since September and too many times it tried to break the resistance but it couldn't go so far. Yesterday with BTC ATH it also climbed to huge amount but still it is under our resistance.
For short positions:
Stop: 1.8
Sell: 1.69

ALGO try to break out triangle#ALGOUSDT
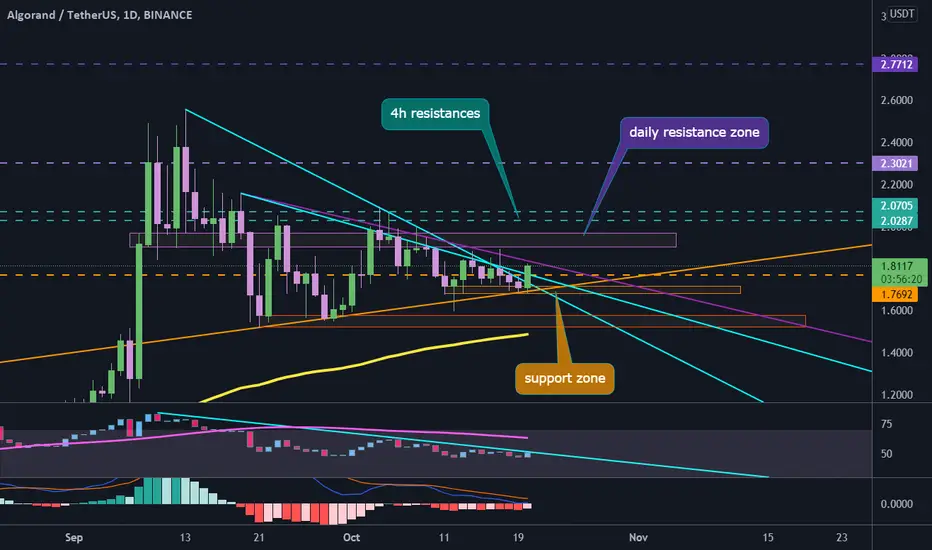
$ALGO is trading above 3 major resistances, if daily candle close above $1.7692, it is a bullish sign and will confirm an uptrend. then price head up toward daily resistance zone and I think it will pass $2. target of broken triangle is around $2.3.

ALGOUSDT Technical Analysis⏳ Spot
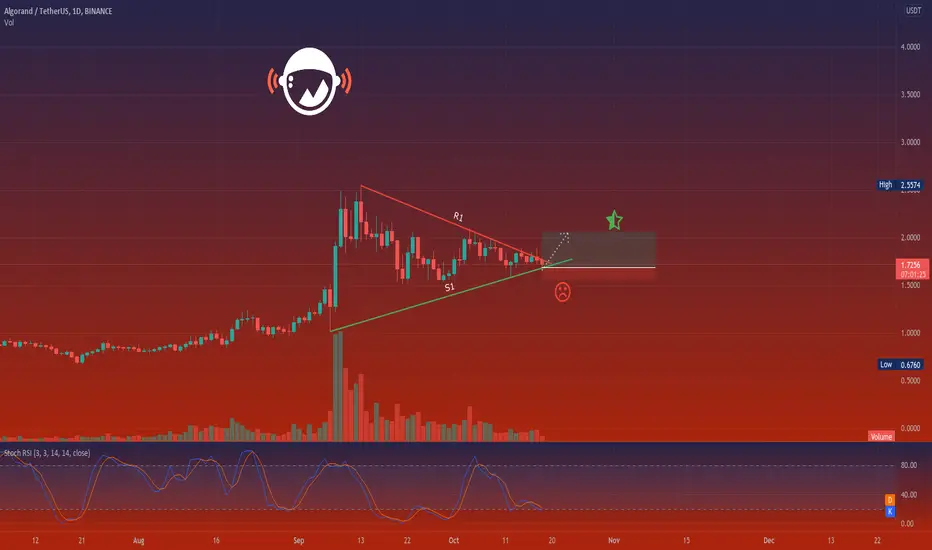
💎 ALGOUSDT has formed a symmetrical triangle, the price has got rejected from the bottom of the triangle, I expect it to move higher and after the breakout we will see a bluish move
🌐 Tradingview
🏁 Short & Medium Term
💵 Invest Only 5% of your Portfolio
🎳 Entry at Market or at 1.6969
☕️ TP1 1.8200
🍺 TP2 1.9000
🍻 TP3 2.1000
🍾 TP4 ______
🍷 TP5 ______
🍸 TP6 ______
🍹 TP7 ______
🎁 TP8 ______
🚫 SL 1.6000
Good Luck 🎲
Check the Links in Description and If you LIKE this analysis, Please support our page and Ideas by hitting the LIKE 👍 button. ❤️ Your Support is really appreciated! ❤️
Traders, if you have your own opinion about it, please write your own in the comment box. We will be glad for this.
Feel free to request any pair/instrument analysis or ask any questions in the comment section below.
We will have more FREE forecasts in TradingView soon
Have a Profitable Day

Algorand (ALGO) - Algorand's had a bad day. Places to buyAlgorand suffered after a recent breakout attempt, where an old daily Dynamic support flipped to resistance and gave us a little local double top. After this those who bought the breakout no doubt have dumped it and caused it to drop to the current lower dynamic support (green) which it is currently testing. The technicals look bad. But wont be confirmed until this 4H closes. Depending on how much you like the ALGO project, you could watch this current 4H candle and try accumulate at this dynamic support if it looks like it will close above price support and OBV key level. From here we may see a recovery. The alternative is this support is broken and we head back down to the 1.5 range. Buyers have been making slightly higher swing lows each time, but they have been failing to show strength.
Note the OBV signaling a strong sell off after attempted break. We would want it to hold that key level
Watch and act at this level, risking the recovery. OR wait until it returns to the 1.6-1.5 level and look for some signs of renewal there

ALGOUSDT Bullish Signal Middle termgood price to buy. I think it can have a new trend soon. 4$ is a huge resistance

good entry position for ALGOUSDTif price can break out dynamic and static resistance line the ALGOUSDT can touch the new ATH

ALGOUSDTHello Crypto Lovers,
Mars Signals team wishes you high profits.
We are in a daily time frame.
As you see, the price is fluctuating above the support line. If it does not enter and stabilize below the support line, it can touch its target after breaking the resistance line.
Warning: This is just a suggestion and we do not guarantee profits. We advise you analyze the chart before opening any position.
Wish you luck
ALGO, MY PREDICTED SCENARIO...Hello, my friends...
This content is just a prediction about the Algorand possible action. The entry point is shown on the chart *but after the retest.
Good luck >_-

ALGOUSDT Daily TimeframeSNIPER STRATEGY (new version)
It works ALMOST ON ANY CHART.
It produces Weak, Medium and Strong signals based on consisting elements.
NOT ALL TARGETS CAN BE ACHIEVED, let's make that clear.
TARGETS OR ENTRY PRICES ARE STRONG SUPPORT AND RESISTANCE LEVELS SO THEY CAN ACT LIKE PIVOT POINTS AND REVERSE THE WAVE (or act like a mirror that can reflects light) BASED ON STRENGTH OF THAT LEVEL.
ENTRY PRICE BLACK COLOR
MOST PROBABLE SCENARIOS TARGETS GREEN COLOR
LEAST PROBABLE SCENARIOS TARGETS RED COLOR
TARGETS ARE NOT EXACT NUMBERS THEY ARE MORE LIKE A ZONE.
DO NOT USE THIS STROTEGY FOR LEVERAGED TRADING.
It will not give you the whole wave like any other strategy out there but it will give you a huge part of the wave.
The BEST TIMEFRAMES for this strategy are Daily, Weekly and Monthly however it can work on any timeframe.
Consider those points and you will have a huge advantage in the market.
There is a lot more about this strategy.
It can predict possible target and also give you almost exact buy or sell time on the spot.
I am developing it even more so stay tuned and start to follow me for more signals and forecasts.
START BELIEVING AND GOOD LUCK
HADIMOZAYAN

✅ALGOUSDT - Hit TP1 exactly in an hour as expected!-
Congrats if you've been following this trading strategy as below!
-
Now you definitely take some profit at 1st TP.
Next, you can hold the rest till TP2 or TP3, surely can take it all anytime you want.
-
I suggest that you can move the original SL a little upper to assure your potential profit!
Have a great profit guys!
-
If you like this analysis, give it a like and leave a comment below to share your perspective
or let me know what crypto you want to see!
Trading is a reflection of yourself. Learn more daily and be ready for every opportunity.
Have a nice trading!

ALGO/USDT : Breaking out the trendline ! BINANCE:ALGOUSDT
Hello everyone 😃
Before we start to discuss, I would be glad if your share your opinion on this post and hit the like button if you enjoyed it !
#ALGO is breaking above the bearish trendline here.
📚 There are some of the bullish factors for it :
- There's a S/R line which has been broken and it has so much impact on #ALGO's master candle after a retest on it.
- Breaking above the current trendline will lead the pair to the recent high which is also.
- This the 5th attempt to breakout and based on 5th rule, Bulls have the opportunity to hold above the trendline.
- EMA200 is supporting the movement and also it's standing to the support zone on current chart's time-frame.
- MACD had a bullish crossover and now it's breaking above the neutral line; Also there's a buy pressure located on MACD.
- RSI is standing at 62 currently which is suggesting the bulls upper hand on current level.
- #ALGO is breaking above the MA200 currently
📌 You can take a ride after a hold above the mentioned resistance zone.
🔴 Any close below the support zone will invalidate the bullish bias.
Attention: this isn't financial advice we are just trying to help people on their own vision.
Have a good day!
@Helical_Trades
ALGOUSDT - Good timing to break out this big Triangle!BYBIT:ALGOUSDT
4H trend chart
-
ALGO has kept consolidating as a triangle formation for a while.
There were many times fake out and needed to modify the upper downtrend line.
Now it just broke it out in 1H chart, and we should notice the closure of 4H candle is firm or not.
So if price can be confirmed of breaking out this triangle, trading strategy as below.
-
Profit Targets:
a) 1.8925----Fib(1)
b) 1.9708~2.0025----Fib(1.272~1.382)
c) 2.0704-----Fib(1.618)
Stop losses:
a) 1.7730-----Red horizontal ray
-
If you like this analysis, give it a like and leave a comment below to share your perspective
or let me know what crypto you want to see!
Trading is a reflection of yourself. Learn more daily and be ready for every opportunity.
Have a nice trading!

Nice setup on ALGOAlgo is making big triangl formation.
Wait for break of bearish trendline and then entry to the position.
It is better to entry with growing buy volume.
Stoploss you should put below the last low.

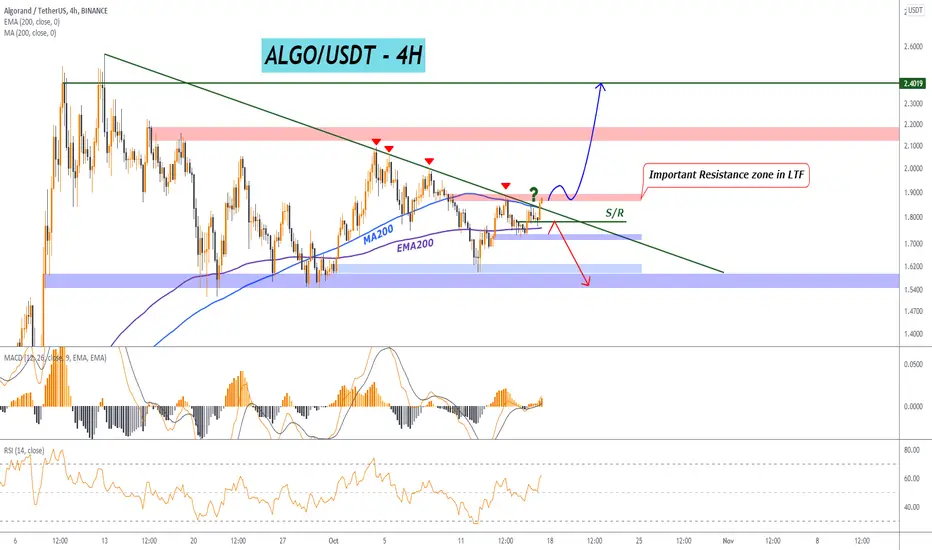
ALGOUSDTAlgo-usdt / 4H
Enter after break trend-line
resistance : 1.9 - 2.1 - 2.4
Stop : Daily Close under 1.5
