Alibaba - A remarkable reversal!🛒Alibaba ( NYSE:BABA ) reversed exactly here:
🔎Analysis summary:
Recently Alibaba has perfectly been respecting market structure. With the current bullish break and retest playing out, there is a very high chance that Alibaba will rally at least another +20%. But all of this chart behaviour just looks like we will witness a major bottom formation soon.
📝Levels to watch:
$110, $135
🙏🏻#LONGTERMVISION
Philip - Swing Trader
Alibaba

Much needed break for $BABA on the horizonI took a much needed break but not as long as NYSE:BABA has taken since 2021; swinging between ~$70 and ~$120 over the past six years.
I strongly suspect that this might have something to do with Jack Ma's speech in late 2024 that made him go 'missing' from public view
- www.wired.com .
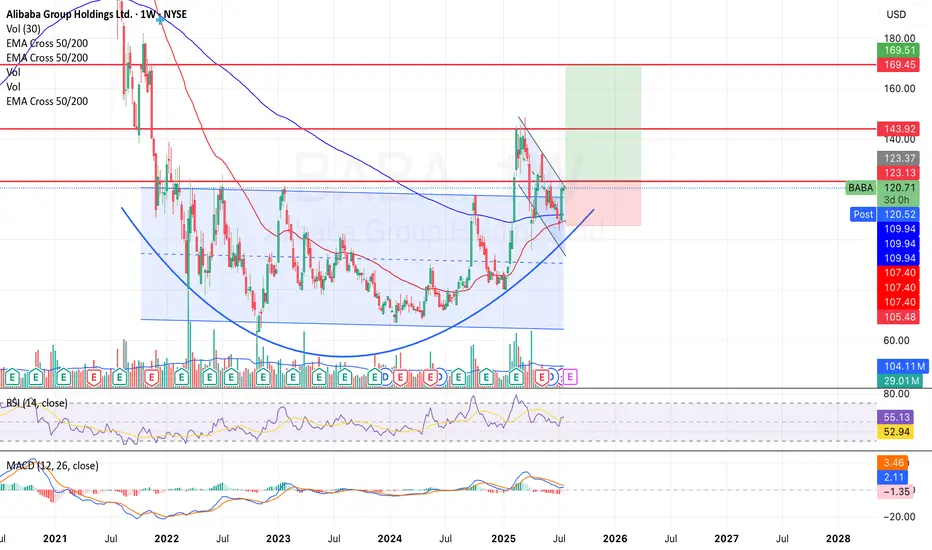
The stock has formed a multi-year rounded bottom (cup) followed by a handle formation, a classic bullish reversal pattern. Price is currently consolidating just below the ~$123 resistance with a potential target of $143 - $170 if this breaks resistance.
I will hedge my bets on a bullish run and find support around $107 - $109 if the breakout is rejected.
NYSE:BABA is currently trading above the 50 and 200-week EMA and I see a potential golden cross forming in the coming days.
U.S - China relations still proves challenging but with earnings on the horizon I am optimistic that it will be the catalyst for this breakout.
BABA WEEKLY TRADE IDEA – JULY 21, 2025
🐉 NYSE:BABA WEEKLY TRADE IDEA – JULY 21, 2025 🐉
📈 Strong RSI. Institutional Accumulation. Gamma-juiced upside.
Momentum is building — timing is key.
⸻
📊 Trade Setup
🔹 Type: Long Call
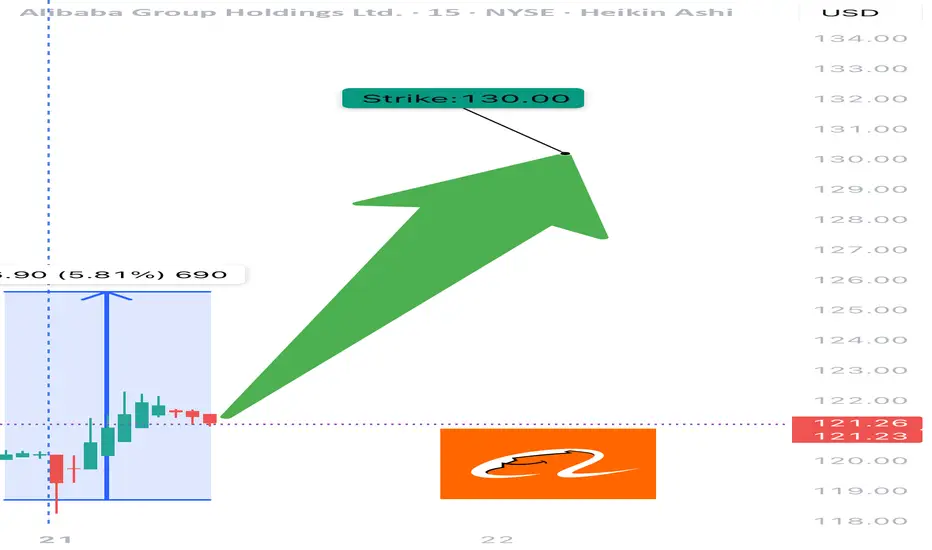
🎯 Strike: $130.00
📆 Expiry: July 25, 2025 (4 DTE)
💰 Entry Price: $0.52
🎯 Profit Target: $0.74 (📈 +42%)
🛑 Stop Loss: $0.30 (~40% Risk)
📈 Confidence: 70%
🕰️ Timing: Enter at Monday Open
📦 Size: 1 Contract (or scale accordingly)
⸻
🔍 Why This Trade?
✅ Daily RSI = 68.3 → Bullish momentum building
✅ Volume = 1.3x week-over-week → Institutional buying confirmed
📊 Neutral Call/Put Flow → Sentiment not overheated = better entry
🧠 Multiple models agree on MODERATE BULLISH bias
🌬️ VIX stable = ideal for controlled option premium entries
💎 Gamma risk manageable, but monitor price spikes at resistance near $130–132
⸻
⚠️ Risk Management Notes
🔸 RSI near breakout zone → monitor for fakeouts
⏳ Only 4 days to expiry → time decay risk accelerates
📉 Watch for rejection near key levels ($130.50–132.00)
🛑 Respect the stop: If momentum stalls early, exit fast
⸻
📌 Execution Strategy
🔹 Enter clean, single-leg naked call
🔹 Exit partial at 30% profit, full by Thursday unless breakout is strong
🔹 Avoid spreads: delta exposure preferred for upside spike capture
⸻
🏁 Verdict:
All models point to upside, but not full conviction.
This is a momentum + positioning trade, not a breakout gamble.
NYSE:BABA 130C – Risk $0.30 to Target $0.74 📈
Tight structure. Moderate aggression. Execute with precision.
⸻
#BABA #OptionsTrading #CallOption #WeeklyTrade #MomentumPlay #UnusualOptionsActivity #TradingViewIdeas #GammaFlow #FlowBasedSetup #Alibaba
BABA: triangle with tensionOn the weekly chart, BABA has already formed a golden cross - price is above both MA50 and MA200, confirming a bullish trend shift. The stock is now approaching the upper edge of the symmetrical triangle and the key resistance at $122, which also aligns with the 0.5 Fibonacci level.
The numbers inside the triangle represent the contraction phases, not Elliott waves. This is a classical consolidation before a potential breakout. If the $122 level is broken and retested, upside targets are $128 (0.618), $137 (0.786), and eventually $148–181 (1.0–1.618 extension).
Volume is rising, MACD is flipping bullish, and RSI is climbing out of oversold territory — all signs point to growing bullish momentum.
Fundamentally, Alibaba benefits from China's economic rebound, possible regulatory relief, and ongoing share buybacks. With Chinese tech rotating back into favor, BABA could lead the rally.
So if you're still waiting for a signal - it's already here. The golden cross is done, price is flying above moving averages, and all that’s left is a clean breakout. Watch $122 — that’s the launchpad.

Alibaba | BABA | Long at $108.84Like Amazon, I suspect AI and robotics will enhance Alibaba's NYSE:BABA e-commerce, logistics, and cloud computing operations. There is some risk here, like other Chinese stocks, that they could be delisted from the US market if trade/war tensions rise. But I just don't think that is likely (no matter the threats) due to the importance of worldwide trade and investment. I could be way wrong, though...
NYSE:BABA has a current P/E of 14.2x and a forward P/E of 2x, which indicates strong earnings growth ahead. The company is very healthy, with a debt-to-equity of 0.2x, Altmans Z Score of 3.3, and a Quick Ratio of 1.5. If this were a US stock, investors would have piled in long ago at the current price.
From a technical analysis perspective, the historical simple moving average (SMA) band has started to reverse trend (now upward), indicating a high potential for continued (overall) price movement up. It is possible, however, that the price may reenter the SMA band in the near-term - the $80s aren't out of the question - as tariff threats arise. But that area is another personal entry zone if fundamentals hold.
Thus, while it could be a bumpy ride and the risk is there for delisting, NYSE:BABA is in a personal buy zone at $108.84 (with known risk of drop to the $80s in the near-term).
Targets into 2028:
$125.00 (+14.8%)
$160.00 (+47.0%)

Alibaba (BABA) Shares Fall to Lowest Level in 2.5 MonthsAlibaba (BABA) Shares Fall to Lowest Level in 2.5 Months
Yesterday, Alibaba (BABA) shares dropped to their lowest level since late April. The decline followed the company’s announcement of a planned bond issuance totalling approximately $1.53 billion, with a maturity date set for 2032. The funds will be used to support the development of Alibaba's cloud infrastructure and expansion of its international e-commerce business.
The market’s negative reaction may stem from concerns over rising debt levels and the potential return on these investments.
Technical Analysis of Alibaba (BABA) Share Price
When analysing the price movements of BABA shares in 2025, two key trading ranges stand out:
→ $126–145: This range originates from the long bullish candle on 20 February, following the release of a strong quarterly report;
→ $96–103: This zone was established in late April, as supply and demand stabilised around the psychologically significant $100 level.
The upper range has since acted as a resistance zone, with the price reversing from it in mid-May. The lower range has served as a support area, particularly in early April when the stock came under pressure after tariff-related headlines.
The current price action is notable in that Alibaba shares have:
→ Broken through the June support level at approximately $111.92;
→ Formed a bearish A-B-C structure, marked by lower highs and lower lows.
Using Fibonacci extension analysis, we can reasonably assume:
→ The $111.92 level is now likely to act as resistance;
→ The next potential target for the ongoing downtrend (leg C→D) lies at the 1 Fibonacci level ($100.55) — aligning closely with the previously identified support zone.
This article represents the opinion of the Companies operating under the FXOpen brand only. It is not to be construed as an offer, solicitation, or recommendation with respect to products and services provided by the Companies operating under the FXOpen brand, nor is it to be considered financial advice.

Why BABA Alibaba Could Rebound Strongly by Year-End 2025If you haven`t bought BABA before the recent rally:
What you need to know:
BABA’s fundamentals, fueled by e-commerce, cloud, and AI, support its technical bullishness:
E-commerce and Cloud Rebound:
Q1 2025 revenue grew 7% year-over-year, with Taobao/Tmall rebounding and cloud revenue surging due to AI demand.
Alibaba’s cloud division, China’s largest, benefits from hyperscaler AI workloads, with 15% profit margin projections by 2029.
AI Leadership:
BABA’s AI assistant and generative AI tools drove a 70% stock surge in early 2025, positioning it as a leader in China’s AI race.
At 12x forward P/E with 8% revenue CAGR, BABA is undervalued (fair value ~$162).
Share Buybacks:
Aggressive share repurchasing (6% annual reduction) boosts EPS, with $1 trillion GMV reinforcing e-commerce dominance.
Macro Tailwinds:
Easing CCP regulations and China’s stimulus measures (e.g., rate cuts) support BABA’s rally.
Minimal U.S. exposure insulates BABA from trade war risks.
Conclusion: BABA’s Path to $168
BABA’s technicals, with a bullish breaker and wedge, signal a breakout above $125–$130, targeting $150–$168 by year-end 2025. Fundamentally, its e-commerce dominance, cloud/AI growth, and undervaluation make it a standout. Traders should buy dips near $110–$115 or await a $130 breakout. With stimulus and buybacks as catalysts, BABA is set to soar.
Disclosure: I am part of Trade Nation's Influencer program and receive a monthly fee for using their TradingView charts in my analysis.

BABA Stock: A Detailed Analysis using Elliott Wave Theory RulesHello Friends,
Welcome to RK_Chaarts,
Let's analyze Ali Baba Group Holdings Limited, also known as BABA, listed on the NYSE. We'll be using the Elliott Waves theory.
Friends, as we can clearly see, after hitting a low of around $95.75 on 9th April 2025, it started an impulse wave. Within this wave, we've completed intermediate degree blue bracketed (1), (2), (3), (4), (5), and primary degree ((1)) in Black. Currently, we're completing primary degree ((2)), with a low around $111.
If it breaks the level of $111, we'll assume we're still in primary degree ((2)), as marked in scenario 2 on the chart. This means wave ((2)) is unfolding, and wave ((3)) might start after wave ((2)) is complete.
If it doesn't break the $111 level, it's likely that wave ((2)) has completed, and we've started a subdivision of wave ((3)) or its further subdivisions. If it moves further up, following scenario 1 (the black line on the chart), this is a possibility.
According to Elliott Wave theory, wave ((2)) cannot retrace more than 100% of wave ((1)). So, our main invalidation level for this count is $95.75. Yes, BABA is turning up against the 95.75 low, and in the near term, we expect the stock to trade higher.
Somewhere, this stock might move towards $150 or $160 if it doesn't break down below $ 95.75.
I am not Sebi registered analyst.
My studies are for educational purpose only.
Please Consult your financial advisor before trading or investing.
I am not responsible for any kinds of your profits and your losses.
Most investors treat trading as a hobby because they have a full-time job doing something else.
However, If you treat trading like a business, it will pay you like a business.
If you treat like a hobby, hobbies don't pay, they cost you...!
Hope this post is helpful to community
Thanks
RK💕
Disclaimer and Risk Warning.
The analysis and discussion provided on in.tradingview.com is intended for educational purposes only and should not be relied upon for trading decisions. RK_Chaarts is not an investment adviser and the information provided here should not be taken as professional investment advice. Before buying or selling any investments, securities, or precious metals, it is recommended that you conduct your own due diligence. RK_Chaarts does not share in your profits and will not take responsibility for any losses you may incur. So Please Consult your financial advisor before trading or investing.

BABA Weekly Options Play – 2025-06-10🧾 BABA Weekly Options Play – 2025-06-10
Bias: Moderately Bearish
Timeframe: 5 trading days
Catalysts: Weakening momentum, max pain gravity, fading upside catalysts
Trade Type: Single-leg PUT option
🧠 Model Summary Table
Model Direction Strike Entry Price Target Stop Loss Confidence
Grok Bullish 125.00C $0.77 $1.16 $0.385 65%
Claude Bearish 117.00P $1.75 $2.63 $1.23 65%
Llama Bearish 119.00P $2.85 $3.42 $2.28 65%
Gemini Bullish 125.00C $0.77 $1.35 $0.38 68%
DeepSeek Bearish 114.00P $0.79 $1.19 $0.55 70%
✅ Consensus: Moderately Bearish
📉 Core Setup: Downside pullback toward $115–118 support zone
⚠️ Outlier: Gemini and Grok see potential call upside on sentiment rebound
🔍 Technical & Sentiment Recap
Trend: Mixed structure—price stuck between declining intraday EMAs and longer-term resistances
Momentum: Bearish MACD and RSI signals across M5 & daily on 3/5 models
Sentiment: VIX 16.8 (neutral), Max Pain at $118 = gravitational anchor
Options Flow: Heavy call OI near $124–125 (potential cap); Put flows dominate below $118
✅ Final Trade Recommendation
Parameter Value
Instrument BABA
Strategy Single-leg PUT (weekly)
Strike $115.00
Entry Price $1.13 (ask)
Profit Target $1.70 (~50% gain)
Stop-Loss $0.79 (~30% loss)
Size 1 contract
Entry Timing At market open
Confidence 65%
🎯 Rationale: Favorable risk-reward in short-dated put to capture downside drift toward $115 zone. Models align around a modest pullback, driven by technical weakness and lack of fresh bullish catalysts.
⚠️ Risk Factors
Sharp bounce from short-term oversold RSI
Sudden news catalyst (AI/cloud deal, macro relief) could fuel call side squeeze
Weekly options decay accelerates sharply by Thursday
Max pain shift or volatility compression could mute movement
📊 TRADE DETAILS SNAPSHOT
🎯 Instrument: BABA
🔀 Direction: PUT (SHORT)
🎯 Strike: 115.00
💵 Entry Price: 1.13
🎯 Profit Target: 1.70
🛑 Stop Loss: 0.79
📅 Expiry: 2025-06-13
📏 Size: 1 contract
📈 Confidence: 65%
⏰ Entry Timing: open
🕒 Signal Time: 2025-06-08 23:55:22 EDT

Alibaba: Intermediate Correction in ProgressAs Alibaba has remained below resistance at $121.28, we’ve ultimately chosen to consider the high of orange wave x as established. Thus, we currently place the stock in bearish wave y, which should conclude the corrective structure of the larger blue wave (ii). From that point, BABA should reverse, climb back above the $121.28 resistance, and move to significantly higher levels—initially completing blue wave (iii), and eventually the larger turquoise wave 3. However, there’s still a 34% chance that our bearish alternate scenario will play out. In that case, the stock would fall between the two support levels at $80.05 and $58.01, where the low of turquoise wave alt.2 would form.
📈 Over 190 precise analyses, clear entry points, and defined Target Zones - that's what we do.

Alibaba - This was just the obvious bottom!Alibaba - NYSE:BABA - will head much higher:
(click chart above to see the in depth analysis👆🏻)
Ever since Alibaba actually retested the previous all time low in 2022, we have been able to see the textbook creation of a rounding bottom formation. Even the recent break and retest was perfectly playing out and if Alibaba confirmes the potental breakout, a rally of +50% will most likely follow.
Levels to watch: $140, $220
Keep your long term vision!
Philip (BasicTrading)

Alibaba - This Chart Speaks In Money!Alibaba ( NYSE:BABA ) prepares for a significant pump:
Click chart above to see the detailed analysis👆🏻
Basically since Alibaba was listed on the NYSE, it always perfectly respected market structure. With the recent rejection away from the key neckline, Alibaba is now creating a bullish break and retest. After bullish confirmation, this forms a bottom and we might see new all time highs.
Levels to watch: $110, $140
Keep your long term vision,
Philip (BasicTrading)

Alibaba - Don't Forget Chinese Stocks Now!Alibaba ( NYSE:BABA ) still remains super interesting:
Click chart above to see the detailed analysis👆🏻
After we saw the very expected parabolic rally on Alibaba about four months ago, Alibaba is now perfectly retesting major previous structure. Yes, we could see a short term pullback in the near future but this just offers a perfect break and retest after the rounding bottom pattern.
Levels to watch: $110, $140
Keep your long term vision,
Philip (BasicTrading)

Alibaba (BABA) Share Price Declines from 40-Month HighAlibaba (BABA) Share Price Declines from 40-Month High
As shown in the Alibaba (BABA) share chart, the price reached a 40-month high this week, surpassing $145 per share.
Bullish sentiment is being fuelled by news related to AI prospects in China. According to media reports:
→ China’s AI spending is increasing through investments from state-owned enterprises, private companies, and local authorities, aiming to keep pace with the US $500 billion Star Gate project.
→ Alibaba plans to invest $52 billion over three years in artificial intelligence and cloud computing.
Technical Analysis of Alibaba (BABA) Shares
Despite a positive fundamental backdrop, the chart signals potential concerns:
→ The price is near the upper boundary of the ascending channel, which could act as resistance.
→ Bulls attempted to break the $145 level (which has acted as resistance since late February) on 17 March but failed, as the price could not hold above this mark.
→ Using your preferred oscillator, you are likely to observe a bearish divergence between peaks A and B.
This suggests that bullish momentum may be weakening, and investors could consider taking profits after Alibaba’s exceptionally strong price rally—up approximately 70% since early 2025. If so, a break below the orange trendline could lead to a correction towards the median of the blue channel.
This article represents the opinion of the Companies operating under the FXOpen brand only. It is not to be construed as an offer, solicitation, or recommendation with respect to products and services provided by the Companies operating under the FXOpen brand, nor is it to be considered financial advice.

BABA: Swing Trade Setup with 14% Upside🚨Swing Trade Setup: NYSE:BABA
Breakout = 🎯$162
Entry: $142.20
S/L: $135.65 (3to1 R/R)
Target: $162 (14% Higher)
NOT FINANCIAL ADVICE

Alibaba - This Chart Is Pretty Beautiful!Alibaba ( NYSE:BABA ) is perfectly respecting structure:
Click chart above to see the detailed analysis👆🏻
With a rally of about +80% within a couple of weeks, Alibaba is clearly showing signs of bulls completely taking over. This pressure was not unexpected though after we perfectly witnessed the major trendline breakout a couple of months ago and a retest of the confluence of support.
Levels to watch: $140, $110
Keep your long term vision,
Philip (BasicTrading)

CHINA FIN MARKETS | Investing in China & AIChina's market resurgence might pose some great opportunities for investors, especially after a long bearish cycle for the global Chinese financial markets.
February 2025 saw a significant shake-up in global markets, with China emerging as a key player driving investor sentiment. The MSCI China Index surged by 11.2% for the month, vastly outperforming the MSCI US Index:
One of the biggest catalysts behind China’s recent rally has been its advancements in Artificial Intelligence (DeepSeekAI being one of the key drivers).
By operating at a fraction of the cost of their US counterparts, such as OpenAI and Meta, DeepSeek's competitive advantage has given China an edge in the AI space, which can be seen in the market confidence.
XIAOMI has been one of the top gainers, largely as they are expanding their market penetration:
Chinese markets in February saw a boost when President Xi Jinping was warmly received by tech industry leaders. A handshake between Xi and Alibaba’s Jack Ma who previously stepped back from the public eye following regulatory crackdowns, was seen as a major gesture of reconciliation between the government and the private sector. This renewed support for private enterprises.
China’s long-term strategy has been paying dividends in high-tech industries. China has increased its global market share in nearly all industries and is outperforming competitors in cost-efficiency, particularly in sectors like copper smelting.
Despite recent gains, China’s stock market has yet to fully recover from its underperformance over the past decade. While the MSCI China Index has risen 34.6% over the past year, long-term returns still lag behind global markets. A US$100 investment in an MSCI World Index tracker in 2010 would have grown to US$480 by early 2024, whereas the same amount invested in an MSCI China Index fund would have only reached US$175.
China’s resurgence has brought a renewed sense of optimism, but investors remain cautious. While AI advancements and low cost of labor have positioned China as a competitive force, historical challenges like regulatory intervention, tariffs and economic instability still loom.
_________________________

BABA in a falling wedge (NEW)BABA stock has been in a long-term downtrend.
We're expecting the price to continue droping as it looks like it got rejected from the downsloping resistance line on the weekly timeframe.
What we can see on the chart is a pattern called a falling wedge.
Most likely the price will revisit $60 or lower but eventually we expect the breakout in Q2 or Q3 2023.
How to trade:
Enter long position if/when we get a breakout with a volume increase.
Final target and the take profit level are shown on the chart.
Good luck

BABA looks bullish. Are you ready?Are you still waiting for lower prices ?
Buying lows from 2016 was not cheap enough for you?
Baba created higher lows structure on weekly. Looks mega bullish. Expecting more upside soon
Target 1: 170 $
target 2: 200 $
Stop loss: 76,50 $

Alibaba (BABA) AnalysisCompany Overview:
Alibaba NYSE:BABA is a global e-commerce and technology powerhouse, with leadership in online retail, cloud computing, and digital entertainment.
Key Catalysts:
Generative AI Leadership 🤖
Alibaba’s Qwen2.5 Max AI model has outperformed GPT-4 and LLaMA3.1-405B in benchmark tests, reinforcing its AI dominance.
Strategic Partnership with Apple 🍏
Integration of Alibaba’s AI models into iPhones in China could boost Alibaba Cloud adoption, driving revenue growth and market share expansion.
Cloud Computing Growth ☁️
Alibaba Cloud’s margins are projected to expand from 3% to 10% by 2026, with 18% annual revenue growth, positioning it as a $100B valuation business.
Shareholder Value Initiatives 💰
A $25B share buyback and a growing 1.2% dividend yield reflect strong financial confidence and commitment to shareholder returns.
Investment Outlook:
Bullish Case: We are bullish on BABA above $108.00-$110.00, driven by AI advancements, cloud expansion, and strategic partnerships.
Upside Potential: Our price target is $185.00-$190.00, supported by cloud growth, AI innovation, and strong capital allocation.
📢 Alibaba—Powering the Future of AI, Cloud, and E-Commerce. #Alibaba #AI #CloudComputing #Ecommerce

Alibaba Stock Surges 10% as Earnings Beat Expectations Shares of Alibaba Group Holding Ltd. (NYSE: NYSE:BABA ) are soaring after the Chinese tech and e-commerce giant reported quarterly earnings that exceeded Wall Street expectations. Alibaba’s latest financial results reflect strong growth in its cloud computing division, which includes artificial intelligence (AI) initiatives, and the broader market optimism surrounding its strategic moves.
Beating Estimates with Strong Revenue Growth
Alibaba posted revenue of 280.15 billion Chinese yuan ($38.5 billion) for the December quarter, marking a 7.6% increase year-over-year. The company’s earnings per share per ADS came in at $2.93, surpassing analyst expectations tracked by Visible Alpha. CEO Eddie Wu emphasized that Alibaba’s strategic focus on "user-first, AI-driven" operations has contributed significantly to its reaccelerated growth.
One of the standout aspects of Alibaba’s performance is its cloud computing segment, which saw a 13% year-over-year revenue increase. Notably, AI-related product revenue surged at a triple-digit rate for the sixth consecutive quarter, underscoring Alibaba’s position as a dominant player in China’s AI landscape.
Adding to the bullish sentiment is speculation that Alibaba may be collaborating with Apple (AAPL) to integrate AI-powered features into iPhones in China. Moreover, reports suggest that co-founder Jack Ma has re-established ties with Beijing, a development that could ease regulatory pressures and pave the way for smoother business operations.
Technical Outlook: Bullish Breakout with Strong Momentum
From a technical perspective, NYSE:BABA shares have been on an impressive run, climbing over 80% in the past year. At the time of writing, the stock is up 8.09% in intraday trading, signaling strong bullish momentum.
The breakout from a falling wedge pattern—a classic bullish reversal setup—has been a key catalyst in Alibaba’s upward trajectory. The Relative Strength Index (RSI) currently sits at 84, indicating that the stock is in overbought territory. However, with momentum building, further upside potential remains, particularly if BABA clears its recent one-month high.
In the event of a pullback, the 38.2% Fibonacci retracement level is acting as a solid support zone, providing traders with a potential re-entry point. A decisive breakout above resistance could trigger another leg up, reinforcing the stock’s bullish sentiment.
Conclusion
With cloud computing and AI revenues expanding at a rapid pace, alongside renewed investor confidence, the stock remains in a strong uptrend. While technical indicators suggest caution due to overbought conditions, a breakout above resistance could unlock further gains.

Alibaba Shares (BABA) Hit 12-Month High Ahead of Earnings ReportAlibaba Shares (BABA) Hit 12-Month High Ahead of Earnings Report
Chinese e-commerce giant Alibaba is set to release its quarterly earnings report on 20 February. The Wall Street Journal cites optimistic analyst estimates, projecting gross revenue of 279.03 billion yuan (approximately $38 billion), up from 260.35 billion yuan a year ago and 236.50 billion yuan in the previous quarter.
Investor sentiment has been buoyed by Alibaba co-founder Jack Ma’s presence at an event with Chinese President Xi Jinping. According to Barron’s, this signals government efforts to restore confidence in the private sector, particularly in technology. At present, such factors may be having a greater impact on the stock market than geopolitical headlines or Trump’s tariff policies.
These and other drivers—including a recent partnership between Alibaba and Apple to integrate AI features into the iPhone 16 series—have fuelled bullish momentum. As a result, Alibaba shares (BABA) have surged nearly 20% in February, reaching their highest level since February last year.
Technical Analysis of Alibaba Shares (BABA)
In our previous analysis on 29 January, we noted that BABA’s price movements were forming key levels for an Andrews' Pitchfork pattern, indicating a bullish outlook.
Currently, the price has:
→ Surpassed the October high near $118.
→ Gained bullish momentum after consolidating around the psychological $100 level.
The RSI indicator signals overbought conditions, suggesting a potential correction. However, given the strong news flow, any pullback may be shallow.
Alibaba (BABA) Stock Forecasts
According to BarChart, after years of underperformance, many investors are looking at China with renewed optimism for 2025. Hedge fund Appaloosa Management’s founder and president, David Tepper—whose net worth stands at $21.5 billion—recently acquired Alibaba shares, as per the latest 13F filings.
He may believe that the Chinese stock market is significantly undervalued, based on the “Warren Buffett Indicator,” which compares a country's total market capitalisation to its GDP. A ratio below 100 suggests undervaluation, while a higher figure indicates overvaluation. Currently, China’s market cap-to-GDP ratio stands below 70%, compared to over 200% for the US.
Tepper is not alone in his bullish stance. According to TipRanks:
→ 7 out of 8 analysts surveyed recommend buying BABA shares.
→ The average 12-month price target for BABA is $129.13.
Trade on TradingView with FXOpen. Consider opening an account and access over 700 markets with tight spreads from 0.0 pips and low commissions from $1.50 per lot.
This article represents the opinion of the Companies operating under the FXOpen brand only. It is not to be construed as an offer, solicitation, or recommendation with respect to products and services provided by the Companies operating under the FXOpen brand, nor is it to be considered financial advice.

I'm GAGA for BABA!NYSE:BABA
🎯134🎯150🎯171
Five weeks of green candles for over 55%!
Road this one higher from the beginning and fully exited. Now that we are pretty extended and broke out of the Inverse H&S Pattern I'd like to see a pullback to retest the breakout at $115-118 for an entry back in.
- Green H5
- Volume GAP
- Wr% Up trending
- Inverse H&S breakout
- China has momentum (look for tariff news or earnings this week to provide a dip buying opp.)
Not financial advice
