BABA's a buyLong term buy and hold for me here. Saw a textbook double bottom (right at two months apart) and at botttom of ascending tri support
Alibaba

ALIBABA resistance breakoutBABA is breaking an important resistance, tested 4 times since late July.
It Opened above resistance, and is growing with above daily average volume .
Great risk reward ratio entering position entering a position at $181, sell around $195.


Alibaba testing heavy resistanceAs shown in the chart, we are testing a heavy resistance tested multiple times.
Technical indicators are showing mostly consolidation.
If I were thinking of getting into a position, I would wait. If I had Alibaba stock, I would strongly consider taking profits (selling 50% +)
Obviously breaking this resistance would be an important step towards a strong uptrend.

Alibaba - don't miss this train!Technicals
There has been no divergence with RSI and the OBV and trade price. They are steadily growing. ----> BULL
DI+>DI- (positive directional index just crossed above the negative) ---> BULL
MACD>MACsignal (MACD just crossed above the signal) -----> BULL
Fundamentals
Alibaba reported earnings yesterday (Aug15th) continued positive non-GAAP earnings of $1.84 per share, 45.98% above the same quarter a year ago, beating the mean consensus estimate of $1.51.
All analyst price target values are above $200 (17% above current price @$170)
Risks
JD.com who is a competitor, is doing great.
Trade war between China & USA.

Somebody poke NEO, is it still alive? Heya All,
While BTC is taking a week-end rest I have the inclination to proceed and revisit some of my favourite shitcoins and NEO is definitely one of them. This coin and platform has all that is needed for a solid DAPPs coin and in many ways fundamentals of NEO stood head and shoulders above ETH, Stelar, Cosmos and other similar DAPP platforms yet it took more beating and more damage than any of these.
Needless to say, NEO community internationally was and perhaps still is one of the strongest. Citi of Zion, despite somewhat corrupt structure, is still a much better governance system than any of the similar platforms offered.
At this point, the question still begs to be asked, what happened with NEO? Apart from nearly 2-year long bear market what has resulted in a collapse of the Da Hong Fei's empire? - I am not a NEO Expert, but I will try to elaborate on some of the shortcomings of the projects and reasons why it was not able to gain traction even after announcing the NEO 3.0 version upgrade. Here they are:
- Not being able to develop a strong report with the Chinese government ( with any other Gov for that matter).
- Not being able to establish a simple yet elegant use case on GOV or major business level. (For example, collaborations with Alipay or Wechat would have catapulted NEO to a whole new level. Similarly, it would have been beneficial to deploy notarial, public, business and land registry services on NEO for any of the countries where they have a prominent presence).
On a positive note, I think NEO still has a fighting chance and will rise again if the management team will ramp up international efforts, Will resume to be more proactive when engaging the international community and when supporting promising projects on the platforms.
And yes, for now, NEO is bearly breathing and it is 200K short away from total collapse. Several factors that accompany NEO's current situation are the following:
1. Low liquidity - No one with the mother is trading this asset. There are small movements on Finex but all of it looks like a bunch of liquidations and some in-house market making to keep the price level afloat.
2. Price action looks like swiss cheese - There are so many gaps in the price action on lower timeframes that I suspect that no one trades this asset at their own will.
3. Possibility to short neo to kingdom come - It looks like the whole asset can be short to 8$ level and beyond with just 200 K account and a couple of smart traders.
4. 30 Days from the golden cross to the death cross - Currently neo is under the death cross. Lat death cross ended about a month ago and current one took a change of the price action quite recently. There is more mad news, the 50EMA-200 SMA death cross is about to take place soon, which again might send NEO to lower price targets.
If I had a position in this Asset, I would close my shorts now, liquidate my holdings and would move my positions to BTC.
Will NEO rise again? -Perhaps... Soon? -Nobody knows!
Happy trading and stay safe!
Archie

BABA ForecastSimple charting exercise for NYSE:BABA heading into its upcoming earnings. Will be interesting to see how the trade war and in particular the weakening of the RMB may have affected earnings.

BABA is cheap - below all analysts targetsTechnical analysis (daily chart)
RSI(10) @62
OBV on steady uptrend along with the RSI
CCI(10) @100
MACD > MACDsignal
Fundamental analysis
BABA is a buy right now @$177. Well below analyst price average targets of $225. (Over 25%)
Fair value Morningstar note
Our fair value estimate is $240 per ADS incorporates management's full-year fiscal 2020 outlook calling for over CNY 500 billion in revenue (representing 33% growth year over year).
* Meaning... If they achieve this growth, the price target will make sense.
Good luck!
dorfmanmaster

Alibaba Buy Opportunity Alibaba BABA stock has triggered long with with 200EMA as a support. At the moment as long as the stock hold above the 200EMA I will be comfortable with the trade till the Target hit.
You can enter now or wait for a retracement towards 170. Personally Im long from 166 levels from initial signal.
If this has a End Of Day close below the 200EMA and break that candlestick, I would come out early.
For the moment Target is 184 to 189
Stops - 159 or close below 200EMA

5% Return Buy on BABAAlibaba has made a good bounce on the 180 EMA acting as a support line at $167. With Baba's current upward trend, it will be a good opportunity to capture 5% within the next 1-2 weeks.


Long BABAExpecting bounce from extremely oversold weekly and daily levels. If low breached, be ready to re-enter at lower levels with tight stops.

BABA reversed from resistance, potential drop!BABA reversed off its resistance at 165.48 where it could potentially drop further to its 154.57.


BABA- Nice entry point, decent Risk:RewardBABA has been correcting for some time after it's nice surge. Never mind the trade wars, it's showing healthy correction and possible continuation. We have confluence near this point with the bottom of the channel, major .618 (golden pocket) FIB point. Some signs of possible movement upward are: bullish divergence on the 3D chart, TD sequential at 9 on the downtrend, L-RSI bottoming out, etc. The predicted increase to $200+ would put a profit gain of 30+% on a swing trade.

$BABA: BUY when everyone is fearful. Risk lovers only.$BABA has been battered down in the past weeks due to the trade war escalating. But fear not, we now get to buy an A1 company at a discount. I see this as an opportunity seeing that business is still rapidly growing; shown in the May 15th/19 earnings report. With the trade war being the only reason for $BABA's sell off, we will soar to new highs once this trade dispute gets resolved.
How to trade this:
- ONLY buy after confirmation of the support in the smaller time frames.
- Have a tight stop loss.
- If stop loss is hit, wait for the next confirmation at the 2nd support.
- BE PATIENT!
Only trade $BABA if you have an apatite for risk.
Trade analysis, not a financial advice.

Alibaba FractalsLet's say you are going to trade it, are you short or long? For me it's screwed up, I pass this one.

Bullish on Alibaba here. In line with channel. I like where Alibaba is in the channel. Bullish medium to long term. But short term could touch that bottom section of the channel. (*However, I think the market flips to positive this week in preparation for the Chinese talks on Thursday/Friday*). This would give Trump leverage with the Chinese more-so than if the market was red leading up to it. Just my hypothesis. I also like Boeing and Netflix for a bounce. BABA

US/China Trade Deal & BABAAre you ready for the blow off top coming with the upcoming (hopefully) US/China trade deal? Don't miss a buying opportunity, and reap the full benefits that come with Megalodon trading!
The Megalodon Indicator uses an artificial intelligence, combined with over 500 different buy setups, as well as over 2000 different indicators to produce stunningly accurate buy and sell signals. Join Megalodon Trading today and get your hands on our automated trade bot for cryptocurrency! You will also receive real time buy and sell signals for the stock market, cryptocurrency, as well as forex markets! Link in Bio!

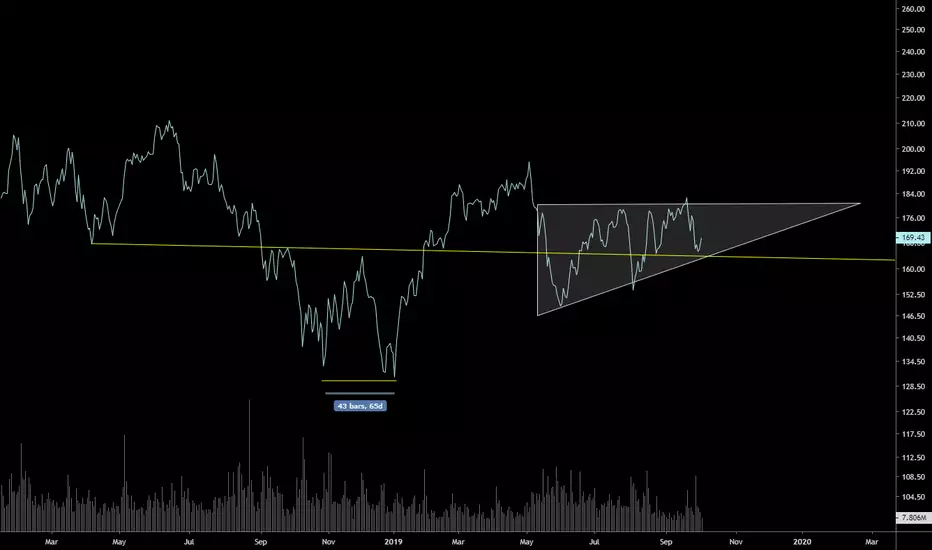
Ascending Triangle Forming - Breakout In MayWatching this ascending triangle and taking a long position here. Short term PT $194.16. After it reaches the first target, granted market conditions stay the same, I expect BABA to continue on to the last ATH at $211.70 over the next few months. Will be keeping an eye on this one.

