$BABA Inverse Head & ShoulderNYSE:BABA Inverse Head & Shoulder. The inverse head and shoulders pattern is a bullish reversal pattern that is often seen in stocks that have been in a downtrend. The pattern is characterized by three troughs, with the middle trough being lower than the other two. The neckline is the horizontal line that connects the bottoms of the two outer troughs.
If the price of BABA breaks above the neckline, it would be a signal that the downtrend is over and that the stock is likely to move higher. The target price for the breakout would be the distance between the neckline and the head of the pattern.
Of course, no pattern is guaranteed, and there is always the possibility that BABA could break down below the neckline instead. However, the inverse head and shoulders pattern is a bullish signal that is worth watching for.
Alibaba

Here's Why $BABA Could Skyrocket Even Higher!Analysis:
Looking at the dataset, it's evident that both the Macro PVVM and Micro PVVM scores for Alibaba ( NYSE:BABA ) show an overall increasing trend over the examined period. The Macro PVVM went from a score of around 0.58 to approximately 54.24, demonstrating a significant uptrend. The Micro PVVM also moved from -53.71 to 40.23, showing a reversal from a bearish to a bullish momentum in the short term.
The close price of NYSE:BABA has been generally increasing along with the PVVM scores, indicating that the bullish momentum has been affecting the stock's price positively.
Key Takeaways:
There's an established bullish momentum, indicated by the upward trend in both the Macro and Micro PVVM.
The Micro PVVM has crossed from negative to positive, suggesting that the bearish short-term movement seen at the beginning of the period has turned into a bullish one.
The most recent close price of $98.33 is the highest over this period, further confirming the bullish sentiment.
Trading Strategy:
Given the bullish trend and movement, it would be a good strategy to maintain a long position on Alibaba. However, traders should keep an eye on the PVVM scores. If there's a sudden drop, especially in the Micro PVVM, it could indicate a reversal in the short-term movement.
Since both Macro and Micro PVVM are in positive territory and increasing, traders should look for opportunities to enter long positions on pullbacks, as the overall trend is upwards. Keep in mind the rule that the best long entries are when both PVVMs are low and start showing signs of strengthening.

Alibaba is in a good position to buyAccording to Elliott Waves, Alibaba is in a good position to enter.
The first target is $160
The second target is $250

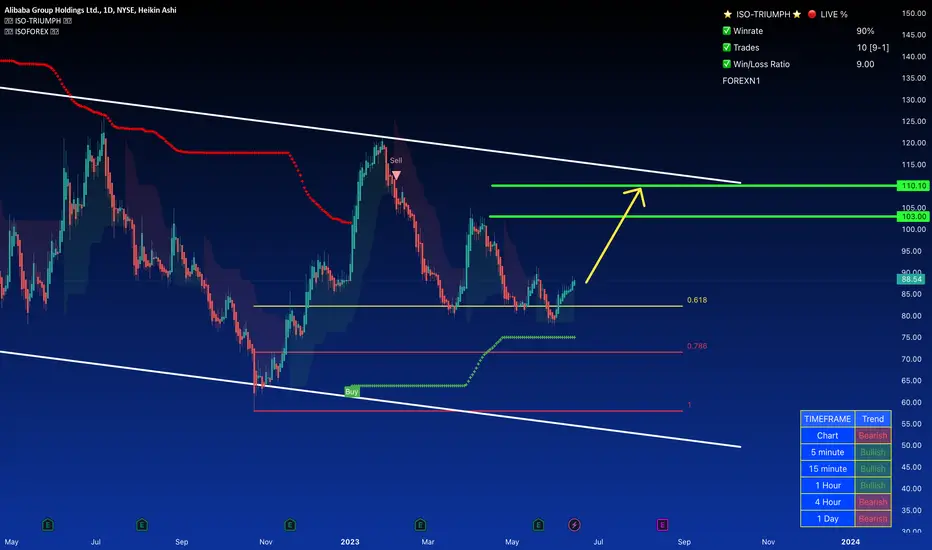
ALIBABA broke above the yearly Resistance. Buy signal.Alibaba broke on Friday above the Falling Resistance that was initiated on January 26th.
That was also a crossing over the 0.236 Fibonacci level.
Technically that is a strong double bullish break out for a potential long term bullish reversal.
Trading Plan:
1. Buy on the current market price.
Targets:
1. 105.00 (Resistance 2 and Fibonacci 0.618) and 120.00 (Resistance 3 and Fibonacci 1.000).
Tips:
1. The RSI (1d) has been on a Rising Support since March 10th. A Bullish Divergence and clear sign of a long term bullish reversal.
Please like, follow and comment!!

BABA with a Bullish Breakout on the Daily trendBABA has recently confirmed a bullish breakout on the daily trend, indicating a potential continuation of the upward momentum. The formation of a triple bottom pattern further reinforces the bullish outlook. As long as the support level holds, we can expect the price to rally towards the recent highs around $105. Traders should monitor the price action for further confirmation and adjust their strategies accordingly. It's important to stay informed about the latest market conditions and news related to BABA for a well-rounded analysis.

Alibaba:From Promise to Setback and The Potential for ReboundAlibaba, once considered a promising investment tied to China's growth prospects, has faced significant setbacks in the past five years. Despite its declining stock price, the company has continued to expand its business, albeit at a slower pace. However, there are reasons behind Alibaba's decline in appeal, and it's worth exploring the likelihood of a stock rebound in the coming years.
During the past five years, Alibaba achieved impressive growth in annual revenue, with a compound annual growth rate (CAGR) of 28% from fiscal 2018 to 2023. However, recent data indicates a concerning deceleration in growth over the past two years.
This slowdown can be attributed to two primary challenges. Firstly, Alibaba faced setbacks when China's antitrust regulators imposed a historic fine in 2021, leading to tighter restrictions on the e-commerce division. These restrictions weakened Alibaba's competitive position against rivals in the fiercely competitive online retail market.
Secondly, the economic slowdown during the pandemic, along with intermittent lockdowns, had a broad impact on consumer spending across Alibaba's platforms and hindered enterprise spending on its cloud infrastructure services.
To address these challenges, Alibaba made significant strategic moves to streamline its operations. The company restructured its business into six distinct groups, giving each group more autonomy to seek external funding or conduct IPOs. Alibaba plans to spin off its Cloud Intelligence group through an IPO and explore potential IPOs for its logistics and global digital commerce divisions.
These spin-off companies can generate fresh capital, improve overall margins, and expand more rapidly without being closely managed by Alibaba. If successful, they could lead to increased net profits and help alleviate concerns from antitrust regulators.
Looking ahead, the spin-offs initiated by Alibaba have the potential to attract significant investor attention. Alongside this, Alibaba's reported growth is expected to stabilize as the macroeconomic environment improves and its core markets expand. Projections show growth potential in China's e-commerce and cloud computing services markets.
Analysts forecast moderate growth for Alibaba's revenue and net income, driven by continued spin-offs and spending discipline. If Alibaba meets these expectations and maintains a modest growth rate, it could achieve substantial revenue and net income by fiscal 2028.
Considering these factors, even if Alibaba's valuations remain steady, its stock could potentially double in the next few years. However, the emergence of a new bull market and the resolution of delisting concerns could further elevate its valuations. In simple terms, Alibaba's stock could triple or exceed that growth by fiscal 2028.
BABA is going much Higher based on Wyckoff accumulation count This idea is based on Wyckoff's accumulation schematic. Based on the recent price action, BABA has shown sign of strength when it jumped out of the creek and retested its upper limit 2 times now.
Based on the accumulation count, BABA should move pretty fast to 430-450 once it breaks out of the upper range limit of the accumulation range.
All info is on the chart.
Good luck

AlibabaI've been waiting for NYSE:BABA to crack on the upside and the stock has consistently disappointed. Maybe a downward move is all that is needed now.

Alibaba to breakdown?Alibaba - 30d expiry - We look to Sell a break of 79.38 (stop at 84.38)
The primary trend remains bullish.
The stock is currently underperforming in its sector.
This is currently an actively traded stock.
Daily signals are bearish.
We are trading at oversold extremes.
There is no clear indication that the downward move is coming to an end.
79.48 has been pivotal.
A break of the recent low at 79.48 should result in a further move lower.
Our profit targets will be 67.38 and 65.38
Resistance: 85.00 / 88.50 / 91.43
Support: 82.70 / 79.48 / 75.00
Please be advised that the information presented on TradingView is provided to Vantage (‘Vantage Global Limited’, ‘we’) by a third-party provider (‘Signal Centre’). Please be reminded that you are solely responsible for the trading decisions on your account. There is a very high degree of risk involved in trading. Any information and/or content is intended entirely for research, educational and informational purposes only and does not constitute investment or consultation advice or investment strategy. The information is not tailored to the investment needs of any specific person and therefore does not involve a consideration of any of the investment objectives, financial situation or needs of any viewer that may receive it. Kindly also note that past performance is not a reliable indicator of future results. Actual results may differ materially from those anticipated in forward-looking or past performance statements. We assume no liability as to the accuracy or completeness of any of the information and/or content provided herein and the Company cannot be held responsible for any omission, mistake nor for any loss or damage including without limitation to any loss of profit which may arise from reliance on any information supplied by Signal Centre.

Alibaba's Earnings Report and Future Prospects:Detailed AnalysisFollowing the release of Alibaba's latest earnings report on May 18th, the company's stock encountered a 5% decline. In the fourth quarter of fiscal 2023, which concluded on March 31st, the Chinese e-commerce and cloud leader achieved a 2% year-over-year increase in revenue, reaching 208.2 billion yuan ($30.3 billion). This figure surpassed analysts' expectations by $410 million. Furthermore, Alibaba's adjusted net income experienced a significant rise of 38%, amounting to 27.4 billion yuan ($4.0 billion), or $1.56 per American depositary share (ADS). Additionally, the company surpassed the consensus forecast by $0.21 in terms of adjusted earnings.
For the full fiscal year, Alibaba achieved a 2% growth in revenue and a 4% increase in adjusted earnings per ADS. Despite these positive results, Alibaba's stock price has plummeted more than 70% from its all-time high in October 2020. This situation prompts investors to consider whether Alibaba's stock presents a value play opportunity in the context of China's COVID-19 recovery or if it will remain out of favor in the Chinese tech sector for the foreseeable future.
Alibaba's decline can be attributed to a combination of regulatory, competitive, and macroeconomic factors. In September 2021, the company faced significant regulatory actions when China's antitrust regulators imposed a record-breaking $2.8 billion fine on Alibaba. This penalty required the company to terminate exclusive agreements with merchants and aggressive promotional practices while undergoing scrutiny of past and future investments. These regulatory measures weakened Alibaba's competitive position against rivals such as JD.com and Pinduoduo in the Chinese e-commerce market.
Furthermore, macroeconomic challenges impacted Alibaba's performance. China's economic slowdown and intermittent COVID-related lockdowns had a broad impact on consumer spending, consequently affecting Alibaba's performance. Companies also reduced their spending on Alibaba's cloud services due to the challenging economic conditions. Additionally, Alibaba's cloud business suffered a setback when ByteDance, under international pressure, transitioned the data of TikTok's overseas users from Alibaba Cloud to Oracle's cloud servers in 2021.
In terms of revenue distribution, Alibaba generated 67% of its revenue from its China Commerce segment, which encompasses platforms like Tmall, Taobao, and brick-and-mortar stores. Another 9% of revenue came from Alibaba Cloud, which remains the leading cloud platform in China. It is worth examining the performance of these two core businesses over the past two years.
Although the economic slowdown significantly impacted investor sentiment towards Alibaba, there are positive developments worth noting. Alibaba's operating margin expanded from 8% in fiscal 2022 to 12% in fiscal 2023, while its adjusted earnings before interest, taxes, depreciation, and amortization (EBITDA) margin increased from 19% to 20%. These improvements can be attributed to aggressive cost-cutting measures, including a significant reduction in the workforce with approximately 19,000 layoffs throughout 2022.
In March, Alibaba unveiled its future plans, which involve dividing its business into six new groups: Cloud Intelligence, Taobao Tmall Commerce, Local Services, Cainiao Smart Logistics, Global Digital Commerce, and the Digital Media and Entertainment Group. Each group will be led by separate CEOs, and many of them will pursue additional funding or initial public offerings (IPOs).
As an update to these plans, Alibaba announced in its fourth-quarter report that it intends to conduct an initial public offering (IPO) for its entire cloud division. The company plans to distribute the shares from this IPO as a special dividend to its current shareholders. Additionally, Alibaba aims to seek external financing for its global e-commerce division, which includes its overseas and cross-border marketplaces. Furthermore, the company is exploring potential IPOs for Cainiao Smart Logistics and the grocery division of its Taobao Tmall Commerce Group.
It's important to note that Alibaba's restructuring plan does not involve a complete split of the company. Even if the various business groups are spun off into publicly traded companies, Alibaba will retain majority stakes in all of them. The purpose of the restructuring is to enable these groups to pursue external financing independently, thereby reducing the burden on Alibaba's balance sheet. Additionally, it allows each group to make autonomous decisions without concerns about potential impacts on Alibaba's other divisions.
While Alibaba did not provide specific guidance for fiscal 2024, there is potential for its growth to accelerate as China's economy undergoes a post-COVID recovery. The spinoff of Alibaba Cloud has the potential to generate fresh capital and enhance the company's profitability.
Analysts anticipate that Alibaba's revenue and adjusted EBITDA will grow by approximately 10% and 9% respectively in fiscal 2024. However, these estimates should be approached with caution due to existing uncertainties. From a valuation standpoint, Alibaba's stock appears inexpensive, trading at around two times this year's sales and 10 times its adjusted EBITDA. Nevertheless, the stock may continue to face challenges until its revenue growth gains momentum and concerns regarding delisting threats for U.S.-listed Chinese stocks are addressed.
While Alibaba is certainly worth monitoring, it may not be considered an outright bargain at the current moment. Investors should exercise caution and closely monitor the company's growth trajectory and the regulatory environment before making investment decisions.

BABA H&S playing out good so far. BABA H&S playing out well so far.
I will probably be entering more here.
Another catalyst just arrived with Micheal Burry holding over 10% of his portfolio in BABA stocks to hedge the economic situation.
Definitely a good long-term hold here.
Especially if you add onto it the restructuring BABA is going through which experts have predicted will increase stock price from anywhere between 13 - 36% just off that.
I like it.
Thoughts?

BABA Alibaba Options Ahead of EarningsIf you haven`t sold BABA here:
and bought it here:
Now Analyzing the options chain of BABA Alibaba prior to the earnings report this week,
I would consider purchasing the 90usd strike price Calls with
an expiration date of 2023-6-16,
for a premium of approximately $4.45
If these options prove to be profitable prior to the earnings release, I would sell at least half of them.
Looking forward to read your opinion about it.

Is Alibaba stock a buy?Key Statistics
P/E Ratio 9.7
P/FCF Ratio 23
ROIC 7.5%
Operating Margin 11.78%
Analyst Estimates
March 2024 = $8.76 EPS (+12.35% YoY)
March 2025 = $9.85 EPS (+12.39% YoY)
March 2026 = $10.31 EPS (+4.68% YoY)

Alibaba longAlibaba looks bullish as we expect the chart to form a double bottom pattern. We expect it to rebound from the strong resistance levels.
There is also a bullish cross-over on the MACD line.
Risk-reward ratio is 10.64.
Entree price at 81.74
Taking profit at 120.06
Stop loss at 78.05

BABA Chinese government reshuffle spooks investorsSHORT
The Alibaba (BABA) share price has struggled so far in 2022, falling by 44.7% year-to-date (YTD).
Chinese e-commerce and technology sectors are facing fresh challenges: The Nasdaq Golden Dragon index, which tracks US-listed shares in Chinese companies, shed a record 14% following announcements that Xi Jinping has extended his rule to a third term as president – and filled senior government roles with party loyalists. In the 24 hours following the announcement, Alibaba fell 18%.
The Hang Seng Index also fared dismally, dropping 1,030 points to a 13-year low, following investor concern that the new government would stifle the economy and private enterprise. With China’s zero-Covid policy now cemented in the near term, along with government support for Vladimir Putin, a bearish sentiment might continue for tech stocks as investors stick to a risk-off mode.
The strict zero-Covid controls implemented by the Chinese government have resulted in lockdowns which have disturbed supply chains and the manufacturing industry.
In an article for CNBC, Antonella Teodoro, senior consultant at MDS Transmodal, said: “China’s zero-Covid approach is impacting production and manufacturers are seeking alternatives to the current ‘factory of the world’.
“Drilling down to the individual commodity groups exported from China, we observe that China has been continuing to lose market share, with Vietnam amongst the countries gaining importance on the international landscape.”
In March, the BABA share price fell below $100 for the first time since 2017. It has since been unable to hold above that level. But the stock had gained value since late May after the company announced its first-quarter earnings report.
The June-quarter earnings report was more positive: Daniel Zhang, chairman and CEO of Alibaba Group, said: “Following a relatively slow April and May, we saw signs of recovery across our businesses in June. We are confident in our growth opportunities in the long term given our high-quality consumer base and the resilience of our diversified business model catering to different demands of our customers.”
Toby Xu, chief financial officer of Alibaba Group, also commented: “Despite the challenges posed by the COVID-19 resurgence, we delivered stable revenue performance year-over-year. We have narrowed losses in key strategic businesses given ongoing improvements in operating efficiency and increasing focus on cost optimisation .
“We recently shared our plan to add Hong Kong as another primary listing venue. By becoming primary listed on both Hong Kong and New York stock exchanges, we aim to further expand and diversify our investor base.”
Is the current share price at a good entry point for investors looking to make an Alibaba stock investment? Has the share price bottomed out or is there potential for it to retreat again?
Historical stock price data shows that BABA dropped by 49% in 2021, ending the year at $118.79 a share, as worries about the Chinese market and a sell-off in technology stocks in the US exerted further downward pressure.
In April last year, the Chinese government fined the company $2.8bn for what the State Administration for Market Regulation said was monopolistic behaviour
The record fine was lower than the market had anticipated and removed some of the uncertainty surrounding the potential penalty that would be imposed. However, a gain in the share price was short-lived and it continued the downward trend that started in October 2020, after hitting its all-time highest stock price of $309.92.
Alibaba announced its December quarter 2021 results on the same day that Russian tanks rolled into Ukraine (24 February 2022), leading to much market upheaval, particularly in the technology sector.
What may also have concerned investors was that its revenue figures represented its slowest quarterly growth rate since going public in 2014. Revenues totalled RMB242.58bn ($38.07bn) in the October-December period, an increase of 10% year-over-year (YoY).

ALIBABA undergoes organizational revamp: A fundamental analysis.Alibaba, one of the world's leading e-commerce and cloud computing companies, has a rich corporate history that is sure to capture the attention of many. Founded by the charismatic and unconventional Chinese entrepreneur Jack Ma, the company was able to attract investments from the likes of Yahoo and SoftBank during its early days. However, it wasn't until its initial public offering (IPO) in 2014 - which raised a staggering HKEX:22 billion - that Alibaba truly entered the public consciousness in a significant way.
Recently, Alibaba surprised investors by announcing that it is undergoing an organizational revamp. In this article, we will delve into the implications of this development and assess whether investing in the company's stock is a wise decision.
Over the past decade, Alibaba has diversified its offerings beyond e-commerce. However, the company has been struggling to generate substantial growth for the past few years, a trend that is reflected in its stock price. In fact, since its IPO, the stock has decreased by 5%.
The current situation with Alibaba indicates that all the shareholder value the company once created has been erased, even if the degree of the sell-off may be exaggerated. While it's important to acknowledge that Alibaba is a Chinese company and likely experienced the impact of COVID-19 lockdowns, the fact remains that it has been struggling even as pandemic fears diminish. Consequently, the company's management is at a critical turning point.
In response to this situation, Alibaba has recently announced a significant restructuring plan that involves dividing the company into six distinct entities, each focused on one of its core divisions. According to CNBC's coverage of the story, these divisions will include cloud computing, e-commerce (Taobao Tmall), digital media, digital commerce, Cainiao logistics, and local services. Each entity will have its own Board of Directors and CEO.
The reasons behind Alibaba's decision to pursue this course of action are still subject to speculation. While some suggest that the restructuring is a response to the company's declining growth, others posit that it could be an attempt to address Alibaba's perceived monopoly status, given its size and the scrutiny it receives from the Chinese government.
After the announcement of the restructuring plan, research analyst Scott Kessler suggested that the Chinese government may have played a role in endorsing the move. The underlying rationale for this organizational overhaul is to allow each division to operate independently, almost like its own company.
This implies that the six new CEOs will have unique perspectives, enabling their respective entities to make swift decisions and compete more effectively with other cloud and internet companies. Essentially, the different segments will have the autonomy to create dedicated budgets, identify crucial initiatives, and raise funds from their own investor groups. The ultimate aim may be to spin off Alibaba and list each entity on a public exchange separately.
Investors will need to exercise patience to determine if Alibaba's restructuring plan is successful. Existing shareholders should hold on to their shares and evaluate future earnings reports, enabling them to determine if exchanging their shares in the different entities is a viable option when the time comes.
On the other hand, prospective investors may want to wait and observe future earnings reports to evaluate each division's potential. This will help investors to identify which entities are of interest to them. It may be prudent to invest in Alibaba before any potential spinoffs and separate listings, but only after careful consideration of the spinoff entities that make it onto their investment radar.
In conclusion, Alibaba's recent restructuring plan is a significant development that highlights the company's efforts to address its challenges and reposition itself for growth. While the possibility of a spinoff and separate listings of each entity is exciting, investors must exercise caution and carefully evaluate each division's potential before making any investment decisions.

Alibaba is in a decision zoneI believe BABA is in a gray zone where the market decides if it’s time to push it higher or if it will slide to the level of the end of 2022.
Below are the things I will consider.
1. Short conformations:
- Symmetrical triangle pattern (green lines)
- Declining RSI
- The money flow index keeps declining
- Possible H&S neck breakdown (blue lines)
Target - 60
2. Long confirmations:
- Price chart breaks upper trend line (and closing the end of march gap)
- SMI is going up, and MACD turns positive
- Quarterly revenue way over expectation (May 18th)
Target 1 – 100-105, Target 2 - 125
What are your thoughts?
NOTE: This is not financial advice. Every trader/investor should do their research and follow a personal plan.

Alibaba Baba ADR Group LTDAlibaba Crashed 79,5 Percent you can call this a crash.
Now Alibaba is retracing to higher levels.
Usually a retrace to the 0.38 and 0.5 Fibonacci is a healthy recovery,that Alibaba should stay infront of.
So from actual price levels of 93.5 USD there is still a 90 Percent upside possibility.
This could be Quick Money.
On the other side the fundamentals of BABA are strong. We have a higher cash quote that we can now invest in things.
Cash is king in times of high interest charges.
The KGV (Price earnings ratio)should decrease from 26,5 to 15,2 by 2024. this is very significant.
The net result is also drastically rising from 69.590Mill to 112 german Mrd.so it will nearly double to 2024.
This should be technically and fundamentally a good investment for the short and long run.
This is just my opinion and no buy or sell advice. Im self invested.

BABA - Daily Inverted H&SDaily chart showing a nearly completed inverted H&S
yet to experience the bullish right shoulder run
I have plotted the move in green with the magnet

Buy Alibaba baba cup and handle Buying Alibaba here on the cup and handle breakout. Also downward falling wedge, looks strong sign of a higher swing low here since the bottom a couple of moths ago. Expect to retest to 120 and higher

BABA in daily timeframealibaba chart after big drop seems going to bull faze
it break the important weekly resistance
in daily chart after pullback to EMA200 would going to up

Baba Long Position!
Baba looks to be rising toward the neckline at $120. First Target would $105 first. Once $120 is broken Baba will rise higher.

ALIBABA uptrend confirmed. Made this chart simples as I could, so everyone could understand. Few thing happened that are extremely bullish. First, price is above 200 moving average. Second, 20 EMA crossed 40 EMA after 6 months(last time this happened Alibaba went from $66 to $120 in weeks) 3. It formed bullish divergence on RSI. I marked all the details. Pls this is not any financial advice or anything, I am just trying to make this chart as simple as I can. You are welcome to make any comments, positive and negative. Thank you
