Short time Alice Long PositionOn the Demand Zone, there is a W pattern and now it breaking its neckline.
Keep Sl at early higher low.
Aliceusdt

ALICEUSDTHello Crypto Lovers,
Mars Signals team wishes you high profits.
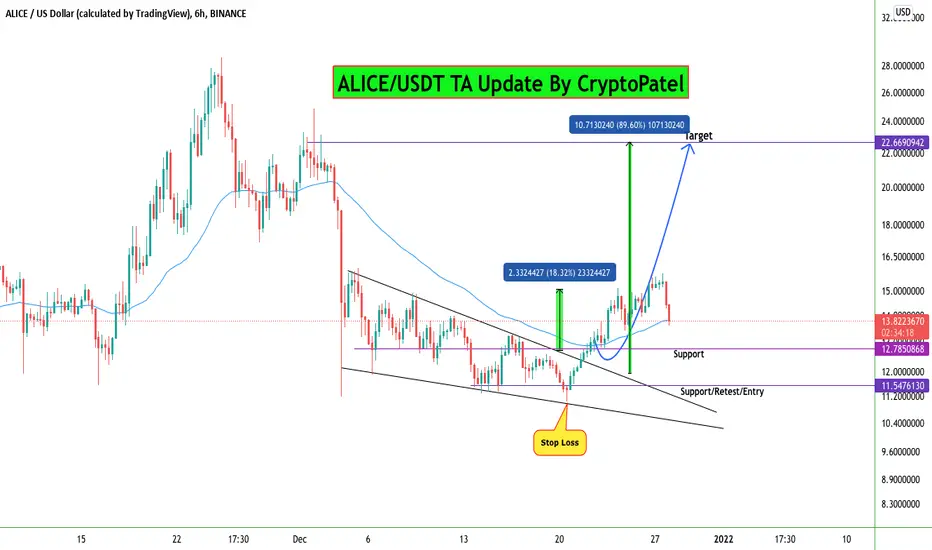
We are in the daily time frame. The R1 line is a strong resistance area. You see the yellow line which was our daily resistance and after hitting it several times, the price was able to break it. You can buy it here for the shown target and the Stop Loss is also shown for you on the chart. If it goes below the Stop Loss zone, then it will fall more.
Warning: This is just a suggestion and we do not guarantee profits. We advise you to analyze the chart before opening any positions.
Wish you luck

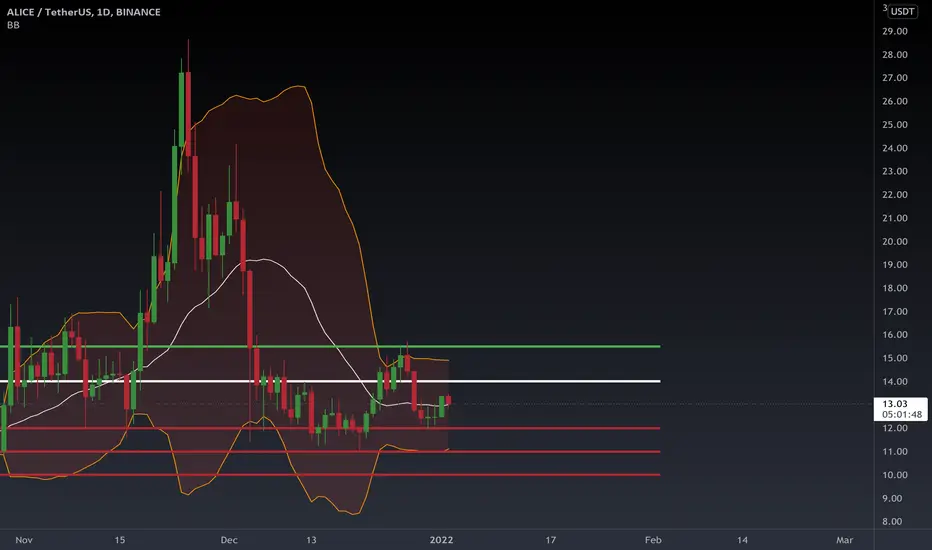
ALICE cryptocurrency - why else is it dangerous to buy?The stable downward trend since the end of November 2021 did not bypass the cryptocurrency ALICE. Having high hopes for the continuation of growth up to $34 , back in September the cryptocurrency ALICE again approached the local bottom in the range of $9.
The main ALICE trading volumes are focused on the historical highs. The local downward trend is occurring on lower volumes. What is it: the end of the cryptocurrency or a volume-free correction before a new wave of growth?
ALICE cryptocurrency - the fall wave is not over yet
Buyers' failed attempt to hold the $12 mark clearly signals a weakness in buyers at the moment. The $12 mark has played an important role in the past. We can see on the chart that after losing control of that level in September 2021, it took the buyers 2 months to gather the strength for a new upside wave. And the beginning of the local growth trend happened only after the retest of $12 in mid-November.
A similar situation can be seen in August 2021. From this we conclude that for a new upward wave, it is important for the buyers to take control of the level of $12 . As long as this level is under the control of the sellers, the probability of continuing the decline to $9 is quite high. Moreover, while we do not see active actions from the side of buyers neither by volumes nor by candlesticks.
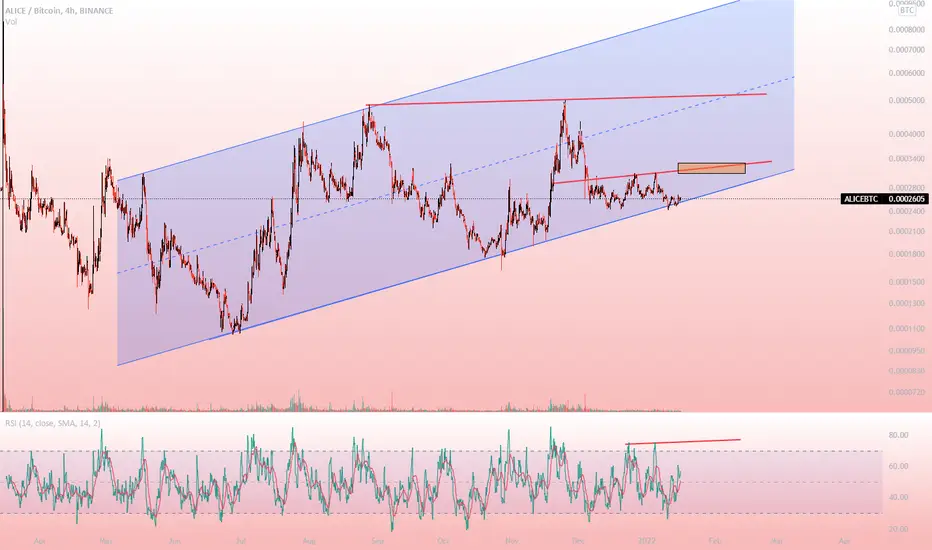
ALICEBTC price prepares to sacrifice for 130% growth
If you analyze the global picture on the ALICEBTC price chart, you can see a big consolidation triangle. Now the sellers are trying for the third time to test the lower trend line of this triangle. For this goal, the sellers need to lower the price of ALICEBTC by 13-15%.
But if you look carefully at the previous reversals of ALICE price - all of them were very aggressive and started exactly after the test of this trend line. Therefore, we assume another final wave of fall in the ALICE market. But in our opinion it will be final before the beginning of the positive period for all investors.
___________________________
We create both short-term ideas (for a local understanding of the market situation) and medium-term forecasts of price movements.
Subscribe to us and get daily concise analytics!

ALICE-USDTAnother Harmonic Pattern of ALICE-USDT is moving on Right Track but!!!!!! Please keep eyes on News and Take Out Your Profit and Investment whenever You Feel it OK

ALICE first step 20 then BOOM #ALICE is my masterpiece for 2022.
chart is obvious.
last time when she arrived here after some days of accumulation, reached midline in 9 days.
but what now??? its possible to reach 20$ sooner than last time. but DO NOT FOMO.
you can follow me on twitter: @atatrader

ALICEUSDT LONGTERM VISION (STRONG BUY)Hello friends.
Please support my work by clicking the LIKE button(If you liked).Thank you!
Everything on the chart.
We are stay on strong horizontal support,
We are above MA200 on 1D TF,
We are above trendline,
We are above horizontal volume on 1D TF,
RSX 1D TF on the bottom,
Also from 3$ to 23$ was impulse(5waves), after impulse should be atleast one more impulse, so in the worst case, we will see at least $ 35. At best, with a strong bull run, $ 65-75 looks quite real.
buy zone: 11-13$
midterm targets: 24 - 30 - 35$
longterm targets: 35 - 55 - (65-75$ zone)
after first target reached move ur stop to breakeven
cancellation of growth, consolidation below ~7.5-8$
stop: im w/o stop (depending of ur risk). ALWAYS follow ur RM .
risk is justified
Good luck everyone!
Follow me on TRADINGView, if you don't want to miss my next analysis or signals.
It's not financial advice.
Dont Forget, always make your own research before to trade my ideas!

Alice , update ..
No need to explain ,
i think it's super clear !
" Wait for reflexive patterns at the specified areas first "
good luck

MyNeighborAlice ALICEUSDT - Bearish Head and Shoulders- The price is currently breaking down the trendline established in Jun 2021.
- As we can see on the daily timefrrame, there is a huge rising wedge that is currently also breaking down.
- Looks bad as the bearish head and shoulders pattern is also breaking down the neckline.
- MACD bearish cross on the daily/weekly chart.

ALICE/USDTeverything is clear . wait for breakout .
we are not fortun tellers , we are just traders and we trade based on price actions

ALICE Possible Fractal PatternAlice is making similar patterns as previous ones on its daily chart so I expect it to repeat the next patterns as shown with the initial target at $19 and the main target at $33.
A daily candle close below $10 will invalidate this analysis

Have we lost you, ALICE? In my previous analysis (below), I showed how ALICE has been trading above long-term support since March 2021. Despite the brutal drops in BTC’s price, ALICE is still trading above its long-term support, but for how much longer?
The updated idea shows the key local support ranges as we approach the long-term support; they are approx every ~$0.50. There has been strong support today at the $11.30 level but it may only be a matter of time until it breaks.
From a trading perspective, these local zones can still be traded with tight stop-losses and care. For instance, when BTC was falling toward its 42.5k support a few days ago, ALICE was also falling but found strong support at $11.50 where it quickly rebounded to $12.42, which, if traded would have yielded an 8% profit within an hour. When trading these zones it is worth moving to lower time frames and always looking for confirmation of support before entering a trade.
Please note I am not a financial advisor and this is not financial advice. All ideas are for educational purposes only :)
Please feel free to leave your comments and thoughts below!

ALICE formed a bullish Bat that could result in 72% ProfitThe harmonic formed and you can see we have remained inside of this triangle ever since. I believe if, and when, we break out fo the triangle that we will go to each proit target.

ALICE-USDT Harmonic Pattern On Its Way Up Before a Bearish MoveALICE-USDT Harmonic Pattern On Its Way Up Before a Bearish Move, Buy Opportunity

ALICE BREAKOUT CONFIRMED!Alice is ready to fly beautifully as 50 EMA ribbon crossed 200EMA after bouncing from the strong support, indicating strong possible reversal from here for short-mid term. Buy and Hold this Beast for Nice Profit!

ALICE USDT BUY AND HOLD 30$ IS COMING alice usdt buy and hold for few days nice bounce from support show in chart buy some as per mention in the chart and hold for all targets
buy range 13.40-12.10-9.25
sell range 16-18-24-30
stop loss if the daily candle closes below 9.00$
if you like idea please like and share so other people also get benefit and get some quick profit

It can retest the $ 12 and $ 11 levelsALICE is in a correction on a daily timeframe, and if Bitcoin enters further correction, it can retest the $ 12 and $ 11 levels, entering the $ 11 or even $ 10 support step by step. Traders can enter for the $ 15.5 range if the $ 14 range is broken.
ALICEUSDT - SETUPALICEUSDT after printing a high at 28 dropped significantly and now testing the support zone around 12.0-13.0. There was a breakout last week at a shorter timeframe now price is moving in upward directing after retesting the breakout. We can expect a move towards 15.00. Good Luck!

ALICE Heading to Wonderland Long-Term AnalysisAlice has been trading inside this channel for some time with strong long-term support despite dips in the market. Plan to use DCA for entry and hold for the long-term. This idea is cancelled if a daily candle closes below the support.
Please note, I am not a financial advisor and this is not financial advice all ideas are for educational purposes only. Please do your own research.

ALICEUSDT Daily TA : 01.01.22 : $ALICEAll supports and resistances are marked on the chart. As we can see, the price is in an important range and recommended to keep an eye on it ...
Follow our other analysis & Feel free to ask any questions you have, we are here to help.
⚠️ This Analysis will be updated ...
👤 Arman Shaban : @ArmanShabanTrading
📅 01.01 .2022
⚠️(DYOR)
❤️ If you apperciate my work , Please like and comment , It Keeps me motivated to do better ❤️

My Neighbor Alice (ALICE) Buy ZoneMy Neighbor Alice (ALICE) Buy Zone
--------------------
BIAS
Mid-Term : Bullish
RISK : Medium
My Neighbor Alice broke out of triangle and looking for a short term support retest before an upside continuation. 67% profit potential
--------------------
$ALICE/USDT SPOT SETUP
Entry Price : 12.56 - 13.5
Short-Term
TP 1 : 14
TP 2 : 14.7
TP 3 : 15.25
TP 4 : 15.8
Mid-Term
TP 5 : 17.15
TP 6 : 18.75
TP 7 : 21
TP 8 : 22.6
Stop Loss : 10.9
*Stop Loss - ALICE daily close below 10.9
*Maximum 3% of Portfolio.
*Unload 12.5% at each TP. Whenever TP 2 hits, Move stop loss to entry.
--------------------

ALICE Targtes still same after this Dump..?#ALICE
#ALICE dumped because #BTC dominance increase and #Bitcoin down.
Now #ALICEUSDT good support is $13
and Retest and Support is $11.50
Don't forget to place SL at $11
Targets still Same.
AliceusdtWho else do not know about it. \
Signal ID# 193
🪙COIN: Alice/USDT
Exchnage : Binance .FTX , Kucoin
Direction : LONG ( Spot recommended
------------------
Position : 4%
Leverage : 3_5x
Risk : Low
Entries :
E1 : 15.3
E2 : 14.2
-------------------
Targets:
TP1: 16.08
TP2: 17.60
TP3: 19.24
TP4: 21.44
TP5: 32
TP6: 45
-------------------
Stop loss: 13.87
------------------
Your partner : Crypto With Fiverr Top rated Seller
