Allegion (NYSE: $ALLE) Prepares for Q4 Earnings: Will It Break?Allegion plc (NYSE: ALLE), a key player in the security hardware industry, is set to announce its Q4 earnings today before the market opens. The stock has gained 1.7% in premarket trading, reflecting cautious optimism from investors. With expectations of a 4.5% year-over-year revenue increase to $937.9 million and adjusted earnings of $1.75 per share, the question remains: will Allegion meet expectations or face another revenue miss?
Steady Growth Amid Mixed Performance
Last quarter, Allegion met revenue expectations, posting $967.1 million in sales, a 5.4% YoY increase. However, the company slightly missed organic revenue estimates despite surpassing full-year EPS projections. Over the last two years, Allegion has fallen short of Wall Street’s revenue expectations three times, adding an element of uncertainty heading into today’s report.
Comparing Allegion to its peers in the electrical systems sector, LSI reported a significant 35.5% revenue surge, beating estimates by 14.3%, while Vertiv grew 25.8%, exceeding expectations by 8.8%. Despite these positive trends, the sector has underperformed recently, with an average stock decline of 4.6% over the past month, and Allegion itself dropping 1.2% in the same period.
The broader market landscape in 2024 has been favorable. The Federal Reserve successfully controlled inflation without triggering a recession, leading to a "soft landing." Additionally, the election of Donald Trump in November 2024 has fueled market momentum. However, electrical systems stocks have lagged, making Allegion’s upcoming earnings report crucial for its near-term trajectory.
Technical Analysis
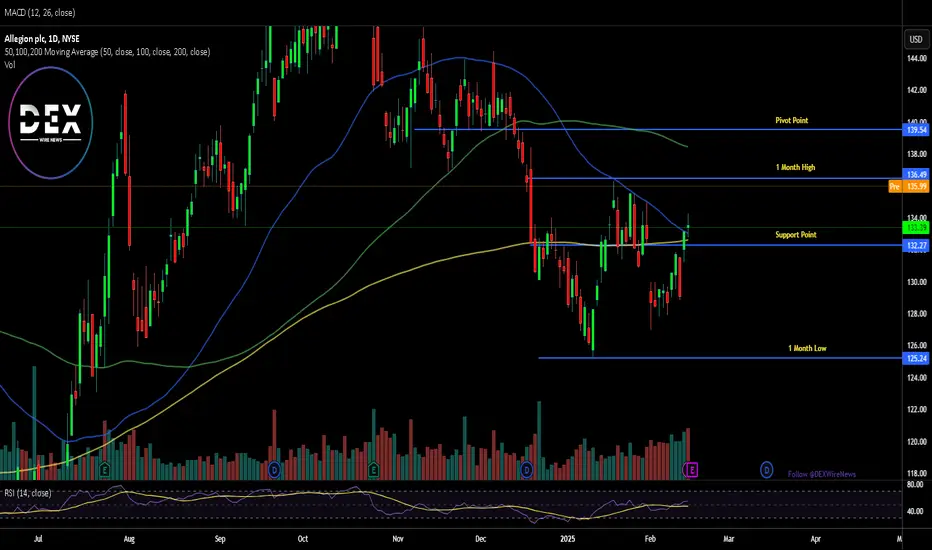
Currently, ALLE is up 1.95% in Tuesday’s premarket trading. The stock’s RSI stands at 54.83, indicating neutral momentum, while trading volume continues to rise ahead of earnings. If Allegion delivers strong Q4 results, it could break above its one-month high, which currently acts as a resistance zone.
On the downside, a negative earnings report could trigger a retracement toward the 38.2% Fibonacci retracement level. The direction of ALLE’s movement will largely depend on whether it can surpass investor expectations or confirm concerns about its revenue consistency.
What’s Next for ALLE?
With analysts maintaining stable estimates and market conditions favoring growth stocks, Allegion’s Q4 results will play a key role in determining its short-term price action. A bullish breakout could propel it towards the analyst target of $143.75, while a miss may lead to further downside. Investors should watch today’s earnings closely to gauge the stock’s next major move.
ALLE
🔐 Allegion: ALLE - Starting up from demand zone Hi mates another interesting idea with high Risk Reward!!!
As you see by two trendlines, uptrend in ALLE is incrasing in momentum. Now its definetely nice entry sweet spot on demand zone in 106 - 109 area. Target area is next supply zone at 119.30 - 194.36
My setup is following:
------------------------Trade setup ---------------------------
Entry: 109.80
Stop Loss: 106.23
Profit target: 120.01
------------------------------------------------------------------
If you like the idea, do not forget to support with a 👍 like and follow.
Leave a comment that is helpful or encouraging. Let's master the markets together.

ALLEGION 1D DESCENDING TRIANGLE SHORT TRADEDescending Triangles are repeatable trading chart patterns.
Descending chart patterns will have a directional bias depending on the previous incoming trend (Short Trade).
Each chart pattern will have defining trendlines of the support/resistance levels creating the pattern.
Whatever time frame you are trading this chart pattern, wait for a candle close outside of the trendline in the direction of the breakout candle. (Our time frame preference is the Daily chart).
Add volume indicator - Volume is the amount of $ that went into a particular candle or in Forex the # of trades that took place.
Add ATR indicator - Volatility is the amount of price movement that occurred. Use the ATR to measure the price movement.
When you see descending Volume bars and descending ATR line (which indicates volatility) this shows
a dis-interest in traders to invest in this pair creating consolidation which creates the chart pattern.
Trade Management after there is a breakout candle close.
1 - Position size (compare volume bar to volume ma line).
a - Breakout candle must be 100% of average volume for a full position size.
b - If 75% of average volume then ½ position size. (To find 75% of Volume
look at the charts volume settings – divide smaller # into larger # = 75%+)
2 - Enter two trades.
3 - SL for both trades will be 1.5 x ATR.
4 - 1st trade TP will be 1 x ATR.
5 - No TP on 2nd trade – letting profit run and adjusting SL to follow price.
6 - When 1st TP hit – move 2nd trade SL to breakeven.
7 - Adjust the 2nd trade SL to follow price.
*8 – After Breakout candle – if price closes back into chart pattern close trade
*9 - When breakout candle is more than 1 ATR from breakout candle open.
a - Enter 1st trade at candle close with ½ position size.
b - Enter 2nd trade with a pending limit order that is 1 ATR of breakout candle open.
c – Price should pullback to that pending limit order for 2nd trade.
d – If Price returns back into chart pattern close trade before SL is hit.
