$BTC/TETHER Daily Time Frame new ATH incoming?Bitcoin Market Outlook
Bitcoin has stalled after printing new all-time highs, now consolidating within a **supply zone** while forming a **bullish flag pattern**. Price is currently testing the **Fibonacci golden pocket** region (0.618–0.65), a critical level for potential reversal or continuation.
A **\$71M liquidation cluster** is stacked around **\$107,000**, just above current price—making it a key magnet for upward movement.
Bullish Scenario
* If price breaks above the supply zone and clears the \$107K liquidation area, we can expect a push toward **flag resistance**.
* A confirmed breakout from the flag could trigger **continuation to new highs**, supported by low resistance overhead and momentum from short liquidation.
Bearish Scenario
* If price fails to hold the golden pocket and breaks below **\$102,000**, a drop toward **\$99,000** is likely.
* This level is reinforced by **two unfilled Fair Value Gaps (FVGs)**, which may act as magnets for price rebalancing before potential recovery.
Let me know if you notice anything wrong with this, or have some charts of your own!
Thank you for reading.
Alltimehigh

MAXHEALTHCARE - Could Breakout from DTHMAXHEALTHCARE has resistance weakening on the Daily charts and may give a breakout with good volume in coming days.
The target of this pattern signals an upside potential of 15% from the current price level in the medium term.
The stock is trading above its 50- and 100-day exponential moving averages (EMAS) recently. Look for the range to more than 1.5X, and the Volume 1.5X the average.
CMP- Rs. 1149
Entry Price- 1200
Target Price- Rs1380 (15% upside)
SL- 1142
Need to wait for the entry to get triggered.
Disclaimer: This is not a buy/sell
recommendation. For educational purpose only. Kindly consult your financial advisor before entering a trade.

Bitcoin Hits New All-Time Highs — Rally Targets $130K+Bullish Momentum Accelerates:
Bitcoin has reached new all-time highs, confirming a strongly bullish technical outlook. Accelerating upside momentum and growing investor confidence are driving the current rally.
Breakout Confirmation:
A decisive breakout from a broadening wedge pattern has unlocked potential targets in the $130,000–$135,000 range, signaling a likely continuation of the uptrend.
Key Support Levels:
With Bitcoin now trading well above $106,000, the previous resistance at $108,000 is expected to act as strong support during any pullbacks — providing a clear risk threshold for traders.
Favorable Risk-Reward Setup:
This alignment of:
Strong momentum
Completed consolidation
Successful breakout
...creates a compelling risk-reward scenario and reinforces the case for continued upside in the current bull cycle.
Bitcoin may just be getting started on its next leg higher. 🚀🔥
#Bitcoin #BTC #AllTimeHigh #Crypto #TechnicalAnalysis #Bullish #Breakout #MarketMomentum #CryptoTrading #CryptoMarket

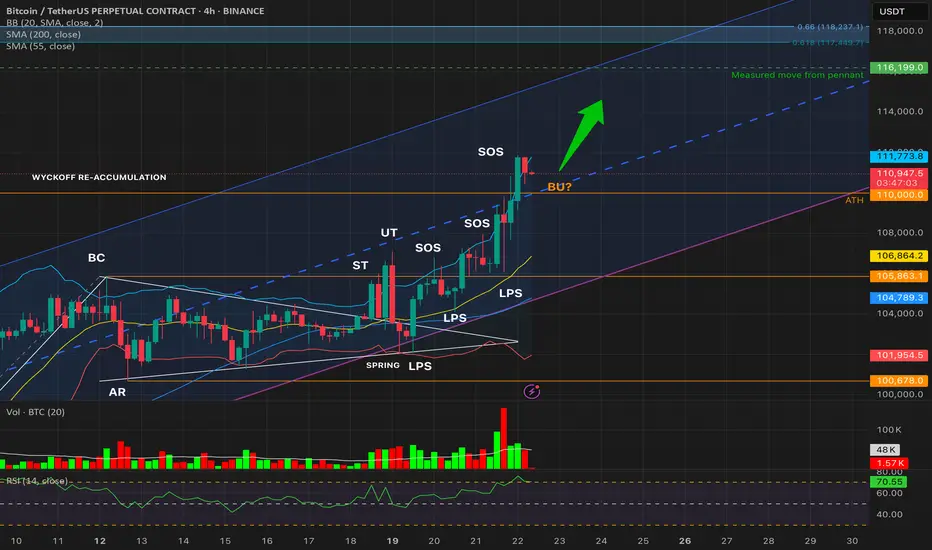
BTCUSDT – Wyckoff Re-Accumulation Breakout ContinuesBitcoin is advancing through a textbook Wyckoff Re-Accumulation structure on the 4H chart. After the Spring and multiple LPS confirmations, price surged above the previous range high (~110k), entering a strong Sign of Strength (SOS) rally.
We now observe:
✅ Second 4H candle close above ATH (110,000)
✅ RSI: 70.9 → Strong bullish momentum
✅ Volume: Above MA during breakout, healthy but slightly declining
✅ Bollinger Bands: Price hugging upper BB (111,227)
✅ Structure forming a Backup (BU?) test near ATH
The current move targets a measured pennant breakout projection:
🎯 TP1: 115,224
🎯 TP2: 116,199
🎯 TP3: 117,449 – 118,237 (Fib extension confluence)
This aligns with Wyckoff Phase E and continuation of the markup cycle.
No short setups valid — trend remains firmly bullish. Pullbacks to 110k could offer high-conviction long entries as BU confirmation.
#Bitcoin #BTCUSDT #Wyckoff #CryptoTA #BTCAnalysis #Reaccumulation #TradingView
BTC Back to $100K — The Final Dip Before All-Time Highs?Bitcoin has been trading slowly and steadily just below its all-time high at $109588. The key question now is:
💭 Is BTC ready to break through and print a new all-time high? Or does it need one more dip before liftoff?
Let’s break it down.
Elliott Wave Structure & Market Context
BTC recently completed a clean 5-wave impulsive structure, with Wave 5 topping out into a major resistance zone. That confluence included:
Value Area High (VAH)
Weekly resistance
Daily multi-level clusters
Final resistance zone before price discovery
After multiple rejections from this zone, BTC lacked the momentum for a breakout — so a retracement was expected.
And that’s what we’re now seeing: a textbook ABC correction.
📉 ABC Correction Breakdown
✅ Wave A: Dropped sharply, nearly tapping the psychological $100K level
✅ Wave B: Retraced into the prior resistance band between $106133 and $104464 — rejected perfectly off the 0.786 Fib of Wave A
🔄 Wave C: Now unfolding
To project the potential bottom of Wave C, we use the trend-based Fib extension (Wave A = Wave C). The 1:1 extension lands at:
🎯 $99875 — Right at the $100K psychological magnet
Add this confluence:
🟢 Key swing high at $99475
✅ 0.5 Fib retracement of the entire 5-wave rally
🔍 Psychological Level: $100K
🔑 Liquidity and demand zone
This makes the $99K–$101K area a strong, high-conviction support zone.
🟢 Long Trade Setup
Entry zone: Ladder between $101K – $99K
Stop-loss: Below GETTEX:97K
Target: New all-time high at $109588
R:R: ~3:1+
Structure: Correction into high-confluence zone + psychological level = high probability setup
📌 Summary:
BTC likely finishing Wave C of ABC correction
$100K = confluence of Fib, structure, psychology, and liquidity
Setup is simple: Wait for price to retest this zone and trigger your plan
If this level holds, BTC may be ready to attempt a breakout into price discovery
Let the chart come to you — and trade the reaction, not the anticipation. 📉🔁📈
____________________________________
If you found this helpful, leave a like and comment below! Got requests for the next technical analysis? Let me know.

Bitcoin Ready to Explode – Just Like Last TimeCRYPTOCAP:BTC is currently showing a powerful accumulation and breakout pattern, repeating the same bullish structure that led to explosive rallies in the recent past.
The chart highlights three key zones where Bitcoin consolidated before breaking out:
🔹 First breakout from the $81K–$86K zone
🔹 Second breakout above $93K after holding above the 50 EMA
🔹Now, Bitcoin is accumulating again just below a key resistance zone (~$105K–$106K)
This resistance zone has acted as a ceiling before, but the current price action suggests strength. The tight consolidation just below resistance often precedes a breakout — and if it happens here, Bitcoin could explode toward $115K+ in the coming weeks.
Key Technical Points:
🔹50 EMA is acting as dynamic support
🔹Higher low structure remains intact
🔹Each consolidation is followed by a strong upward breakout
Repeating accumulation breakout pattern is visible
Next targets: $111K → $115K → $120K
Invalidation: Breakdown below GETTEX:98K with strong volume
If you found this helpful, don’t forget to like, comment, and repost.
Thank you!
#BTC #BTCUSDT #Unichartz

Gold - New ATH in the making?Overall Market Context
This daily timeframe chart of Gold (XAU/USD) reflects a textbook example of a bullish retracement within a broader upward trend. The price has recently pulled back after printing a significant swing high, which is currently the all-time high (ATH). This retracement brings Gold into a high-probability reversal zone, aligning several technical elements that point toward potential bullish continuation.
Retracement Into A Confluence Zone
Price has retraced into a key technical area defined by the Fibonacci golden pocket (0.618–0.65) and a Fair Value Gap (FVG). The golden pocket is widely regarded as one of the most reactive retracement levels in Fibonacci analysis, where institutional participants often enter or scale into positions. The addition of an FVG overlapping this zone strengthens its importance. An FVG is typically created by an aggressive move that leaves behind inefficient price action or unmitigated imbalances, and in this case, it represents an area where demand previously overwhelmed supply.
The combination of the golden pocket and FVG creates a strong demand zone, from which a bullish reaction is expected if the overall macro sentiment remains supportive.
Bullish Reaction And Confirmation
Price wicked slightly below the FVG, likely triggering liquidity stops resting beneath prior swing lows before showing signs of a strong bounce. This type of price action—known as a liquidity grab or "spring"—is often a precursor to significant reversals when it aligns with higher timeframe bullish order flow.
The current bounce from this zone suggests that smart money may have accumulated long positions here. If price continues to hold above this zone, it confirms a successful defense of this key area and increases the probability of bullish continuation. The market is showing signs of shifting from a retracement phase back into an impulsive phase.
Break Of Structure And Targeting Buy-Side Liquidity
The next key area of interest is the buy-side liquidity resting above the most recent swing high, labeled as the "BSL" (Buy-Side Liquidity). If price breaches this level, it will confirm a break of market structure to the upside and signal a continuation of the overall bullish trend.
Such a break would invalidate the idea of deeper retracement and instead align with an impulsive leg that could target the previous ATH—and potentially exceed it. This makes the current zone a critical pivot point in determining whether gold resumes its long-term bullish trajectory.
New All-Time High Scenario
Should the BSL be breached and momentum maintained, price is likely to head toward printing a new all-time high. From a psychological and technical standpoint, the break of an ATH often leads to price discovery, where resistance is minimal, and price action becomes more volatile and parabolic.
Traders and institutions monitoring historical highs often front-run such moves or aggressively participate once confirmed, driving increased volume and volatility. This behavior can lead to rapid upside extension, especially when supported by macroeconomic narratives such as inflation hedging, geopolitical tensions, or declining real yields—all traditionally bullish catalysts for gold.

BTC - ATH Incoming?current market structure
this 1-hour chart of btcusdt presents a sophisticated transition from accumulation to a potential breakout structure, with well-defined fair value gaps (fvgs) and a clear instance of manipulation followed by rapid recovery. the market appears to be attempting to regain bullish momentum following a liquidity sweep and subsequent internal shift in structure.
accumulation within an ascending channel
price action developed within an ascending channel, marked by higher highs and higher lows over time. this is a classic representation of controlled bullish accumulation. the tight, stair-stepping movement reflects steady institutional positioning, building long exposure while keeping volatility contained. this phase shows multiple rejections of the lower trendline, confirming consistent demand.
manipulation into fvg
the breakdown beneath the channel coincides with a sharp move into a large fvg (highlighted in light blue). this aggressive wick likely triggered stop-losses of retail longs, constituting a liquidity grab or manipulation event. such actions are typical after extended consolidations, flushing out weak hands to enable large players to enter at a discount. the reaction from this zone confirms its significance, as buyers immediately stepped in and reclaimed lost ground.
recovery and shift in momentum
after manipulation, the market found support in the fvg zone and launched a sharp bullish move. the rapid recovery illustrates strong underlying demand. the price re-entered a smaller fvg (labelled “resistance in this fvg”), briefly faced selling pressure, and then decisively broke through it. this reclaim of supply zones is often a powerful signal that bullish momentum is back in control.
bullish inversion fair value gap (ifvg)
price is now challenging a smaller bullish internal fair value gap (ifvg), marked in red. this zone, which once acted as a resistance layer, has now become a pivot point. successful hold or breakout above this region would likely trigger continuation, with market participants targeting previous swing highs or beyond.
break of structure and bullish continuation
a key development here is the break above the previous swing high or "bsL" (buy-side liquidity). this signifies a structural shift—no longer just recovering, the market is actively seeking higher liquidity. such breaks often catalyze rapid directional movement, especially when they occur after liquidity has been swept from the opposite side.
distribution and potential for new all-time high
the green projection suggests the possibility of further bullish expansion toward a distribution zone. if current momentum continues and no major supply zones disrupt the advance, the market could be on its way to challenge or set new all-time highs (ath). the label “on the way to new ath?” reflects this open-path scenario, contingent on continuation above 105,600–106,000 levels.
market psychology
this chart reveals a narrative of engineered manipulation followed by strength confirmation. institutions manipulated price below support to shake out retail traders, then absorbed that liquidity and pushed price higher. once resistance was reclaimed, confidence returned, inviting both short cover and fresh long entries. such sequences reinforce the importance of waiting for price reactions at key levels rather than acting on the first impulse.
summary
btc has exited an accumulation phase within a rising channel, experienced a strategic liquidity sweep into a deep fvg, and then quickly reversed. the current positioning above multiple reclaimed fvgs and just beneath a structural break confirms a bullish outlook. if price holds above the current bullish ifvg, the pathway to distribution and possibly new highs remains open. strategic traders may now focus on confirming pullbacks into these reclaimed zones for continuation setups.

BTC - Bulls vs Bears! Who will win?current market context
the chart displays btcusdt on the 1-hour timeframe, currently in a consolidation phase following a strong impulsive move to the upside. this phase is characterized by a range-bound price action forming a horizontal channel, with clear resistance near the top of the range and support near the bottom. the price is fluctuating between these two levels, indicating temporary equilibrium in the market where neither buyers nor sellers have established dominance.
consolidation structure
this range is acting as a reaccumulation zone, typically formed after a significant move when the market pauses to either absorb liquidity or distribute orders before the next impulsive leg. within this range, traders are positioning themselves for a potential breakout, and institutional players may be accumulating or offloading large positions depending on market intent. the balance within the range suggests that market participants are awaiting a catalyst before committing in size to a direction.
bullish breakout scenario
if price breaks above the range high, it would signal bullish continuation. such a breakout would likely occur with increased volume and a strong momentum candle, confirming buyer interest and initiating an expansion move. this move could target new highs, potentially opening the path toward all-time highs as the breakout clears short-term liquidity and invalidates local bearish structures. the green projection on the chart visually outlines this potential path, where the breakout leads to higher prices with minimal resistance above.
bearish breakout scenario
alternatively, a breakdown below the range low would indicate a shift in short-term market sentiment and a break in bullish structure. this scenario would likely trigger sell-side liquidity and initiate a quick move toward lower fair value gaps. these gaps, left unmitigated during the previous bullish rally, now serve as potential targets for price to fill. the red arrow illustrates a scenario where price pierces below support, accelerates lower, and seeks inefficiencies and demand zones around the \$98,000–\$95,500 levels. this breakdown would likely be sharp, driven by stop-loss triggers and sell-side imbalances.
range as a decision zone
the current structure represents a critical decision zone. the upper and lower boundaries are pivotal breakout levels, and the outcome of this consolidation will determine the short- to medium-term market direction. traders should exercise caution while price remains within the range, as fakeouts or liquidity sweeps are common near such levels. confirmed structure breaks and volume surges should serve as validation tools before entering directional trades.
liquidity and volume considerations
liquidity resting above and below the range acts as fuel for the eventual move. the longer the range holds, the more liquidity builds on either side, increasing the probability of a strong expansion when price finally breaks out. volume analysis will be key in validating the breakout’s legitimacy—without accompanying volume, the breakout could fail and result in a false move or whipsaw.
summary
this setup provides a high-probability environment for breakout traders and those waiting to trade the trend continuation or reversal. the market is compressing within a well-defined range, and a decisive breakout is likely imminent. preparation, not prediction, is the priority—wait for confirmation of structure shift and volume expansion before committing to either side.

BTC - Accumulation, Manipulation & Distributioncurrent market structure
this btcusdt 1-hour chart illustrates a classic three-phase market structure: accumulation, manipulation, and potential distribution. the price action follows a strong bullish impulse, after which the market enters a sideways range suggesting absorption of previous selling pressure. this kind of behavior is often observed before a continuation of the prevailing trend, but not without intermediate structural games, as seen in the projected manipulation phase.
accumulation phase
the blue highlighted zone marks a consolidation range that serves as an accumulation phase. during this stage, large market participants likely accumulate positions quietly while maintaining the price within a defined range. the tight price action within this zone and relatively small candles are consistent with market absorption, where supply is being matched or outpaced by demand. the repeated rejections of lower prices in this range imply growing buyer interest and strength building beneath the surface.
unfilled fair value gap
beneath the accumulation range lies an unfilled fair value gap (fvg), shown in grey. this price imbalance was left behind during the prior bullish leg and remains a magnet for price action. such gaps often attract price as the market seeks efficiency by mitigating unbalanced areas. the presence of this fvg makes it a likely candidate for a liquidity grab or retest before further bullish continuation.
manipulation setup
the red path outlines a possible short-term manipulation event. this move involves a quick sweep of liquidity beneath the accumulation zone, triggering stop-losses from late long entries and drawing price into the fvg. this is a classic “spring” or “shakeout” scenario designed to trap sellers and create panic, thereby enabling larger players to enter at discounted prices. the manipulation tag here signals a deliberate attempt to create false downside conviction before reversing upward.
re-accumulation and breakout
following the manipulation phase, the green projection shows a sharp reversal and aggressive push upward, initiating a new bullish leg. this move represents re-accumulation, where price quickly exits the range and enters an expansion phase. momentum will likely increase after price breaks back above the original range high, signaling confidence in the trend continuation and drawing in breakout traders. the large green area indicates the expected path toward a new distribution zone.
distribution projection
at the top of the chart, the green box represents a possible future distribution zone. after an extended bullish run, price often enters distribution, where buying interest begins to wane, and larger participants start offloading positions into retail strength. although speculative at this point, its placement reflects the natural progression of a market cycle if the projected bullish move plays out.
market psychology
this chart reflects a clear sequence in market psychology: stealth accumulation, a manufactured dip to create fear (manipulation), followed by a surge fueled by both institutional entries and retail breakout traders. understanding this dynamic helps traders anticipate rather than react, positioning themselves in alignment with likely intent rather than emotional impulses.
summary
the chart outlines a structured bullish scenario with a potential manipulation wick into an unfilled fvg, setting the stage for a continuation higher. if price reacts strongly off the fvg and regains the range, confirmation of bullish intent would be established. this setup emphasizes the importance of understanding liquidity dynamics and price inefficiencies, favoring patient and strategic entries over reactive ones.

BTC Technical Market Update! $110,000?Bitcoin (BTC) Technical Market Update
Over the past several trading sessions, Bitcoin (BTC) has demonstrated a pattern of strength, particularly visible on the 4-hour chart. Price action has consistently respected the Fair Value Gap (FVG) zones on this timeframe, taking support from these areas without breaching any significant downside levels. This repeated behavior indicates a strong underlying bullish sentiment, suggesting that market participants are actively defending key support zones.
Furthermore, Bitcoin recently approached a high-liquidity resistance zone—a level that historically acts as a supply barrier—and not only absorbed the liquidity but also decisively broke through it. This move implies that bullish momentum is firmly in control, and short-term resistance levels are being invalidated one after another. The market structure remains intact, with higher highs and higher lows supporting the current trend.
As of now, BTC has just bounced from a 4H FVG and is trading above that support. However, a short-term pullback remains possible. If such a retracement occurs, it is expected to revisit the next significant 4H FVG support zone, which lies approximately between $98,800 and $97,400. This area could act as a strong accumulation zone for buyers, potentially fueling another bullish wave. In the case of renewed upward momentum from this level, Bitcoin could target the $101,000 to $105,000 range in the short to mid-term.
Market participants are advised to remain cautious and observe price behavior as it unfolds in the coming days. Technical setups are aligning in favor of the bulls, but volatility may increase near key resistance and support levels. Always base your trades and investment decisions on thorough analysis, and keep in mind that no setup guarantees results.
Disclaimer: This is not financial advice. Please ensure you conduct your own independent research and analysis (DYOR) before making any trading or investment decisions.

Amazon - Look At This All Time High Retest!Amazon ( NASDAQ:AMZN ) will create the bottom soon:
Click chart above to see the detailed analysis👆🏻
The trend on Amazon is clearly towards the upside and the recent correction of about -30% did not change that at all. Rather, we are now witnessing an extremely bullish all time high break and retest and therefore, if Amazon actually creates bullish confirmation, this could form a bottom.
Levels to watch: $180
Keep your long term vision,
Philip (BasicTrading)

BTC – One last pushmarket context and structure
This BTCUSDT 4-hour chart from BYBIT provides a broader perspective on BTC’s ongoing uptrend, emphasizing the role of fair value gaps in guiding price behavior. After a prolonged period of sideways action and consolidation, BTC initiates a sharp bullish impulse that breaks previous structure and introduces fresh momentum into the market. Each leg higher is followed by a corrective phase, during which multiple fair value gaps (FVGs) are formed. These FVGs serve as structural inefficiencies left by aggressive buying pressure and outline key zones of interest for future price interaction.
fair value gaps and institutional demand
The chart identifies three key FVGs that have influenced BTC’s price action. The lowest FVG, created during the initial breakout below the 89,000 zone, is the origin of this current bullish leg and reflects strong institutional involvement. The mid-level FVG, created as BTC pushed through the 94,000–96,000 region, marks another significant shift in order flow. The most recent FVG, created just prior to the most recent impulse, lies just beneath the 98,000 level and represents a more immediate zone of demand. Price is currently trading above this uppermost FVG, indicating that it may act as a reaccumulation zone if price retraces.
liquidity dynamics and continuation thesis
The projection drawn on the chart suggests a short-term retracement back into the upper FVG before a potential continuation higher. This idea is rooted in the expectation that institutional participants will revisit unfilled orders left within the FVG before driving price upward toward new liquidity pools. The light blue shaded zone indicates the potential target range for this continuation. The market has consistently respected prior FVGs, confirming their role as reliable demand zones and reinforcing the current bullish bias.
price behavior and structural clarity
BTC’s price action on this timeframe is characterized by impulse–correction cycles with clearly defined inefficiencies. Each impulse leaves behind an FVG, which is either fully or partially mitigated during pullbacks. The most recent bullish leg has created an unmitigated FVG directly beneath current price, suggesting that if a retracement occurs, it is likely to interact with this gap before continuing the upward trajectory. This behavioral pattern of clean imbalances followed by targeted mitigation is a strong indicator of organized institutional involvement in the market.
interpretation and tactical insight
The chart outlines a strategic approach to navigating BTC’s current bullish structure. Rather than entering impulsively, the analysis encourages waiting for price to retrace into identified imbalance zones where the probability of sustained movement is higher. Fair value gaps provide a roadmap for understanding where price is likely to react and continue. In this case, if BTC revisits the nearest FVG and holds that level, it sets the stage for continuation toward the 101,000–102,000 zone, in line with the drawn projection. The setup remains aligned with smart money trading methodology, where price is guided by liquidity and imbalance mechanics.

GOLD - Bullish Structure with Potential Continuation PlayThe current 1-hour chart of Gold (XAU/USD) demonstrates a clean bullish structure supported by an ascending channel and multiple unmitigated Fair Value Gaps (FVGs) acting as potential demand zones. This setup highlights the strength of the ongoing uptrend and offers insights into a high-probability continuation entry should price retrace.
Market Context and Trend Structure:
Following a prolonged downtrend visible in the earlier part of the chart, Gold reversed decisively with a bullish break of structure. Since then, price has been consistently printing higher highs and higher lows while respecting an ascending parallel channel. This channel, marked by two trendlines, encapsulates the short-term bullish momentum.
The current move is strong and impulsive, suggesting that institutional order flow is behind this leg. Candles are elongated with minimal wicks on the upside, reinforcing the idea of aggressive buying pressure.
Key Demand Zones and FVG Analysis:
Three major Fair Value Gaps (FVGs) have formed along the recent bullish leg, each potentially acting as a zone of reaccumulation. These FVGs are marked in green and correspond to areas where price left inefficiency after strong upward moves without immediate retracements.
* The most recent FVG, located just beneath current price, aligns with a minor structure support zone and overlaps partially with the lower boundary of the ascending channel. This area stands out as a prime candidate for a bullish continuation entry, particularly if price retraces and shows signs of holding.
* The middle FVG, slightly lower in the structure, represents a deeper mitigation level and could serve as a secondary entry in case the initial zone fails to hold.
* The lowest FVG is a broader inefficiency zone that formed near the base of the bullish reversal. If price returns this far, it would likely signify a temporary shift in momentum or deeper liquidity hunt before another leg upward.
Channel Structure and Momentum:
The ascending channel has been respected throughout the rally, offering visual confirmation of trend strength and the rhythm of pullbacks. The current price is near the upper boundary of the channel, and a short-term retracement is a logical expectation before continuation.
A pullback into the FVG + lower channel region would represent a convergence of structure, imbalance, and trendline support. These overlapping technical elements enhance the probability of a bounce from this zone.
Projected Path:
The chart also suggests a conservative bullish continuation projection, aiming toward the zone marked around 3449.12. This level appears to be a measured move extension and a safer target in relation to the overall structure. However, the note on the chart implies that the all-time high (ATH) could also be in play if momentum continues and market conditions remain supportive.
The key here is the behavior around the nearest FVG. If price retraces and holds this area—potentially forming a bullish engulfing or confirmation on lower timeframes—it may offer an ideal continuation entry with minimal drawdown.
Conclusion:
This Gold 1-hour chart reflects a strong bullish structure with clear institutional footprints left in the form of unmitigated FVGs. The alignment of ascending channel support and bullish imbalances creates a favorable setup for continuation traders. Watching the immediate FVG zone will be critical, as it may define the next impulsive leg toward higher targets. If that zone fails, deeper FVGs below offer secondary opportunities while maintaining the bullish bias as long as structural higher lows remain intact.

Force motors all time high breakoutThis is weekly chart of force motors. The stock is heading towards all time high of 10277.85 with very high relative volume last week. This may increase the probability of breakout of all time high. Time will tell. Must add for a watchlist.

Will Gold Retest 3170 ATHs in Sight Amid Rising Global TensionsXAU/USD has decisively broken above the significant 3170 resistance level, confirming bullish momentum and signaling a potential continuation of its long-term uptrend. This breakout is not just technical—it's backed by a growing fundamental storm.
With escalating geopolitical tensions, the ongoing trade war rhetoric surrounding Trump’s tariff policies, and persistent global macro uncertainty, gold is once again asserting its role as a premier safe haven asset. These drivers are creating the perfect backdrop for further upside, possibly pushing gold toward new all-time highs.
Currently, price is in a healthy correction phase, pulling back toward the former resistance zone at 3170, which now acts as strong support. A retest and confirmation in this area may offer a high-probability long setup for trend-followers and breakout traders alike.

Ethereum - The Perfect Crypto Trade!Ethereum ( CRYPTO:ETHUSD ) is retesting massive support:
Click chart above to see the detailed analysis👆🏻
For the past four years, Ethereum has overall been trading sideways with significant swings towards the upside and downside. As we are speaking, Ethereum is retesting a significant confluence of support and if the bullrun actually continues, Ethereum will rally parabolically.
Levels to watch: $2.000, $4.000
Keep your long term vision,
Philip (BasicTrading)

Solana - The Bullrun Is Not Over Yet!Solana ( CRYPTO:SOLUSD ) might create another move higher:
Click chart above to see the detailed analysis👆🏻
As we are speaking Solana is sitting at the exact same level as it was about 3.5 years ago in the end of 2021. In the meantime we saw a lot of volatility and Solana is now once again retesting a major previous support level. Despite the harsh recent drop, the bullrun remains valid to this day.
Levels to watch: $120, $250
Keep your long term vision,
Philip (BasicTrading)

Dogecoin - You Should Not Be Afraid!Dogecoin ( CRYPTO:DOGEUSD ) could reverse right now:
Click chart above to see the detailed analysis👆🏻
Four months ago Dogecoin perfectly retested the previous all time high and is now creating the anticipated bearish rejection. However during every bullish cycle we saw a correction of at least -60%, which was followed by a parabolic rally, so there is no reason to be worried at all.
Levels to watch: $0.2, $0.5
Keep your long term vision!
Philip (BasicTrading)

Gold - They All Call Me Crazy!Gold ( TVC:GOLD ) is just starting the next rally:
Click chart above to see the detailed analysis👆🏻
Just a couple of months ago, Gold perfectly broke out of the long term rising channel formation. After we then witnessed the bullish break and retest confirmation, it was quite clear that Gold will head much higher. This just seems to be the beginning of the next crazy major bullrun.
Levels to watch: $4.000
Keep your long term vision!
Philip (BasicTrading)

Dogecoin - New All Time Highs Will Come!Dogecoin ( CRYPTO:DOGEUSD ) still remains bullish:
Click chart above to see the detailed analysis👆🏻
If you look at the chart above, you can see almost only green mark ups. That's because despite the recent drop, Dogecoin remains in a very bullish market and is overall clearly heading higher. If this break and retest now plays out, we will even see new all time highs in the future.
Levels to watch: $0.2, $0.5
Keep your long term vision,
Philip (BasicTrading)

S&P500 $SPY | SPY’s All-Time High - Where to Next? | Feb23'25S&P500 AMEX:SPY | SPY’s All-Time High - Where to Next? | Feb23'25
AMEX:SPY BUY/LONG ZONE (GREEN): $597.50 - $613.23
AMEX:SPY DO NOT TRADE/DNT ZONE (WHITE): $584.88 - $597.50
AMEX:SPY SELL/SHORT ZONE (RED): $574.00 - $584.88
AMEX:SPY Trends:
AMEX:SPY Weekly Trend: Bullish
AMEX:SPY Daily Trend: Bullish
AMEX:SPY 4H Trend: Bullish
AMEX:SPY 1H Trend: Bearish
AMEX:SPY just reached a new all-time high! How did price get there?
AMEX:SPY experienced a small range between 602.45 – 604.00, followed by bearish momentum, leading to a 3% drop in price. However, bullish momentum quickly stepped in, pushing the price up before continuing downward again. This bearish trend was short-lived and appears to have formed a developing range rather than a sustained downtrend.
Shortly after, price broke back above 597.50, signaling the start of a new bullish trend. SPY then established a ranging pattern between 597.50 - 608.00 before ultimately breaking out to a new all-time high of 613.23. Despite the breakout, price action has now dropped back into the range between 597.50 - 608.00.
Where to next? Will SPY hold its new highs, or is this the start of a reversal?
This is what I would personally look at before entering trades, everything is subject to change on a daily basis and as I analyze different timeframes and ideas.
ENTERTAINMENT PURPOSES ONLY, NOT FINANCIAL ADVICE!
trendanalysis, trendtrading, priceaction, priceactiontrading, technicalindicators, supportandresistance, rangebreakout, rangebreakdown, rangetrading, chartpatterntrading, chartpatterns, spy, sp500, s&p, fed, federalreserve, fedrate, AMEX:SPY , snp, snp500, usmarket, usmarkets, stockmarket, overallmarket, spyath, spyalltimehigh, all-time high, price action, bullish trend, bearish momentum, trading range, breakout, support and resistance, choppy market, untradable zone, stock market, technical analysis, market trends, price breakout, volatility, trend reversal, stock trading, SPY analysis, market momentum, trading strategy, sparros, sparrosexchange,

S&P500 - The 2025 Bullrun Just Started!S&P500 ( TVC:SPX ) will rally massively during 2025:
Click chart above to see the detailed analysis👆🏻
Over the past couple of years, the S&P500 has perfectly been respecting the trendlines of a rising channel formation. After the recent rally of +70%, it is quite likely that - following the 2020 cycle - we will see another final rally of about +20% before the S&P500 will correct itself.
Levels to watch: $7.000
Keep your long term vision,
Philip (BasicTrading)
