🔥 ANKR All Time High Break OutThis morning, ANKR has finally breached the previous all time high resistance after four days of consolidation around the resistance. In the end, it was only a matter of time.
Now that we have a convincing break out on our hands, we can trade into that direction. Please wait for the daily candle to close above the resistance before entering a trade.
On the chart I’ve marked two potential areas of resistance, R1 and R2. These areas are based on round numbers, $0.25 and $0.30 respectively. Do your own due diligence.
Happy trading!
Alltimehigh

Bitcoin (BTC/XBT) Daily Long&Short Trade Setups 2021/02/09Hi guys, if you like this post, please support me by clicking the like and follow buttons and leaving a comment! Thanks!
I will be sharing the trades that I take in real time, follow to see how my trades work out!
Also check out my daily analysis on Ethereum!
Market Overview
Price Action: Bitcoin had a huge breakout after Tesla announced it had bought $1.5B in Bitcoin and created a high ATH @ $47.5K and looking to continue higher
Patterns: N/A
Areas of Interest: The area(s) of interest for me are the ATH @ $47.5K and the 200MAs @ $40.5-41.5K. Once price reaches one of these areas, I will monitor for entry confirmations. If the entry confirmations are aligned, I will take a trade and share the my trade in real time.
Trade Setups
Below are the potential trade setups that I would be interested in trading:
Long Trade Setup #1: Retest and Continuation (200MAs)
1. Price Action: Price needs to move back down to the 200MAs, currently projected to be @ $40.5-41.5K by the time price reaches it, and bounce back up.
2. Trade Entry Confirmations: Bullish candlestick pattern, above average volume, MACD bottoming
Short Trade Setup #1: False Breakout
1. Price Action: Price breaks above and then falls below the high @ $47.5K, forming a bull trap
2. Trade Entry Confirmations: A breakout candlestick followed by a breakdown candlestick, above average volume on both breakout candle and breakdown candle, MACD topping out
My Recent Trades
2021/ 02/04: I had a winning trade! I entered long @ $$36,819.0, SL @ $$36,528.0, price reached a high of $37,783.8, giving a risk reward ratio of 3.3:1.
2021/ 01 /31: I had a winning trade! I entered long @ $33654 SL @ $33292, price reached a high of $34220, giving a risk reward ratio of 1.6:1.
2021/ 01 /29: I had a winning trade! I entered short @ $37.2K SL @ $38150, price reached a low of $33500, giving a risk reward ratio of 3.9:1.
About Me
I started trading in 2008, first got introduced to bitcoin in 2009, and have been actively trading cryptocurrencies since 2016.
I have worked on Wall Street trading bonds, stocks, and options.
I have taken hundreds of live trades, each recorded with over 50 data points, all meticulously analyzed, using data analysis and modeling to optimize win probability and risk reward.
Why Follow Me
Daily analysis on the latest market movements and price zones for high probability trade setups.
Sharing of live trades that I take.
A great place to help each other, learn from each other, and grow together.
Trading education including a comprehensive cryptocurrency trading eBook, personal advice, and other educational materials
Constantly testing and adding new trading strategies and refining battle-tested ones.
DISCLAIMER: I am NOT a financial advisor and this post is NOT financial/investment/trading advice. I will not be responsible for any actions you take based on the analysis and comments that I provide. I am simply sharing what I am doing, and is not meant to be investment or trading advice. What you choose to do with the information that I provide is your own sole responsibility! The cryptocurrency market is extremely volatile, and you WILL lose all your money if you are inexperienced! DO NOT risk any money that you cannot afford to lose and always be cautious and manage your risk!
Please support me by liking, sharing, commenting, and following, and sharing your ideas and analysis below! Thanks!

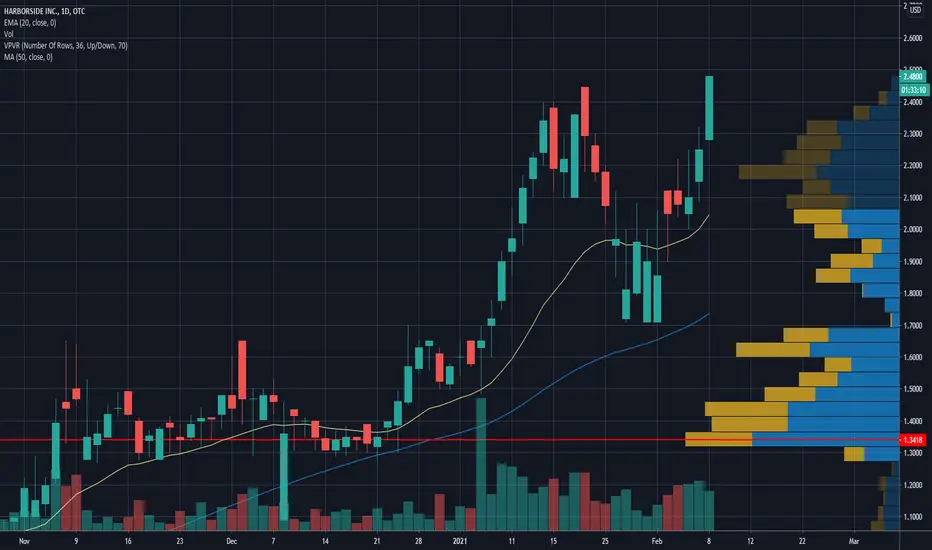
$HBORF - ATHAll time high! No pun intended. I like this company longer term as a pot stock play. Already in.
A clear corrective structure on NIO INCGeneral Description
NIO is a Chinese automobile manufacturer headquartered in Shanghai, specializing in designing and developing electric vehicles.
NIO was founded in November 2014 by William Li, the Chairman of Bitauto and NextEV. After launch, several companies invested in NIO, including Tencent, Temasek, Baidu, Sequoia, Lenovo, and TPG.
Technical View:
-On January 8, the price broke a range between 40 and 54 with a top on 67
-After the ATH, the price started a corrective movement finding support on the broken range
-Now, we expect a breakout of the current corrective structure, and we are looking for a target at 84.00
-Our Entry level is above B, and our stop loss is Below C. We will use the First fibo Extension as a Break-Even level and the second level as the Final Target.
-IF everything goes as planned, we expect a movement between 30 to 50 days towards the Final Target.

🔥 CRV/USDT Back To Former GloryCRV/USDT has been gaining ground rapidly since the start of 2021, gaining more than 450% since the first of January. Since CRV is on a roll since a long time, I can see CRV reaching the price of its inception.
On the chart I’ve marked two potential areas of resistance, R1 and R2. These areas are based on old swing highs and round numbers. Do your own due diligence.
Happy trading!

SI SILVERGATE ALL TIME HIGHI will normally buy when price breaks ALL TIME HIGH. In this case, I am preempting that price will break all time high. It is probably 2-3 days early but I am going to buy when regular market opens.

Stocks Make New Highs!! Next Targets??Stocks broke through to new highs yesterday. The Kovach OBV suggests there was a lot of momentum here, and there had to be. The S&P formed a double top back in January validating the importance of 3867. It broke through and is currently having trouble with 3887. This is a level we called out last month, which was a Fibonacci Extension. The S&P is pretty extended right now, so we can expect a retracement, perhaps off 3887 to highs at 3867 or perhaps 3848. No one can deny the momentum in stocks, the Kovach OBV is quite strong. So eventually we will break through 3887 and hit 3928, then 3937. These are two somewhat proximal levels garnered from Fibonacci extensions. Note the vacuum zone between current levels and these targets. If the S&P is able to break new highs, it should sail through to those targets soon after.

🔥 OCEAN/USDT Massive Break Out: New All Time HighsThis morning, OCEAN managed to beat its previous all time high of $0.72. The new ATH was formed with a massive spike in volume, which resulted in an increase of over 15% in value in a single day. Such a blast through an important resistance/support generally means a strong shift in trend for a longer period of time.
Seeing the bullishness of the total altcoin market, I think we will see some more gains for OCEAN in the coming days.
On the chart I’ve marked two potential areas of resistance, $1 and $1.20. Since we're in a new trading territory it's hard to pinpoint exact resistances. The main resistance on the chart is the $1 resistance. Do your own due diligence.
Happy trading!

Weak pull back after breaking into ATHBreaking into ATH over 3 years, and only a weak little pull back, with no volume?
Get ready for price discovery. Punch your ticket now!

ETHEREUMETH is breaking out of this ascending triangle on the 4hr and is breaking above daily resistance, new all time high is coming waiting for a 4hr candle close above resistance then we can long

Historic ETH success! What's next?Yesterday we experienced history as ETH hit an all-time high! It was not a clean slate cut - before ETH could even breach 1500 mark, it was heavily shorted and had to go up and down around 9 or 10 times before it hit 1502. Once resistance was broken, ETH took off! Across multiple platforms, you could see ETH frenzy. Many were celebrating and many were crying. We are also seeing a new pattern in the crypto market. Instead of reaching ATH and going down with a large dump, ETH wabbled a little and then the short squeeze kicked in. Gut feeling says that someone just accidentally stumbled into "holy sh*t have you seen shorts books* and instead of dumping, pumped ETH a little more!
So what does that mean for today? Will it go up? Will it go down? Sideways all around? Track whales and you will find your answer!
Today's technicals: Position should be Long (Eye of the storm, be vigilant Short and Long as per your better judgement). Forecasted hights 1600 with no hard ceiling. Forecasted lows 1520 with potential to implode if you all of the sudden start seeing large red candles!
Have fun and keep that volatility rising! 💸💸💸

WAN is a sleeping giant - and its about to wake up!!!Don't miss this sleeping GIANT guy - wan is showing many strong bullish sings and expect this coin to rise very fast once we break the reistiance zone, considering what the team is up too and have installed for 2021 this coin is going to long term goes well beyond its all-time high!

Breaking barriers...ETH looks poised to break ATH levels today. If we see a resumption off the ATH level as support I will be adding to my investment in ETH.

$ETH re-testing all-time highMomentum is picking up, the volume is slightly increasing, MACD is turning bullish. Is this going to be the moment to break the all-time high and start our altcoin season? If not now, then when? If we break down the up going trendline we may actually face a bearish market for a bit before we retest the all-time high again. Let's see where this goes.

$ETH/USDT 2h (Binance Futures) Symmetrical triangle on supportEthereum road to new ATH, this time for good?!
Current Price= 1333.97
Buy Entry= 1333.99 - 1316.69
Take Profit= 1417.16 | 1480.46 | 1565.22
Stop Loss= 1251.68
Risk/Reward= 1:1.25 | 1:2.1 | 1:3.25
Expected Profit= +13.84% | +23.40% | +36.20%
Possible Loss= -11.12%
Fib. Retracement= 0.786 | 1 | 1.272
Margin Leverage= 2x
Estimated Gain-time= 120h

$DJI GREAT DEPRESSION ALERTFolks money can’t continue to print out of thin air to pump stocks forever! This is a warning, we are at the final stretch before our overvalued markets collapse!


GBPJPY Bullish OR Bearish PossibilitiesThis is a simple analysis for GBPJPY could break the level of a 5 month old high and can make that level a support OR could come back reversal to the bottom level and make the previous high as a resistance zone..
Comment your thoughts :)

🔥 Bitcoin Strong Break Out Of TriangleIn my previous Bitcoin posts I argued that Bitcoin was in for a strong movement since the triangle pattern was almost finished. On the previous occasions I mentioned that this triangle is a bearish one, therefore I was leaning towards the bearish side of the break out.
Bitcoin, on the other hand, doesn't feel like correcting at all. It just broke out of the bearish triangle with one of the biggest bullish candles we have seen in months. This amount of volume leads me to believe we're gonna see a crazy weekend ahead of us.
On the chart, I’ve marked two potential areas of resistance. These areas are based on the round number of $40k and the all time high. Will we see a new ATH soon?
Happy trading!

LINUKSDVery bullish on link longterm from a investing perspective, also from a trading perspective market recently hit all time highs breaking above resistance with a bullish impulse, after the impulse we saw a nice correction to the 0.382 fibonacci, now we are expecting to see the continuation to the upside and market to form a new higher high from a daily perspective so another ATH. We also have bullish structure newly formed on the 4hr this setup is ready.


Ethereum Falling After Failing To Beat All Time HighIn my previous posts about Ethereum I argued that in case the ATH gets beaten, we might see a sharp increase in the price of ETH in the near future. Sadly, the first target, which was the ATH, seemed too strong to breach at this point in time. The ATH resistance held strong for a second time now.
Currently, it's looking like the price is moving down gradually towards the lower trend line of the channel. In case Bitcoin stays relatively calm, we might see another sharp bounce from ETH towards the ATH. In case we fall through the support, I don't see ETH reaching the $1450 area again anytime soon.
Happy trading!

EXPI ALL TIME HIGH EXPI All Time High.
Entry Price, Possible Entry and SL all defined.
Take profit you can decide but ideally at least after price has made a 20% move upwards.
All the best.
