Alltimehigh
NIO: Be aware of this Key Point!Hello traders and investors! Let’s see how NIO is behaving this Monday!
Well, as we expected in my last analysis (Friday), NIO defeated the $ 49.36, triggering a pivot point , and now NIO is just flying again. If you missed my previous analysis, the link to it is below, as usual.
The stock is flying, and there are absolutely no top or reversal signs ahead! NIO is doing very well!
The green line will work as a support in the future, along with the 21 ema, which is going up too. Now, NIO is about to retest the $ 54.20, which is a previous resistance (black line).
Let’s look at the daily chart for more clues:
The black line is the most important point for NIO right now , as it not only a previous resistance, but the previous All Time high (ATH), and a pivot point that could lead it to record highs.
The fight will be intense near the $ 54.20, but since the trend is bullish, the odds favor the buyers . Even if it drops a little, there are several supports around. So, there’s nothing to worry here.
As we discussed in my last analysis, the low volume during the correction seen in the past few days indicates that NIO was just resting a little, before the next explosion.
Let’s keep our eyes open here, as NIO is at a decisive moment! And follow me to keep in touch with my daily updates and support this idea if you liked it!
Thank you very much!
Have a nice day!

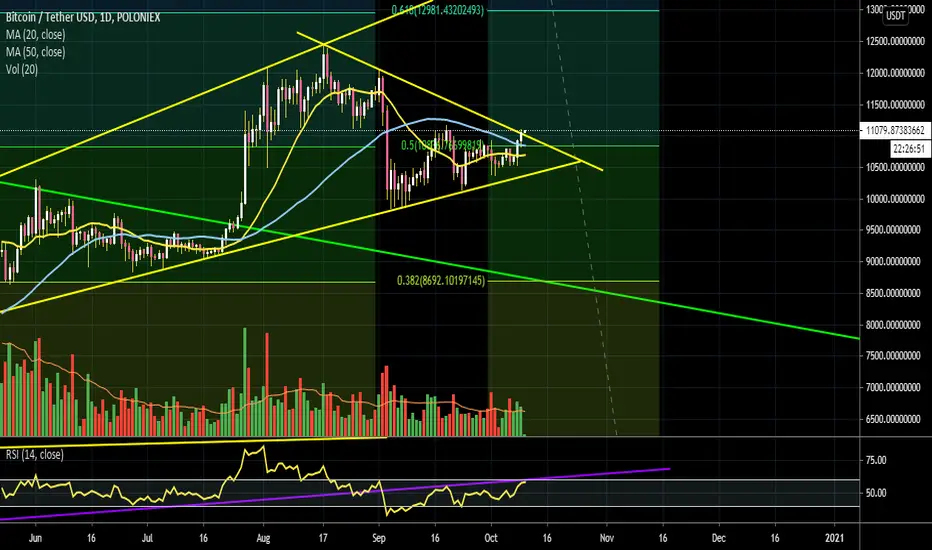
[BTC/USD] The Road To Reaching $20,000+! - By Trading-GuruHi everyone, in this detailed technical analysis I will walk you through the most important technicals on BTC/USD at the moment. Most importantly, I will discuss the parabola that has predicted the previous increase in price very nicely. Then, I will explain what things you need to take into account when the price reaches the horizontal resistance of the previous all time high.
I always try to make the chart as self-explanatory as possible, but here is a more in-depth written explanation if you want to understand the narrative better.
Parabola
Here is the order of touchpoints on this parabola that with every step gave us slightly more evidence about the incoming increase in price:
The first of the touchpoints on this parabola were from the 5th of September. We see that the price has hit a temporary low near the $10,000 mark after a big hit in the price coming from $12,000
The second touchpoint happened on October 8th. We can already see here that every time the price dips the bottom is a bit higher than it used to be. For the first time, you can start to see a bullish trend .
From the 19th of October it becomes more evident that the price is rising, the touchpoint here was enough to let the price jump into the air. BTC is officially taking off, in just two days the price increased by 10%!
Early November we see multiple interesting touchpoints. The price is still bullish but struggling. It reached around $14,000 three times in a row and it got rejected on every attempt. Then, when it hit the parabola the price jumped up again!
And finally, the last recorded touchpoint. My previous idea was published around this level and we saw that this parabola holds future value as well as historic value. It beautifully responded to the parabola support, and helped us to predict another rise in price. Technical analysis becomes way more interesting if it can predict causal relationships!
If the parabola holds we can expect the price to struggle around the $18,500 level for another 4 to 5 days. Then if it touches the parabola and it holds, we can expect the next jump in price. Will that be the jump to propel BTC above the previous resistance?
By end November this parabola predicts a price of over $20,000 for BTC! Bringing it close to the resistance of the all-time-high. The resistance itself has many ways to trade it. To decide on the exact level of the resistance I looked at the all time high. The highest level that BTC/USD ever traded on on Bitstamp was around $19660. We obviously expect resistance around this level.
Horizontal Resistance Level of the ATH
Be mindful of the consequences of this level beyond technical analysis. If the all-time high breaks, we can expect a lot of external consequences as well. For instance, more news articles will be published about the breaking of the previous all time high.
Subsequently, we can expect more attention drawn to bitcoin, increasing the demand while keeping the supply stable. This creates a second influx of demand that can be great for the price. Expect that if BTC breaks above $20,000 we will see an immediate secondary response of another easy +10% gain.
The parabola support has been very interesting recently. Perhaps we need to start considering adding an alert for it on 100eyes too. Now that you understand all the possible consequences in depth it's time to start placing your orders. Best of luck in your trading!
Follow me for consistent high-quality updates, with clear explanations and charts.
Please like this post to support me.
- Trading Guru

S&P Analysis Week of 11/21/2020: Thanksgiving WeekHow will the shortened trading week affect the markets?
It's Thanksgiving week in the U.S. and that means markets will be closed on Thursday, a shortened trading session on Wednesday and usually a light volume day on Friday. The meat of the trading week will most likely come on Monday & Tuesday. Anything can happen though so just be ready for any volatility this week.
Last week did not have much action (a lot of sideways movement) so there wasn't much of trading for me.
Price did, however, form a triangle wedge pattern. These are unpredictable in my opinion so it is better to wait for price to breakout or breakdown (with retest confirmation).
I've marked the different trade setups I will be looking for going into the trading week.
REMEMBER TO NEVER PLAY THE BREAKOUTS. Wait for the confirmation.
"When it feels really right it's probably wrong and when it feels very wrong it's probably right."
Good luck, be careful and don't forget to hit the like button.
Background: I try to keep my charts as simple as possible with focus on the major resistance and support lines which has served me well. I don't not use any indicators (moving average, volume, oscillators, etc.) or complicated methodologies (i.e. Elliot Wave Theory) which can be difficult to predict price and provides false indicators.

Just one big bull run? Only up?❕📊Everyone knows we’re approaching the ATH and this time it wasn’t just a quick hype spike up. Just a thought looking at the weekly charts, now what if that big retrace like last time doesn’t come??
Not ruling out the possibility that this may only drop down to 15-13k before ultimately climbing higher again after consolidating..
We all know bitcoin has potential but how much of it will it show this? 25k? 30k? 50k? 100k?
Every dips a nice dip at this point.
Still will be looking for a potential short when a retest is in the scenario, in the meantime bulls are shining

BITCOIN POSSIBLE REVERSALHello everyone, if you like the idea, do not forget to support with a like and follow.
on DAILY: BTCUSD is sitting around a strong resistance in blue so we will be looking for sell setups on lower timeframes.
and round number - all time high - 20k!
on M30: BTCUSD is forming a trendline in red (not valid yet) so we will be waiting for a third swing to form around it to consider it valid and sell on its break downward.
Trigger: Waiting for a momentum candle close below the gray area to sell.
NB: Until the sell is activated, this one would be overall bullish.
Good luck!

Re-Test imminent The drop since the last top has pretty much been lower time frame charts cooling off the rsi ( 1 hour, slightly 4 hour ).
With the 4 hr candles staying in range / consolidating since last nights high, i believe there is a another big push or two left to top out 4 hr on rsi. When that happens a new all time high should be established.
Could be a long or short not worth missing in these next 48 hours. Will be watching 4hr, daily, weekly charts after new ATH to see if ATH will be tested again with next weekly candle before ultimate consolidations and retracements begin.
The NationWide Crypto / Digital era is beginning with more mainstream CO’s going into bitcoin And the public become more aware as a digital lifestyle/experience begins to sweep through as the world adapts during lockdowns and pandemics.
Bear or Bull enjoy these profits

BTC IS ALREADY AT 20K USD !!What we consider as a target to reach and the razor's edge separating us from the new bull run is actually only a decontestualized number. Indeed, if we look at the market cap, the BTC market already reached the ALL TIME HIGH of Dec 2017 as new btc were mined in the meantime.

TSLA: Road to the All Time High.Hello traders and investors! Let’s see how Tesla is doing today!
Ok, so Tesla was added to the S&P 500, and this is giving fuel to the stock right now. In my previous analysis, we discussed Bullish Engulfing , which was our last entry point on Tesla. Now it is too late to buy, but we could see an opportunity here if Tesla does a pullback. And if you missed my previous analysis, the link is below, as usual.
For now, since we are trading around $ 490, I see that a pullback to the $ 462 again would be good and would offer some interesting opportunities for the late buyers. But for now, it seems Tesla is going to hit the ATH!
Now, let’s see the daily chart:
We have a Breakaway Gap here, which could be the start of a new bullish run on Tesla, and this seems to be a recurring movement, as every time Tesla does an accumulation, it triggers a new bull trend after a Breakaway Gap. We saw this movement on Oct last year, then on 1st Jun, Jul 2 and Aug 12.
Most of these movements are followed by an increase in volume , which is happening right now too. It is not the same volume seen a few months ago, but it is a start. We are very close to the ATH, and maybe it'll offer some resistnce in the short-term, but we can't count too much on that.
Now let’s see the weekly chart:
Tesla did a Pennant chart pattern here, and as crazy as it sounds, it is breaking out from it this week. The volume decreased during the movement on the Pennant, which is normal and expected, according to the Dow Theory (the volume must confirm the trend).
Now it is too late to buy, as the entry point was the Bullish Engulfing in the hourly chart, but I would wait for a pullback here, ideally around the $ 460 zone. This way you’ll increase the R/R ratio of your trade.
Either, this movement seems to be the start of a new upside movement, and Tesla will be very interesting from now on. And if you liked this analysis, please, support it ! And follow me to keep in touch with my daily updates.
Thank you very much.

PayPal Moving Towards it's All-Time-HighPayPal has recently regained momentum, bouncing off from the lowere trend line in the channel. Recent price behavious is showing higher highs and lower lows.
If macro economic sentiment stays positive, like now, we might see PayPal hitting $215 soon again. Think around 2 weeks.
Consider exiting your short term trade around there since its a major resistance, formed by two previous tops around the all-time-high.

S&P Analysis Week of 11/15/2020: New All Time Highs?Will the market make new all time highs or will it dump and start its correction leg lower?
Last week the market made NEW all time highs after pulling back. The week ended green and price spent most of the trading sessions consolidating (building energy for the next leg up or down).
This week the variables are much simpler than previous weeks. My bias is more towards the upside because on Friday we closed above a very important resistance level (3575 - the previous all time highs). This was a zone that price had trouble getting above but finally accomplished it at the end of the week.
Although my bias is to the long side, I have trade setups for both the long and short so I can take the trade the market gives me. I don't try to force trades.
My Trade Setups:
Trade 1: Get above last Monday's break down candle (~3607 with retest) and we are likely to make NEW all time highs. I know people really doubt this scenario and have been shorting the market again. Look at my rationale below.
Trade 2: Get below last week's strong support area (~3435 with retest) and we are likely heading down for the next correction leg.
Keep in mind the area I marked as NO MAN'S LAND . I would not be taking a new trade within this area.
DO NOT PLAY THE BREAKOUTS. Last week was a great example of why you don't play the breakouts. More times they either come back down for a retest of the breakout area, or they become failed breakouts. Wait for the retest and resumption in the direction of your trade.
Rationale: The reason why I have the strong resistance where I have it (~3575) is because price loves to retest the top of breakdown candles and the bottom of break up candles. Once price begins climbing the breakdown candle, the higher they go, the easier it is price will reach the top (it acts as a magnet). It is very likely this week that price will reach the top of this breakdown candle and find heavy resistance. You'll usually see price pullback some after getting to that point. It rarely breaks out on the first try.
Getting above this heavy resistance will allow price to breakaway and could form new all time highs. This is why I have that area marked as strong resistance and why you can take the trade above this (after a retest). The previous all time high might act as some resistance but by then it should be easy to break.
Good luck trading.
"When it feels really wrong, it's probably right. When it feels really right, it's probably wrong."
Please support my chart by hitting the like button. Thank you.

Not VERY far to ATHPerspective view
the 9k path to the actual price is the same path to the ATH
May be this year we will see a new ATH or Early 2021

IS BITCOIN GOING PARABOLIC?In my earlier analysis I argued that Bitcoin had a massive resistance ahead, namely the June 2019 high and the upper band of the upward channel.
It seems that the election frenzy has boosted investor's convidence to push Bitcoin towards 15k. The resistance was broken by such massive bullish force that it could signal a new parabolic move this year and push toward the all-time-high of 20k.
If the enormous buying pressure keeps persisting throughout 2020, we could see a new all-time-high soon.

Bitcoin highest monthly close ever Welcome fellow Tradingviewers,
This analyses is a follow-up from our BTC halving TA and the followup from that analyses analyses has proven to be effectious. (which will be linked in this analyses)
If you haven't already consider reading that analyses before going deeper into this one.
Since that analyses we are now on a 100 day streak above $10K and approaching new highs lets break down what the market is showing us.
In this analyses we are going to show you our view on the current market situation for Bitcoin .
We will be analysing BTC using a top-down strategy , including candlestick patterns , indicators and price patterns.
Monthly:
- This close was the HIGHEST CLOSE EVER for Bitcoin (By $20 on Finex)
- The monthly close was a bullish engulfing candle.
- Breakout immenent, with breaking ATH close price.
- We are still above all moving averages.
- Volume keeps increasing.
- Higher High seems immenent.
- Bullish MACD
Weekly:
- We closed the weekly as a bullish engulfing candle.
- We still have the strong trend from the W formation on the MACD.
- The MACD is bullish and shows strength.
- We are well above all MA's
- Volume increasing
- Forming a Higher high according to analyses one.
- We closed well above the 0.618 Fib. Level.
Daily:
- We closed the last daily candle as a bullish engulfing closing above $14K!
- Clearly closed above the 2019 high.
- The MACD is bullish.
- We are well above all MA's
- Volume increasing.
In summary:
Things are looking very Bullish for Bitcoin, the highest monthly close ever could result in heavy buying pressure from retail, smart and institutional money. We have seen crazy adoption by companies as microstrategy, paypal and square in the last couple of months. More companies will follow and with a graph like this we can only start to imagine what kind of companies/funds these are going to be. We ofcourse do not want to fall for FOMO and therefore we need to keep our vision clear. The still undicided elections are also things to take into account, this can create chaos in all markets including Bitcoin and while Bitcoin investors are mostly in GREED mode it will not be completely unreasonable to think about a pullback to squeze out the high leverage Long traders at the moment.
But for now there are very little bearish signals from our perspective, support levels are also located in the chart.
The lack of trading patterns is worriying making it difficult to set up targets on the current rise for the long term. If you disagree and see a price pattern, make sure to leave it in the comments with according targets!
We broke above the 0.618 FIB. Level which has historically been a important price for Bitcoin. The next aim from here would be the 0.786 located around $16300.
So we broke out of the downtrend and are forming the higher high that is going to move Bitcoin to higher grounds.
This analyses is only intended to share my idea, to educate and entertain you guys.
This should not be considered as financial advice.
I hope you guys enjoyed this analyses, if you did don't forget to leave a Like!
If you want to share your thoughts, please do so in the comments below!
Kind Regards,
Frank | Forallcrypto

NEW ALL TIME IN DEC,Bitcoin 8 buy on the monthly (70k+ possible)Last time we did 8 green on monthly chart we saw
First 8 buy = 6700%
Second 8 buy = 4500%
Third 8 buy = 500%? 70k or even more.

bitcoin trying to break pennant and ready to test All Time HighWelcome to this quick update.
#BTC Update: Bitcoin is at critical Resistance now and i think it almost break it but wait for confirmation.
There are two important line which intersect with each other around 11.1k which is the most important level now. Though you can see those yello boxes. BTC really fluctuates alot in this are and breakdown won't be easy IMO.
Any break below the black trendline could take BTC to $10.3k. It won't happen that quick. My 1st target is 13.3k then move to its ATH and will get invalidated only on the break of $8867 which seems highly unlikely.
Do not forget we broke almots 950 days Resistance which is very important as per TA.
So look for the long term rather than the short term. Remember those people who sold BTC around $350 and bought back at $20,000.
If you look at the daily chart for the above scenario we need a weekly close above 10890 because the 50 D MA is at that level Break and close will confirm the upside momentum.
If you like this quick update please give it a thumbs up and do follow me for more future updates.
Stay safe
IS LINK PREPARING FOR A NEW ALL-TIME-HIGH?Over the past two years LINK has been bouncing off the daily MA200 on the logarithmic chart, resulting in a rally over 7000%.
In the coming month the chances are that it will hit the MA200 again. Looking at the past, getting close to the MA200 will result in a bounce with >100% growth each time, resulting in new all-time-highs.
Will LINK bounce and ascend to new all time highs or will its crazy run-up finally come to an end?
...................................................................................................................................................................
If you like this analysis, please like, subscribe and comment.
...................................................................................................................................................................

Zooming Out on Bitcoin - $13,868 - What will happen?This monthly view shows that Bitcoin is at a pivotal price to position itself to reach the all time highs from 2017.
My projection, based on timing of previous 4 year cycle is that this could take place by March/April of 2021.
In July, we broke out of the long term down trend (see gold trend line) and have retested it and seem to be breaking out convincingly, which makes me lean in a more bullish direction for this longer term view.
Also, we are close to having the 2nd highest monthly close in the history of Bitcoin.
There are 3 paths that I see Bitcoin possibly choosing, the first 2 seem more likely based on current news and what I see happening in the crypto space in general.
1) We see continuation, breaking past this $13,868 resistance within the next month, and start heading towards the all time high.
2) We form a Cup & Handle, which would delay things by a month or 2 before we retest the $13,868 resistance again.
Least Likely scenario, in my opinion:
3) We break down from here, unable to retest $13,868 resistance and move into a month long equilibrium that would need to find a higher low somewhere above $3,858.
A big stock market drop or a significant reaction to negative Covid news would be the most likely cause of such a move, and it would probably have a significant impact on the timeline of reaching the previous all time high.
Thanks for taking a look. I'm curious if you have similar expectations or if you have a more bearish view.

Looking for that 9 buy in december.8th in november (semi allin)
9th (1 december) all inn + long with 5x leverage.
free money, vecation in januar?;)

NICE with nice pattern and chance to move up if 240$ break volume, ma, ema, pattern is all bullish.
nice part of cloud stocks - sector that very strong in these days

Gold breakout loomingGold playing out true to form following all trends bang on. Moving averages are all tightening, breakout in the next 7 days is imminent.
Resistance @ $2,075
Support @ $1,818

Amazing Week For SPX, Big October Coming 3800+SPX - Three weeks to go to election. Pretty amazing price action this week. After a scary push down on Tuesday. Wednesday, Thursday and Friday did nothing but go up the rest of the week.
SPX is due for some consolidation but all indication is SPX is going to have a big October including a test of all time highs and beyond.
3425 is a key level to hold on any pullbacks. If SPX can get over 3486 it opens up 3528 and 3579 above. 3486 is the final key resistance before 3600+.
Below 3425 is 3411 and 3389. If SPX loses 3425 look for longer term consolidation or sideways range bound action into the election.
SPX was stronger than NAS. It reached it's key resistance level at 3486, NAS is still under this level. BOTH NAS and SPX will have to clear their key resistance levels to test all time highs.
Avoid the noise of why the market is going up or why it can't go higher. Let go of your own biases. The price action is telling us it is going to test all time highs. If this changes we will change with it but don't let bias or fear hold you back from the opportunity that is currently being presented.

S&P500 New ATH and a Correction for Christmas!? Will we see it play like this, conveniently right up the middle parallel channel of the big trend?
Will we see new all time highs as soon as early November?
With a nice Christmas correction like we're all used to by now?
Lets do it!!!!
#NASDAQ35000hat #S&P500hat
