ALPACAUSDT HourlyTechnical AnalysisALPACAUSDT HourlyTechnical Analysis
Alpaca Finance Coin indicators are POSITIVE.
The coin saw a strong upward movement following the news of its delisting from Binance. High returns continue in this cryptocurrency. Alpaca Coin, which experiences periodic price surges, is currently priced near its 21-day moving average. Due to low liquidity, it exhibits sharp price movements, making it a favorite among short-term traders.
While it appears calm at the moment, we believe Alpaca Finance may resume its upward trend over time.
If it breaks above the 21-day moving average, the 0.254 resistance level will be the next target.
In the case of sharp sell-offs, the 0.160 support level will be monitored.
Based on 2-week price movements, Alpaca has shown returns of 558% - 285% - 93% - 110% - 106% - 61% at various points.
This is a high-risk cryptocurrency. This is not investment advice.
Resistances: 0.254 - 0.260 - 0.268 - 0.279 - 0.306 - 0.314 - 0.345 - 0.372 - 0.410
Supports: 0.220 - 0.205 - 0.160
THIS IS NOT INVESTMENT ADVICE.
The information, comments, and suggestions here do not constitute investment advisory services. Investment advisory services are provided under a formal agreement between clients and licensed institutions such as brokerage firms, portfolio management companies, and non-deposit banks.
The content on this page reflects only personal opinions. These opinions may not be suitable for your financial situation or your risk and return preferences. Therefore, investment decisions should not be made solely based on the information and commentary provided on this page.
We’d appreciate it if you follow and like us so you don’t miss our analyses with positive or risky technical indicators.
ALPACAUSDT

$SUPRA Breakout Alert$SUPRA Breakout Alert
After months in a descending channel, SUPRA has broken out with strong volume.
Price flipped resistance into support and now targets the 0.01805 USDT level, a potential +174% move from the breakout point.
Eyes on 0.01805 📈 DYRO, NFA

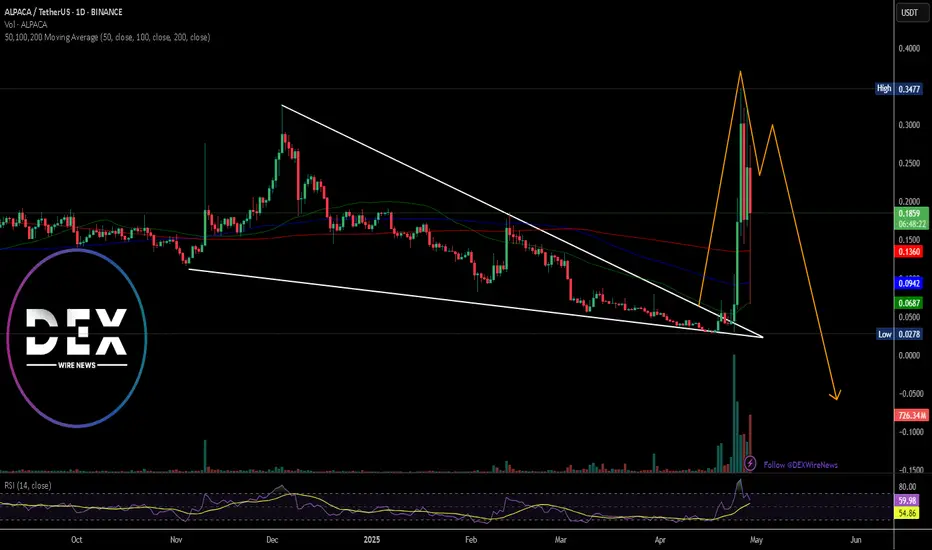
Alpaca Finance Bullish Cycle Not Over: New ATH $6.99 (PP: 3395%)Alpaca Finance (ALPACAUSDT) already grew a nice 4,367% in April 2025. The market bottom was hit 17-April and really high volume came a day before. Then more volume and strong growth started to happen on a daily basis. Total growth from bottom to the 30-April peak amounts to the number listed above, but it is likely this isn't the end.
This wave of bullish action was just a recovery from a break of a long-term consolidation channel structure. After this wave of growth, the action is "back to baseline." Alpaca Finance is now back to zero based on TA.
You can see clearly the sideways channel on the chart as well as the two rounded bottom pattern.
You can find a new All-Time High projection sitting at $6.99 with a massive 3,395% potential but wait, more targets are also available. There is one at $2.74 for 1,270% and two other targets with one that sits within the previous wick high.
These long wicks tend to remove resistance, and this becomes a bullish situation. All the sell orders that were present all the way to $1.28 were filled when the late April wick high showed up. Now, after some consolidation, the market can resume with additional growth.
In this case you can use a stop-loss, the 11-September 2023 low.
This pair should not be traded by beginners. Beginners should focus on the charts with a bottom entry and price, the ones that I share daily. This is for advanced traders only.
Thanks a lot for your support.
Namaste.

VIDT - UpdateVIDT is approaching the edge of its current trading channel. Caution is warranted, as a pullback to the first support level at $0.0009 remains a possibility. The next support level is less encouraging and would signal further weakness.
VIDT has struggled post-delisting, unlike projects such as ALPACA, VOXEL, and ARGO, which experienced a resurgence. At this point, VIDT is showing little sign of recovery and may even be considered a dormant or "dead" coin. ATM it is very indecisive.
That said, if buying interest returns, a move toward the $0.003–$0.006 range is feasible — a modest recovery that would place the market cap between $3M and $6M, still far below the FWB:30M cap it held before the major sell-off.

ALPACA - Does it posses superpower?The move of alpaca where the whole fall trend is moved by a flag which aint a flag offc would be like this as mentioned on top.

Breaking: $ALPACA Gets Delisted On Binance Tanking 33% Today The price of Alpaca saw a notable dip of 33% Today, albeit the crypto market is in a bullish campaign, news from Binance delisting the altcoin was primarily the factor behind the price plunge.
About Alpaca Finance
Alpaca Finance is the largest lending protocol allowing leveraged yield farming on Binance Smart Chain. It helps lenders earn safe and stable yields, and offers borrowers undercollateralized loans for leveraged yield farming positions, vastly multiplying their farming principals and resulting profits.
Technical Outlook
As of the time of writing, $ALPACA is down 23% trading within a descending triangle formation. However, despite the price plunge the RSI is still holding strong at 59 this might resort to a bullish reversal in the long term as sellers are being filtered by the sell-off.
Alpaca Finance Price Data
The Alpaca Finance price today is $0.174775 USD with a 24-hour trading volume of $381,859,379 USD. Alpaca Finance is down 32.80% in the last 24 hours. The current CoinMarketCap ranking is #734, with a market cap of $26,297,347 USD. It has a circulating supply of 150,464,194 ALPACA coins and a max. supply of 188,000,000 ALPACA coins.
ALPACA has reached the end of its trend (4H)Given the sharp and rapid bullish move and a 638% rally without any time correction, along with reaching a supply zone, we expect a price rejection from the red box area toward the green zone.
Tokens like this, when they pump this hard and reach major supply zones, often present short opportunities. However, one should not ignore the high funding rate on such tokens, as most traders are in short positions, which significantly raises the funding rate. Therefore, make sure to evaluate all conditions and risks before entering any position.
A daily candle close above the invalidation level would invalidate this outlook.
For risk management, please don't forget stop loss and capital management
When we reach the first target, save some profit and then change the stop to entry
Comment if you have any questions
Thank You

ALPACAUSDT – Looks Weak, But Patience is Key! ALPACAUSDT 🐻
“No need to rush—the blue box is the ideal short entry!”
🔥 Key Insights:
✅ ALPACA is Showing Weakness – Momentum is fading.
✅ Blue Box = Best Short Entry – No chasing, wait for confirmation.
✅ LTF Breakdown Needed – CDV + Volume Profile must align.
💡 The Smart Plan:
Wait for the Blue Box – Let price come to us.
Watch 15M & 1H for Down Breakouts – Smart money will signal the move.
No Confirmation, No Trade – We only take high-probability setups.
“Discipline = Profits—let’s trap liquidity before taking the trade!” 📉🔥
A tiny part of my runners:
🎯 ZENUSDT.P: Patience & Profitability | %230 Reaction from the Sniper Entry
🐶 DOGEUSDT.P: Next Move
🎨 RENDERUSDT.P: Opportunity of the Month
💎 ETHUSDT.P: Where to Retrace
🟢 BNBUSDT.P: Potential Surge
📊 BTC Dominance: Reaction Zone
🌊 WAVESUSDT.P: Demand Zone Potential
🟣 UNIUSDT.P: Long-Term Trade
🔵 XRPUSDT.P: Entry Zones
🔗 LINKUSDT.P: Follow The River
📈 BTCUSDT.P: Two Key Demand Zones
🟩 POLUSDT: Bullish Momentum
🌟 PENDLEUSDT.P: Where Opportunity Meets Precision
🔥 BTCUSDT.P: Liquidation of Highly Leveraged Longs
🌊 SOLUSDT.P: SOL's Dip - Your Opportunity
🐸 1000PEPEUSDT.P: Prime Bounce Zone Unlocked
🚀 ETHUSDT.P: Set to Explode - Don't Miss This Game Changer
🤖 IQUSDT: Smart Plan
⚡️ PONDUSDT: A Trade Not Taken Is Better Than a Losing One
💼 STMXUSDT: 2 Buying Areas
🐢 TURBOUSDT: Buy Zones and Buyer Presence
🌍 ICPUSDT.P: Massive Upside Potential | Check the Trade Update For Seeing Results
🟠 IDEXUSDT: Spot Buy Area | %26 Profit if You Trade with MSB
📌 USUALUSDT: Buyers Are Active + %70 Profit in Total
🌟 FORTHUSDT: Sniper Entry +%26 Reaction
🐳 QKCUSDT: Sniper Entry +%57 Reaction
📊 BTC.D: Retest of Key Area Highly Likely
I stopped adding to the list because it's kinda tiring to add 5-10 charts in every move but you can check my profile and see that it goes on..

Good moment for Buy ALPACAGood moment for Buy ALPACAUSDT. We are have "long time" to collect the sizes and first step of move up is ready. We again collect sizes and next step is good move up action. Good risk reward ratio. Will see...

HOOKUSDT UPDATEHOOKUSDT is a cryptocurrency trading at $0.2285. Its target price is $0.4000, indicating a potential 120%+ gain. The pattern is a Bullish Falling Wedge, a reversal pattern signaling a trend change. This pattern suggests the downward trend may be ending. A breakout from the wedge could lead to a strong upward move. The Bullish Falling Wedge is a positive signal, indicating a potential price surge. Investors are optimistic about HOOKUSDT's future performance.

Alpaca 8% profit.AlpacaUsdt was shared yesterday and today it filled our marked entry zone and running in decent profit of 9%.
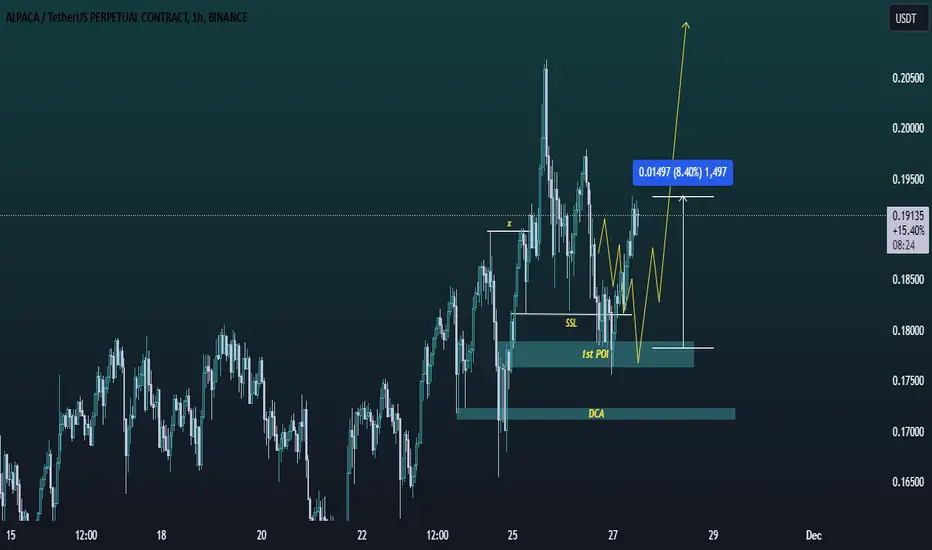
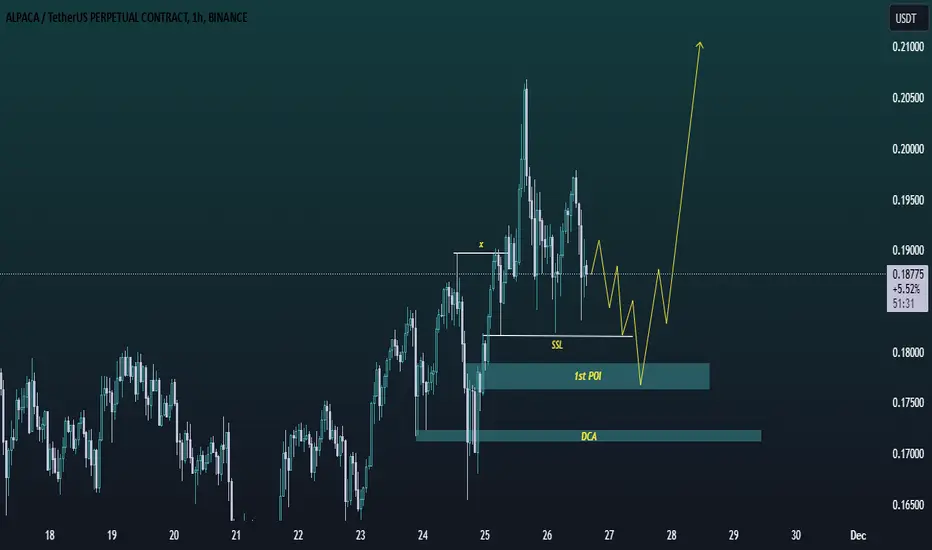
ALPACA/USDT TRADE IDEAALPACA/USDT Poi marked on the chart which is below SSL and DCA marked. Chart says everything, nothing to explain here.
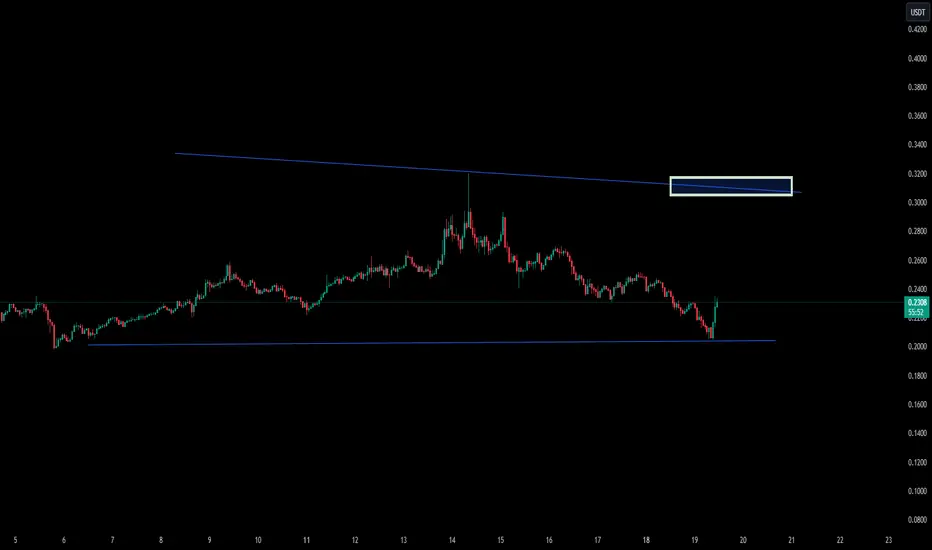
ALPACAUSDT(AlpacaFinance) Updated till 22-08-24ALPACAUSDT(AlpacaFinance) Daily timeframe range. we can see huge retrace from price discovery level. still lots of space to cover. its trying to get a close over 0.2085, a valid close over that will give it another chance to push. recent support at 0.1566.

ALPACA NEW INCREASE VOLUMEALPACA shows a new increase in volume, which could be confirmed in the coming time frames.
We will follow the coin to see if it's able to confirm.
The reason for the volume is the trend data that this coin shows.
This coin is at basic choice on daily trends.
$ALPACA time will comeSome of the Defi coins are moving like crazy, if the green support holds, ALPACA pump will be huge. Targets are on the chart.

ALPACAUSDT.4HBased on the market data provided, the ALPACA coin is currently trading at $0.1918 against USDT. The 4-hour chart shows a relative strength index (RSI) of 56.89, which suggests that the coin is neither overbought nor oversold. The Moving Average Convergence Divergence (MACD) for the same time frame is 0.0039, indicating a bullish trend. The Bollinger Bands (BB) for the 4-hour chart are at 0.0038, which suggests low volatility.
Looking at the daily chart, the RSI is at 56.03, which also suggests the coin is neither overbought nor oversold. The MACD for the daily chart is 0.003, which indicates a bullish trend. The BB for the daily chart is at 0.2138, which shows low volatility.
The weekly chart shows an RSI of 53.97, which is also in the neutral zone. The MACD for the weekly chart is 0.0018, which indicates a bullish trend. The BB for the weekly chart is at 0.2136, which shows low volatility.
The coin has support levels at $0.1861, $0.1718, and $0.1612 for the 4-hour chart; $0.1897, $0.1708, and $0.1548 for the daily chart; and $0.1711, $0.1461, and $0.1246 for the weekly chart. The resistance levels are at $0.2035, $0.2115, and $0.2295 for the 4-hour chart; $0.2122, $0.2341, and $0.2650 for the daily chart; and $0.2439, $0.2730, and $0.3566 for the weekly chart.
In conclusion, the ALPACA coin is currently in a bullish trend across all three time frames (4-hour, daily, and weekly). However, the volatility is low as indicated by the Bollinger Bands. The coin is also trading in the neutral zone as suggested by the RSI. Therefore, investors should monitor the market closely for any potential breakout from the current trend.

Alpaca Finance (ALPACA) forming Shark for upto 45.50% pumpHi dear members , hope you are well and welcome to the new trade setup of Alpaca Finance (ALPACA) with US Dollar pair.
Recently we caught almost 48% pump of ALPACA as below:
Now on a 4-hr time frame, ALPACA is about to complete a bullish Shark move for the next price reversal.
Note: Above idea is for educational purpose only. It is advised to diversify and strictly follow the stop loss, and don't get stuck with trade.

ALPACA: Riding Bullish Waves Amid InnovationsAlpaca Finance's native token, ALPACA, has been showcasing a bullish momentum, recently reaching a high of $0.1843, and currently trading at $0.1697. This positive price action, including a significant surge of 32.83% earlier, reflects growing investor confidence bolstered by a very bullish sentiment from InvestorsObserver. Known as the largest lending protocol enabling leveraged yield farming on Binance Smart Chain, Alpaca Finance has been actively evolving. The recent deployment of its 2.0 version generated approximately 23K in interest from its Money Market in September 2023, indicating a robust development trajectory.
Moreover, the announcement of the Perpetual Futures Exchange, aimed at launching on March 9, 2023, underscores Alpaca's innovative approach in diversifying financial solutions within the DeFi space. This platform is designed to offer users an avenue for higher profitability in a robust and user-friendly trading environment.
On the technical front, while ALPACA is trading below its 200-day Simple Moving Average—a traditionally bearish sign—it has been exhibiting a buy signal for the past 326 days. The proximity to the 50-day Simple Moving Average hints at a potential bullish reversal if the upward momentum continues.
Most Probable Scenario:
The ongoing bullish sentiment, coupled with innovative strides, paints a promising picture for ALPACA. However, resistance around the $0.18 mark, as seen in the recent high, might pose a hurdle. The support level around $0.13 serves as a cushion against adverse price movements. The unfolding market conditions, along with Alpaca Finance's upcoming product launches, could potentially drive a further bullish narrative, warranting close monitoring by traders and investors.

Alpaca Finance (ALPACA) formed bullish Gartley for upto 13% pumpHi dear friends, hope you are well and welcome to the new trade setup of Conflux Network (CFX) token with BTC pair.
Previously we caught more than 22% pump of CFX as below:
Now On a daily time frame, CFX has formed a bullish Gartley move for another price reversal.
Note: Above idea is for educational purpose only. It is advised to diversify and strictly follow the stop loss, and don't get stuck with trade

ALPACA/USDT#ALPACAUSDT
MACD is showing bullish
EMAs is neutral
RSI is bullish
There a double buttom in daily chart pattern that's give us signal for upward move and we have two good supports
targets set at the chart

ALPACAUSDT Formed Symmetric Triangle Pattern!ALPACAUSDT Technical analysis update
Buy zone: Below $0.32
Stop loss : $0.29
Take Profit 1 : $0.35
Take Profit 2 : $0.40
Take Profit 3 : $0.465
Take Profit 4 : $0.53
Spot trade.
Always keep stop loss
Thanks
Hexa

Alpaca Finance (ALPACA) forming a Gartley for another pump soonHi dear friends, hope you are well and welcome to the new trade setup of Alpaca Finance (ALPACA) token.
Our last successful trade of ALPACA was as below:
Now on a 4-hr time frame, ALPACA is about to complete the final leg of a bullish Gartley pattern for another pump soon.
Note: Above idea is for educational purpose only. It is advised to diversify and strictly follow the stop loss, and don't get stuck with trade

ALPACAUSDTHello Crypto Lovers,
Mars Signals team wishes you high profits.
This is a 4-hour-time frame analysis for ALPACAUSDT
We see R1 that used to be a support area. And S1 and S2 are the support areas at the bottom of our chart in which the well support of price is clear. At the moment, we have the fluctuation of price at S1 and we expect a rising or a falling trend to happen in the coming days. If the price provides some rising signs, surely an increase is expected for it to reach R1 or higher. But in case we have some falling signs, it means that the price won’t be supported and a fall to lower amounts is possible then. Bear in mind that it is better to activate your stop-loss points due to the unstable situation of market.
Warning: This is just a suggestion and we do not guarantee profits. We advise you to analyze the chart before opening any positions.
Wish you luck
