Alphabet (GOOGL) extends its rally on upbeat 2Q earnings
US equities continue to post record highs, driven by stronger-than-expected 2Q earnings and optimism over ongoing trade agreements. Alphabet’s (GOOGL) Q2 results reaffirmed the accelerating pace of AI-led growth. The company’s cloud revenue surged 32% YoY, up from 28% in 1Q, and it raised its full-year capex guidance from $75B to $85B.
Alphabet (GOOGL) remains firm within its ascending channel. The price solidly holds above both EMAs, indicating the potential extension of bullish momentum. If Alphabet (GOOGL) holds above EMA21, the price may gain upside traction toward the previous high at 198.00. Conversely, if Alphabet (GOOGL) breaks below the support at 189.50, the price could retreat to the next support at 184.30.
Alphabet

GOOGL Alphabet Options Ahead of EarningsIf you haven`t bought GOOGL before the rally:
Now analyzing the options chain and the chart patterns of GOOGL Alphabet prior to the earnings report this week,
I would consider purchasing the 215usd strike price Calls with
an expiration date of 2026-1-16,
for a premium of approximately $8.20.
If these options prove to be profitable prior to the earnings release, I would sell at least half of them.
Disclosure: I am part of Trade Nation's Influencer program and receive a monthly fee for using their TradingView charts in my analysis.

Alphabet - The textbook break and retest!📧Alphabet ( NASDAQ:GOOGL ) will head much higher:
🔎Analysis summary:
If we look at the chart of Alphabet we can basically only see green lines. And despite the recent correction of about -30%, Alphabet remains in a very bullish market. Looking at the recent all time high break and retest, there is a chance that we will see new all time highs soon.
📝Levels to watch:
$200
🙏🏻#LONGTERMVISION
Philip - Swing Trader

GOOGL Raid Plan: Bulls Set to Hijack the Chart!💎🚨**Operation GOOGL Grab: Robbery in Progress! Swing & Run!**🚨💎
🌟Hi! Hola! Ola! Bonjour! Hallo! Marhaba!🌟
Dear Money Makers & Silent Robbers, 🤑💰💸✈️
Get ready for another high-stakes market heist – this time, we’re raiding the vaults of GOOGL (Alphabet Inc.) using the Thief Trading Strategy™. Based on sharp technical intel and subtle fundamental whispers, the setup is clear: the bulls have cracked the code, and it’s time to grab our loot.
🟢 🎯 ENTRY POINT - THE LOOT ZONE
"The vault is wide open!"
Snatch your bullish entry anywhere on the chart, but the pros will place limit buys on recent pullbacks (15m/30m zones), either on swing lows or highs. The pullback is your door in — don’t miss it!
🛑 STOP LOSS - ESCAPE ROUTE
Set the Thief SL at the recent 2H swing low (162.00).
But remember, each robber’s risk appetite is unique — adjust your SL based on your size, cash, and courage.
🎯 TARGET - GETAWAY MONEY
💼 Main Target: 186.50
Or if heat rises early, vanish with your gains before the full score hits. Disappear like a ghost — profit first, questions later!
🧲 FOR SCALPERS – THE QUICK GRAB
Only ride the long wave — shorting is off-limits in this mission.
If your wallet is loaded, dive in. If not, join the swing crew.
Use trailing SL to protect your cash stack 💰.
📈 THE SETUP – WHY THIS RAID WORKS
The GOOGL Market is bursting with bullish energy — a classic Red Zone robbery moment.
Overbought tension, fakeouts, trend shifts — exactly where we love to strike! Consolidation and reversals = opportunity for the brave.
📣 TRADING ALERT - NEWS AHEAD!
🚨 Avoid entries during news releases – they trigger alarms!
Use trailing SL to lock in your stash, especially during high-volatility windows.
🔍 TIPS FROM THE THIEF’S DESK
Stay updated with the latest whispers — from fundamentals to geopolitical noise, COT positioning to sentiment swings. The market changes faster than a thief on the run — so adapt fast!
💖 Show some love: 💥Hit that Boost Button💥
Let’s fuel this robbery plan with more power and precision.
Every day in the market is a new heist — let’s win like thieves, not sheep. 🏆💪🤝❤️🚀
I'll be back soon with another masterplan...
📡 Stay sharp, stay hidden — and always aim for the vault. 🤑🐱👤🎯

Google: Upcoming TopWe locate Google in turquoise wave 2 (of a downward impulse). In more detail, we see the stock developing a complex - - - pattern and expect turquoise wave 2 to conclude imminently with wave . All the while, the price should maintain a safe distance from resistance at $209.28. Looking ahead to turquoise wave 3, we anticipate sell-offs down into our magenta Target Zone between $123.92 and $98, before wave 4 likely triggers a temporary rebound up to the $138.35 level. Ultimately, the entire turquoise downward impulse should bottom out again in the magenta zone, which would also mark the completion of waves (C) in magenta and in green. Since a new larger upward phase should begin afterward, the magenta zone presents an opportunity to establish long positions. However, if Google were to break above the $209.28 resistance next, we would have to expect a new high for magenta wave alt.(B) —which would only temporarily postpone the anticipated sell-off though (probability: 24%).
📈 Over 190 precise analyses, clear entry points, and defined Target Zones - that's what we do.

#ALPHA /USDT breakdown alert#ALPHA
The price is moving within a descending channel on the 1-hour frame and is expected to break and continue upward.
We have a trend to stabilize above the 100 moving average once again.
We have a downtrend on the RSI indicator that supports the upward break.
We have a support area at the lower limit of the channel at 0.01111, acting as strong support from which the price can rebound.
Entry price: 0.01156.
First target: 0.01288.
Second target: 0.01400.
Third target: 0.01512.
To manage risk, don't forget stop loss and capital management.
When you reach the first target, save some profits and then change the stop order to an entry order.
For inquiries, please comment.
Thank you.

Google (Alphabet): Overarching Downside PotentialAlphabet (GOOGL) hasn’t been able to reclaim its May 22 high and has settled into a consolidation range around the $170 level. Still, under our primary scenario, we expect the current corrective upswing to continue for a bit before turquoise wave 3 resumes the downtrend. That move should break below $138.35 and carry the price into the magenta Target Zone between $123.92 and $98. After that, a rebound within wave 4 is likely, though it probably won’t be strong enough to retake the $138.35 level. A final leg down in wave 5 should then complete the correction, driving the price deeper into the zone and establishing the low of green wave . This area also marks a potential turning point for the next major move upward. Meanwhile, a detour above resistance at $209.28 for a new high of magenta wave alt.(B) is 24% likely.
📈 Over 190 precise analyses, clear entry points, and defined Target Zones - that's what we do.

GOOGLE Repeating 2024 pattern and eyes $197.00Alphabet Inc. (GOOG) has established a Channel Up pattern since the (near) 1W MA200 (orange trend-line) rebound. With the 1D MA50 (blue trend-line) now acting as a Support, this pattern resembles the Channel Up formations that emerged in 2024.
Both in terms of 1W RSI and pure price action alike, we are in a similar consolidation level as November and April 2024. Both patterns peaked after similar rallies (+40.60% and +46.23% respectively), so the minimum Target we are expecting on the medium-term is $197.00.
-------------------------------------------------------------------------------
** Please LIKE 👍, FOLLOW ✅, SHARE 🙌 and COMMENT ✍ if you enjoy this idea! Also share your ideas and charts in the comments section below! This is best way to keep it relevant, support us, keep the content here free and allow the idea to reach as many people as possible. **
-------------------------------------------------------------------------------
💸💸💸💸💸💸
👇 👇 👇 👇 👇 👇

Alphabet Stock Maintains a Consistent Upward ChannelOver the past five trading sessions, Alphabet's (Google) stock has managed to sustain a moderate bullish bias, with a gain of over 4%, as the price has settled around the $170 level. So far, the stock has avoided significant pullbacks amid recent announcements of new integrations and advancements in artificial intelligence within the Google ecosystem.
On one hand, the company announced the integration of AI into its search engine, powered by its Gemini model, along with the introduction of a new “Agent Mode”—a feature that allows users to delegate complex tasks for the AI to handle autonomously. These announcements have been well received by the market, as they reinforce Alphabet’s commitment to innovation and maintaining a strong user base. If these new projects generate solid value, they could be crucial in sustaining buying pressure on the stock.
Bullish Channel Remains Intact
Since April 7, a consistent ascending channel has been forming in the stock’s price action. So far, recent bearish corrections have been insufficient to reverse the overall short-term trend. As long as the stock stays above the $170 level, the bullish bias is likely to remain intact, potentially extending the duration of the current upward structure.
ADX
The ADX line has shown a notable decline, approaching the neutral 20 level. This suggests that recent price movements are losing directional strength, possibly due to the price facing a nearby resistance zone.
RSI
The RSI remains above the neutral 50 level, indicating that buying momentum still dominates in the short term.
Key Levels:
$170: Current barrier, coinciding with a zone of indecision observed over the past several weeks. Sustained bullish moves above this level could reinforce buying sentiment and strengthen the current upward channel.
$175: Distant resistance aligned with the 100- and 200-period moving averages. A breakout above this area could lead to a steeper and stronger short-term uptrend.
$160: Nearby support, marking the lower boundary of the ascending channel. A break below this level could jeopardize the existing bullish formation.
Written by Julian Pineda, CFA – Market Analyst

Google is about to rise by atleast 10% in coming days!I expect Google share price to rise by atleast 10% within the next 2 weeks.
Reasons;
Monthly is massively bullish.
Weekly is also bullish.
Daily is also bullish.

ALPHAUSDT | Sellers in Control—Key Resistance Levels DefinedALPHAUSDT shows a brief uptick, but the underlying strength remains with sellers. Buyers have yet to demonstrate sustained conviction, and this suggests any rally may be engineered rather than genuine.
🔴 Manipulation Target: Red Line
A slight advance today appears aimed at the area marked by the red line, where liquidity may be swept before a reversal. This level serves as a likely pivot for engineered moves designed to trap uninformed participants.
🔴 Core Resistance: Red Box
Beyond the red line, the red box identifies the primary seller domain. Price has stalled here repeatedly, confirming that sellers guard this zone aggressively. Until ALPHAUSDT clears the red box on substantial volume and with clear low‑time‑frame breakouts, the bearish bias remains intact.
📉 How to Trade This Setup
Short Entries
• Look for price to approach the red line and fail to hold—this often precedes a stronger reversal into the red box.
• Confirm with a clean breakdown on lower time frames and a negative divergence in CDV to validate seller dominance.
Risk Management
• Place stops just above the red box or red line, depending on your preferred trigger, to cap potential losses.
Stay Patient
• If price unexpectedly breaks above these levels with convincing volume and retests as support, only then will I reconsider the bearish view.
By focusing on where genuine selling pressure resides, and waiting for real confirmations, you avoid getting caught in manipulative spikes and trade with confidence.
📌I keep my charts clean and simple because I believe clarity leads to better decisions.
📌My approach is built on years of experience and a solid track record. I don’t claim to know it all but I’m confident in my ability to spot high-probability setups.
📌If you would like to learn how to use the heatmap, cumulative volume delta and volume footprint techniques that I use below to determine very accurate demand regions, you can send me a private message. I help anyone who wants it completely free of charge.
🔑I have a long list of my proven technique below:
🎯 ZENUSDT.P: Patience & Profitability | %230 Reaction from the Sniper Entry
🐶 DOGEUSDT.P: Next Move
🎨 RENDERUSDT.P: Opportunity of the Month
💎 ETHUSDT.P: Where to Retrace
🟢 BNBUSDT.P: Potential Surge
📊 BTC Dominance: Reaction Zone
🌊 WAVESUSDT.P: Demand Zone Potential
🟣 UNIUSDT.P: Long-Term Trade
🔵 XRPUSDT.P: Entry Zones
🔗 LINKUSDT.P: Follow The River
📈 BTCUSDT.P: Two Key Demand Zones
🟩 POLUSDT: Bullish Momentum
🌟 PENDLEUSDT.P: Where Opportunity Meets Precision
🔥 BTCUSDT.P: Liquidation of Highly Leveraged Longs
🌊 SOLUSDT.P: SOL's Dip - Your Opportunity
🐸 1000PEPEUSDT.P: Prime Bounce Zone Unlocked
🚀 ETHUSDT.P: Set to Explode - Don't Miss This Game Changer
🤖 IQUSDT: Smart Plan
⚡️ PONDUSDT: A Trade Not Taken Is Better Than a Losing One
💼 STMXUSDT: 2 Buying Areas
🐢 TURBOUSDT: Buy Zones and Buyer Presence
🌍 ICPUSDT.P: Massive Upside Potential | Check the Trade Update For Seeing Results
🟠 IDEXUSDT: Spot Buy Area | %26 Profit if You Trade with MSB
📌 USUALUSDT: Buyers Are Active + %70 Profit in Total
🌟 FORTHUSDT: Sniper Entry +%26 Reaction
🐳 QKCUSDT: Sniper Entry +%57 Reaction
📊 BTC.D: Retest of Key Area Highly Likely
📊 XNOUSDT %80 Reaction with a Simple Blue Box!
📊 BELUSDT Amazing %120 Reaction!
📊 Simple Red Box, Extraordinary Results
I stopped adding to the list because it's kinda tiring to add 5-10 charts in every move but you can check my profile and see that it goes on..

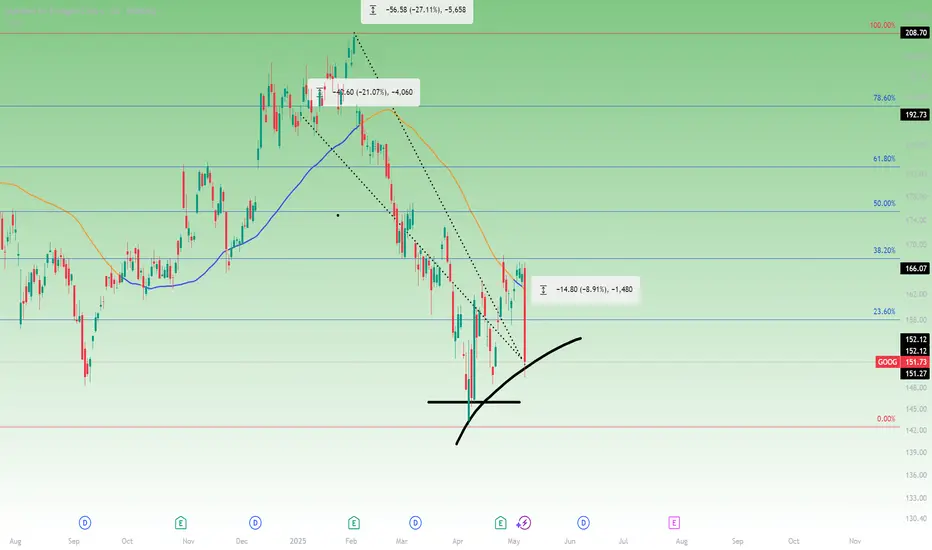
Google in trouble with Apple AI? Watch $146 next?Apple has confirmed it is actively exploring a redesigned web browser across iPhone, iPad, and Mac with a focus on AI-powered search. The potential shift away from Google as the default search provider on iOS devices, poses a direct risk to Alphabet’s search business.
Alphabet shares fell $14.11 (-8.54%) to $151.09 USD on the news, breaking below the 50-day moving average at $162.00 and the 23.6% Fibonacci retracement from the February high and April low, after finding resistance at the 38.2%.
From its February high, Alphabet is now down 27.1%, with a year-to-date loss of 21.1%.
While the stock remains above its 2025 low of $140.53, downside levels to monitor include ~$145.90.
Google stock oscillates below $170 after earnings releaseGoogle's stock managed to post a bullish gap of more than 3% in the last session, shortly after the company announced its quarterly results. Initially, it was reported that total sales for the last published quarter reached $90.23 billion, compared to the expected $89.12 billion. In addition, the company posted earnings per share of $2.81, beating expectations of $2.00. This positive outcome initially triggered a spike in investor confidence, but for now, the market sentiment has stabilized, and the stock is closing the week with a bearish candlestick on the chart.
Previous trendline break:
The recent consistent bullish movements in Google have been important in breaking a downward trendline that was previously dominant on the chart. For now, this has paved the way for a new bullish bias, and a new upward trendline could be forming, potentially becoming the most relevant technical structure for the stock in the coming sessions. However, it is important to note that this early bullish trendline still requires new price highs to confirm its strength.
ADX:
Although ADX oscillations remain above the neutral 20 level, the slope of the line has started to turn negative. This suggests that, despite the positive earnings, volatility may be beginning to decline, which could eventually lead to a sideways bias in the stock’s movements in the short term.
MACD:
The MACD histogram continues to show oscillations above the neutral 0 line, but it is becoming increasingly necessary for this to be sustained to confirm the buying strength reflected in the moving averages. If the MACD starts to decline, it could be interpreted as a bearish correction signal that may weigh on Google's price.
Key Levels:
$175: A relevant resistance aligned with the 100- and 200-period moving averages. Buying oscillations reaching this level could reactivate bullish momentum and give way to a new relevant uptrend.
$160: A nearby support zone aligned with the 23.6% Fibonacci retracement level. It could serve as a tentative barrier where potential short-term downside corrections might occur.
$143: A definitive support that coincides with the recent lows of the stock. A pullback toward this level could reactivate the previous bearish trend in this market.
Written by Julian Pineda, CFA – Market Analyst

GOOG Alphabet Options Ahead of EarningsIf you haven`t bought GOOG before the previous rally:
Now analyzing the options chain and the chart patterns of GOOG Alphabet prior to the earnings report this week,
I would consider purchasing the 170usd strike price Calls with
an expiration date of 2025-7-18,
for a premium of approximately $4.35.
If these options prove to be profitable prior to the earnings release, I would sell at least half of them.

Google - Fantastic Bullish Break And Retest!Google ( NASDAQ:GOOGL ) just looks amazing:
Click chart above to see the detailed analysis👆🏻
For more than a decade, Google has been trading in a rising channel formation, perfectly respecting all market structure. Now, Google is about to retest the previous all time high once again and with a sharp correction of about -25%, this offers a significant bullish reversal setup.
Levels to watch: $150
Keep your long term vision,
Philip (BasicTrading)

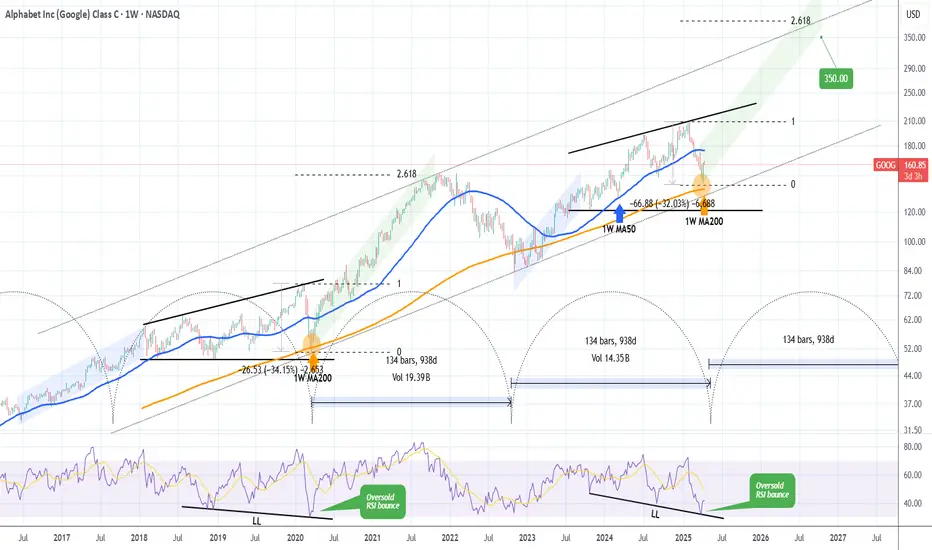
GOOGLE's generational bottom made. This is how it reaches $350.Alphabet Inc. (GOOG) almost tested last week its 1W MA200 (orange trend-line). That level has been holding for more than 2 years (since March 13 2023) and it's been the main Support of the Bull Cycle that followed the November 2022 Inflation Crisis bottom.
The pattern is almost like the Ascending Triangle that led to the March 2020 COVID crash, which was the most recent time before the late 2022 bottom that the stock made contact with the 1W MA200. As you realize, all those times have been what we call 'generational bottoms', thus extremely good long-term buy opportunities. And as you see they've been on extremely tight time symmetry, all took place roughly every 2.5 years.
If the pattern continues to repeat itself, then we may witness a rally (green Channel Up) similar to the one that peaked on November 2021 and reached the 2.618 Fibonacci extension. As a result, setting a $350 Target would be more than realistic based on this pattern.
-------------------------------------------------------------------------------
** Please LIKE 👍, FOLLOW ✅, SHARE 🙌 and COMMENT ✍ if you enjoy this idea! Also share your ideas and charts in the comments section below! This is best way to keep it relevant, support us, keep the content here free and allow the idea to reach as many people as possible. **
-------------------------------------------------------------------------------
💸💸💸💸💸💸
👇 👇 👇 👇 👇 👇
Alphabet (GOOGL) Stock Hits 2025 LowAlphabet (GOOGL) Stock Hits 2025 Low
As seen on the Alphabet (GOOGL) stock chart, the price has dropped close to $156—a level not seen since September 2024.
Since the start of 2025, the stock has fallen by more than 18%.
Why Is GOOGL Falling?
As mentioned earlier today, overall market sentiment remains bearish due to the White House’s tariff policies.
For Alphabet (GOOGL), the situation has worsened today due to the following developments (as reported by the media):
➝ Google has admitted liability and agreed to pay $100 million in cash to settle a US class-action lawsuit accusing the company of overcharging advertisers, according to Reuters. Alphabet shares dropped 4.4%.
➝ Google’s division was found guilty of anti-competitive behaviour in India related to its app store billing system.
Technical Analysis of Alphabet (GOOGL)
In February, we noted investors’ negative reaction to the company’s earnings report, which led to a bearish gap (marked by a red arrow).
Since then, bears have maintained control, pushing the price below the lower boundary of the ascending channel that had been valid since 2023. Key signals include:
➝ The $170 level (near the bearish gap on 10 March) acted as resistance on 25 March.
➝ Bears showed little reaction to bulls at the $160 level and have kept the price contained between two downward-sloping red lines.
Bears may now be targeting the psychological level of $150. If bulls want to maintain control over GOOGL’s long-term uptrend, they need to take action soon.
This article represents the opinion of the Companies operating under the FXOpen brand only. It is not to be construed as an offer, solicitation, or recommendation with respect to products and services provided by the Companies operating under the FXOpen brand, nor is it to be considered financial advice.

GOOGL ON SUPPORT: 23% BOUNCE IMMINENTNASDAQ:GOOGL GOOGL has consolidated significantly over the last few weeks and, like the NASDAQ, has also taken a beating. Due to the now attractive valuation, the continued stable growth and earnings growth, GOOGL is still a good investment.
Technically, we have reached a trend line and a weaker horizontal support with a further support area at around USD 150. We are already seeing the first RSI divergence. The Bollinger Bands (not shown in the chart, otherwise it would be confusing) are also far overstretched and make a bounce likely. There is also an open gap at $192 - $203.
I would open about 50% of the actual trading position now and the rest when the price falls into the green box, which I still consider to be a possible consolidation area. If the price turns immediately, we are still in with half.
Target Zones:
$192.00
$205.00
Support Zones:
$165.00
$150.00

Alphabet Stock (GOOGL): Bounce Incoming?There is growing potential that a major price top has formed, particularly after the break below the November low, which has increased the probability of this scenario. The move down from the February high appears to be a three-wave structure, and I am watching for a bounce from the current region. However, this could simply be a B-wave in the yellow scenario, setting up for much lower prices.
At this stage, it's too early to confirm a major top with certainty. The structure of the next rally will provide crucial insights. The current downward move is not yet a clear five-wave decline, leaving the door open for higher prices in the white scenario. However, even that becomes increasingly unlikely with a break below $157.50.
For now, the working thesis is that a major top has formed, but confirmation of new highs would only come with a break above $196.69. In the short term, the price should ideally react to the current region, but we need to see a break above $173 (closing the last gap) to indicate a local low is in place. If that happens, we could be in a B-wave, which would likely target the $183 to $196 zone before the next major decision point.

The only tech stock I’d consider buying right nowThis analysis is provided by Eden Bradfeld at BlackBull Research.
We’ve seen the S&P, NASDAQ and every other American index get slammed in the last couple of days. Some people are panicking. A lot of people are panicking. If you go on Twitter (sorry — X dot com) you will find a lot of people who listened to a recommendation from a guy on YouTube about a trash stock like say, IonQ or HIMS, and are now fairly upset said YouTube guy (or Twitch guy, or whatever) got it wrong.
Frankly, a correction is a healthy thing because it allows investors to purchase good companies at more reasonable multiples.
I have no idea where the market goes from here. I can’t see the future. I admit this sell-off has me adding tech stocks (and other American stocks) to my watch-list, and I’ll continue to monitor them.
A lot of tech stocks — the bulk of what has fallen as of late — still aren’t in that zone for me yet. Amazon still trades at a current multiple of 35x earnings and a fwd multiple of 28x — I can’t find much value in that, especially when I consider that Google, a company with +$83 billion in net profit and a 32% operating margin, can be acquired for 16x fwd earnings (I had to check those numbers too just to be sure — when you’ve still got things like Palantir trading “to the moon” (and back), 16x⁴ seems like a reasonable price for the dominant advertising platform in the world).
Here’s Buffett, in his 2008 essay — Buy American, I am:
A simple rule dictates my buying: Be fearful when others are greedy, and be greedy when others are fearful. And most certainly, fear is now widespread, gripping even seasoned investors. To be sure, investors are right to be wary of highly leveraged entities or businesses in weak competitive positions. But fears regarding the long-term prosperity of the nation’s many sound companies make no sense. These businesses will indeed suffer earnings hiccups, as they always have. But most major companies will be setting new profit records 5, 10 and 20 years from now.
Buffett was right, of course. If you purchased stocks in 2008 and held them you would’ve done pretty well (as long as you didn’t buy Lehman Brothers!). The GFC saw stocks fall 48% from their peak — if we are indeed heading towards that territory there is more room to fall. I have no idea — examining the basket of tech stocks I look at, the only one that presents any value is Google. It’s reasonable at 16x fwd earnings. If it traded at 12x earnings, it would be a bargain - in my opinion. How low can you go?

Googles next Move where to Long next + Wickless Candles Hi in this video I highlight what to look for in the chart to take shorts and where to fill Longs next . In addition to that I provide a small educational idea of looking out for Wickless candles and how they can add value to your analysis . Please like follow share and ask any questions that you have and thankyou for your support

Google Update - Trade this range and new ATH Identified Update video on the google Long that has been planned since early FEB. The level has now been hit and we got a nice reaction off that level . In this video I look into where I think we go next and how price plays out .
In the video I use the following tools TR Pocket FIB , 0.618 FIB , Pivots , Parallel Channel and the Fixed range Vol Profile.
If we stay range bound inside the channel then we have the potential to see a new high on google at the top of the channel in confluence with 1-1 ext + tr pocket expansion .
Watch the video and mark the levels on your chart and ensure to set your alerts .
Dont forget to Boost the chart Please and i welcome any questions TY

Alphabet Inc. (GOOGL) – Bullish Reversal Opportunity📉 Google stock has corrected ~16.9% from its $207 high last month, now testing a strong trendline support.
With bullish RSI divergence and major AI investments ahead, this could be a prime buy-the-dip opportunity!
📊 Trade Setup:
🔹 Entry Price: $171.80 (Current Price)
✅ Take Profit 1: $190 (Short-term resistance)
✅ Take Profit 2: $207 (Previous high)
✅ Take Profit 3: $220+ (Analyst average price target)
🔹 Stop-Loss: $165 (Below trendline)
🔹 RSI: Bullish divergence – signaling potential upside momentum
📈 Why Google?
AI & Cloud Expansion – $59B AI revenue expected by 2028 (Morgan Stanley)
Waymo Growth – Autonomous vehicle expansion into Miami (2026)
YouTube & Digital Ads – Performance Max driving revenue gains
Strong Cloud Business – Competing with AWS & Microsoft Azure
🔹 Analyst Insights:
Average Price Target: $210.62, implying a 23.66% upside from the current price.
High Price Target: $250.00, suggesting significant growth potential.
Consensus Rating: Moderate Buy based on evaluations from 43 analysts.
🔹 Regulatory Caution: DOJ lawsuits are a concern, but long-term AI & cloud growth remain strong.
📌 Key Levels to Watch:
Holding support at $165? This could trigger a major upside move.
Break above $190? Momentum could accelerate toward $207+
📢 Google is not just a search company—it’s an AI, cloud, and automation powerhouse. With strong support, favorable analyst forecasts, & major catalysts ahead, this could be a prime accumulation zone! 🚀
