Google aka Alphabet aka ABC aka A Bear's ComingA
B ear's
C oming
##################
Not a trading avdice
##################
Alphabet


SERIOUS: Eric Schmidt resigns as Google tumbles by $70 BillionGoogle suffered the biggest one-day tumble in its history - some $70 Billion wiped out ! Alphabet announced about 2 hours ago that Eric Schmidt the CEO for the last 18 years, will resign from June 2019, and will not seek to be re-elected. This is not great for investor confidence in the short term. Schmidt's resignation won't cure Google's woes anytime soon.
This significantly contributed to the DJI taking a dive for 200pts but recovering as the bulls charged in.
The last serious gap down for Google - not as bad - was in Feb 2018. On that occasion the gap was not closed and price went down for a further 4 days. This does not mean that the same will happen again. But it could.
Google is used to gapping up, not gapping down. After nearly every gap down price has moved further south. The bigger the gap, the less the initial recovery.
Is this the first domino to fall - the pinprick that pops the 'technology bubble'? I don't know. If it is, I trust that Mr Powell et al have enough cash to prop up the DJI. Well, it's easy for the FED cuz all they need to do is turn up the money-printing press. Innit!

Google/Alphabet Levels To Watch $1,180 and $1,094NASDAQ:GOOG Hi Guys if it breaks the $1,180 level then it would not surprise me to see it fall to $1,094 and re-test.

Google (GOOG)(NASDAQ) Buy Stop Limit $1203.61 >> Target $1217.96NASDAQ:GOOG
Google - Alpabet Inc. (GOOG)
Two days we closed upstairs main volume, today April 11, 2019 i believe price go in higher.
Gold is down right now, we have good idea for up S&P 500 today.
---
Buy Stop Limit - $1203.61
Take Profit - $1217.96
Stop Loss - $1196.44
------
Take Profit = +1.20%
Stop Loss = -0.60%

$GOOG Alphabet, new ATH incoming?$GOOG one of the largest companies in the world. \u2028I think we hold the grey zone, so we could see more upside target. You can see the Fib really did their thing. If we manage to break $1230 we could possible see a new ATH.
If manage to break lower, you could buy more around the trendline :)
Really depends on how GOOG reacts to the yellow zone once again.
Exciting :)


GOOGLE METTE IL TURBODopo un sano ritracciamento google sembra pronto a raggiungere i suoi massimi storici.

GOOGL: Leading Tech Stocks to break above clouds!Alphabet (GOOGL), the holding company of Google, has broken above the weekly Ichimoku cloud. Apple, Amazon and Facebook will soon be making attempts to do so. Watch out above!

Short it to the ground!Disclaimer: This is a trade that is set to last at least 6 months. Only for people invested in to consider selling, and those that do long term trades. Personally won't be shorting it. I lose my mind and start ripping my hair out if something takes more than 2 weeks.
End of the road for google. Their search engine is deteriorating. The markets globally are moving so irrationally. Dumb money for sure. Youtube is going crazy, discriminating people at random, killing videos, channels, they don't care about their creators because there is not much competition. Yet. But it is starting.
Not going to start a long explanation anyone can go check for themselves. Short version: Google products bad, bubble bad.
Remember what happened last year when the video game industry started abusing micro transactions and also getting "woke" and attacking their clients?
Right now it's even struggling to dead cat bounce, it actually looks like it's going to end up down 75% or more from ath.
Google 2008 linear chart:
Googl compared to video game companies:
What is the risk? The risk imo is the stock market, moving irrationally due to dumb money, has been going up for 6 months on trade war hopes, pulls a 1929 on us.
But even if that were to happen, doesn't mean google would go to 2000$. A stop loss at 1600$ would give much higher odds of winning, but not a great risk to reward. A stop loss at the previous high is a great risk to reward, but lower odds. So ye depends on every one strategy. I personally prefer RR 1 to 2. Lower than 1 you get really high winrates but it doesn't feel optimal and losers set you back alot doesn't matter in the long run but still, doesn't feel the best. And really high risk rewards are for idiots plain and simple.
For the next two decades whether it is wise to invest in googl or in their competitors (Yahoo/Verizon Vimeo/IAC etc) will depend on how googl adapts.
If they mess up and their leading position goes to their head and they refuse to adapt, then good night. Who cares about myspace or friendster now? What has their n°1 spot 20 years ago done for them? RIP.
It will also depend on their competitors. The whole company. Just 1 of their service growing is cute but the rest has to go along.
Also will depend on the charts, if supports are holding, if we see buying interest... Unless you're a pure value investor and don't care lol.
I still think it's interesting to look at the chart. What's the point of buying something of value cheap if no one is going to buy after you?
Maybe a whole new competitor emerges and tears google apart?
* Wait I'm seeing a pattern here. Every silenced/discriminated youtuber is a white man. Non profit channels to help handicapped children - that happen to be run by a white man - are getting hit (yes really... they got that dirty) handicapped children... are you serious... they literally could not be more evil... They're silencing channels about animals and stuff. Non political stuff, non edgy, non weird, non adult themed, just little children and animals.
Really? And what they all have in common is the youtuber has white skin and looks like a man. I didn't notice anything with the girls - except the non PC ones ofc - channels. And "trending" is full of black men and girls. OH MY this is it. This truly is what is going on. Wtf is wrong with these idiots? Discriminating a whole group because "we don't like it there is too many of them".
Isn't that how Hitler got started with the jews? Closing their stores with the SA in 1933?


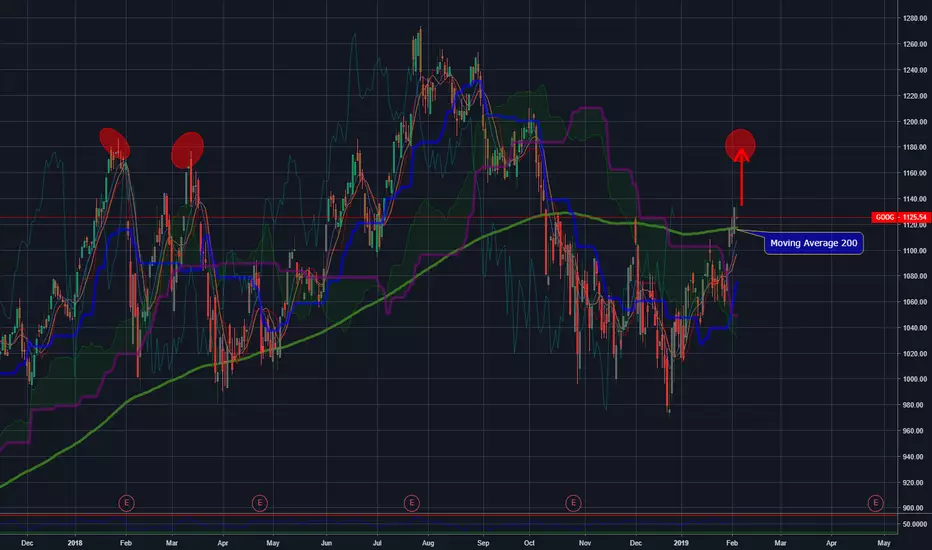
#GOOGLE,GOOG (Alphabet Inc.) Analysis+SignalAs we can see in the graph, we have returned to the buying trend for several days already! We recommend entering a Buy position for several reasons with a very specific target:
1. The price crossed the moving average 200 (Buy Signal) In the daily graph
2. The price crossed the Kijun Sen In the weekly graph
3. The price will seek to reach a psychological goal to test the power of buyers found in 1180 see the graph above
Buy Google
Entry Price:1123
Take Profit: 1180
ALPHABET GOOGL Daily Model Suggests Optimal Buy Point Q2 2020ALPHABET GOOGL Daily Model Suggests Optimal Buy Point Q2 2020
brschultz

GOOGL - Alphabet ( Long-Term )Hi, Probably price will retracement and then we might have a downward movement.
Good luck :)
Happy Pips!

Google Plans Huge Acquisitions Ahead?Summary:
- Former Oracle executive, Thomas Kurian takes over as Google Cloud CEO this month
- Kurian is well known for his strong track record in M&A, acquiring small businesses and turning them into profitable business units
What does it matter to you:
Under the leadership of the previous Google Cloud CEO, Diane Greene, Google has been losing out to its competitors on major acquisitions. The first one was Red Hat, who turned down Google’s offer in favour of IBM deal and the second one was GitHub which was bought over by Microsoft.
With Kurian takes over the CEO office, the street is expecting to see Kurian to set Google Cloud on a more aggressive path, with more eye-catching deals ahead. With this in mind, the next immediate questions investors should be aware of
- Is Google ready for the strategic move initiated by Kurian?
- Will Google move to the next chapter of growth?
We shall arrive at a clearer picture once Kurian has settled down in his office in the next few months.
From the technical perspective, the long term bullishness of Google is still intact, with no indication of the change of trend. The support zone of 950 – 1,000, which has been tested for few times, could be a good long term accumulation zone.
Reference for Details:
www.businessinsider.com

ALPHABET INC. (GOOGL) CLASS A: Is A Dip On The Way?Find Winning Trades In Seconds >> efcindicator.com (Special Discount)
The overall scenario is quite bullish, but in the short-term we can expect a test on S1 support.

What if GOOGLE falls?In this screencast I look at GOOGLE which is Alphabet, Apple, Netflix, Nvidia. The picture of meltdown is serious. Google is at a key level of congestion which could break down.
Overall the technology sector stocks which dominate Wall Street and other indices across the world could cause a domino effect.

ALPHABET INC. (GOOGL) Crash Incoming (~20% Drop On Its Way)ALPHABET INC., Google's parent company, is no exception to what is coming to conventional markets. There are many very strong signals pointing towards a crash... and this crash is already on its way.
GOOGL has already dropped by over 18% since hitting a All Time High on the July 2018... More red is on its way.
Let's take a look at the signals for learning and entertainment purposes:
Let's start with the MACD. On the left hand side, you can see a red dotted line with an "X" in the middle... This is back in 2008. When the MACD crossed below 0, the price crashed really hard. When you look at the right hand side of the indicator, you can notice that the same event is taking place now. This is a strong bearish signal.
If you have been reading my analysis you should be pretty familiar now with the signal called "divergence"... This is going on here as well on both MACD and RSI (Bearish Divergence).
GOOGL broke and closed below EMA50. It was quickly rejected when it tried to move back up. If GOOGL breaks and closes below EMA100 (blue line), we can aim straight for our "MAIN TARGET" on chart.
RSI & MACD are bearish.
These signals are very strong and clear... ALPHABET INC. (GOOGL) will continue to crash. Others are also crashing...
Apple:
Bank Of America:
S&P500:
Thanks a lot for reading... Hit LIKE for more analysis straight to your inbox...
I appreciate your support.
Namaste.

Google Long 2nd analysisAfter the analysis made yesterday on the daily chart the price of google opened above it's previous resistance, this means the 1st trade is good to go, however as a good analyst one must always assume his position is wrong and look for further analysis to try and take cover from any unforsean threats. On this analysis I marked the significant support and resitance of the hourly chart and left the ones of the daily visible in order to set target. Looking at the RSI it seems that price should correct within the next couple of hours at least enough for the RSI to go back to not overbought levels and like that recharge for the next bull move. However with a severe overextension on the MACD I highly doubt the 1st trade layed on this analysis is the optimal one, I belive the second one to be a better position in which there is segnificanly less risk and more reward

Google longafter a large drop google seems to be gaining some momentum to the upside as there is no overextension on the rsi and there is also a price and momentum divergence which is considered a bull signal. Id refuse to buy at market price given the risk of a correction wave pulling us out of the market. However breaking above the support and closing above without overextrending the RSI would be a huge protection to the position and would be a clear bull signal

$GOOGL Testing Weekly SupportMight be able to catch a bounce off weekly support here for $GOOGL. Buy zone is as shown. Not the best R/R. Also watching the markets in general. Tech sector has taken a hit in 2018. Will update position accordingly.

Google will ounce back to $1138/$1158Currently showing a reversal structure with good accumulation and bullish divergence, here are some short term targets.

GOOG - Cycle Wave 2 - SHORT NASDAQ:GOOG is a STRONG SELL.
Cycle Wave 1 complete.
Cycle Wave 2 beginning...
Near-Term Target (30-90 days): $975
Long-Term Target (1yr+): $660
Primary Wave (Down)
Will update.
-AB
