#ALPHA /USDT breakdown alert#ALPHA
The price is moving within a descending channel on the 1-hour frame and is expected to break and continue upward.
We have a trend to stabilize above the 100 moving average once again.
We have a downtrend on the RSI indicator that supports the upward break.
We have a support area at the lower limit of the channel at 0.01111, acting as strong support from which the price can rebound.
Entry price: 0.01156.
First target: 0.01288.
Second target: 0.01400.
Third target: 0.01512.
To manage risk, don't forget stop loss and capital management.
When you reach the first target, save some profits and then change the stop order to an entry order.
For inquiries, please comment.
Thank you.
ALPHAUSDT

ALPHAUSDT breakdown alertALPHAUSDT breakdown alert
ALPHAUSDT has broken down from a descending triangle pattern, which is typically a bearish continuation setup. The price failed to hold above the lower support trendline, indicating increased selling pressure and a possible continuation of the downtrend.
If the breakdown sustains with strong volume, we may see further downside movement. However, if the price quickly reclaims the broken support level, the move could turn out to be a fakeout.
Key levels to watch:
* Previous support now acting as resistance
* Breakdown confirmation zone
* Volume strength for validation
Keep an eye on ALPHA — confirmation of this breakdown could lead to lower targets ahead.

ALPHAUSDT 1D Analyss ALPHA ~ 1D Analysis
#ALPHA Buy after successfully breaking through this resistance line with a short-term target of at least 15%++.

ALPHAUSDT | Sellers in Control—Key Resistance Levels DefinedALPHAUSDT shows a brief uptick, but the underlying strength remains with sellers. Buyers have yet to demonstrate sustained conviction, and this suggests any rally may be engineered rather than genuine.
🔴 Manipulation Target: Red Line
A slight advance today appears aimed at the area marked by the red line, where liquidity may be swept before a reversal. This level serves as a likely pivot for engineered moves designed to trap uninformed participants.
🔴 Core Resistance: Red Box
Beyond the red line, the red box identifies the primary seller domain. Price has stalled here repeatedly, confirming that sellers guard this zone aggressively. Until ALPHAUSDT clears the red box on substantial volume and with clear low‑time‑frame breakouts, the bearish bias remains intact.
📉 How to Trade This Setup
Short Entries
• Look for price to approach the red line and fail to hold—this often precedes a stronger reversal into the red box.
• Confirm with a clean breakdown on lower time frames and a negative divergence in CDV to validate seller dominance.
Risk Management
• Place stops just above the red box or red line, depending on your preferred trigger, to cap potential losses.
Stay Patient
• If price unexpectedly breaks above these levels with convincing volume and retests as support, only then will I reconsider the bearish view.
By focusing on where genuine selling pressure resides, and waiting for real confirmations, you avoid getting caught in manipulative spikes and trade with confidence.
📌I keep my charts clean and simple because I believe clarity leads to better decisions.
📌My approach is built on years of experience and a solid track record. I don’t claim to know it all but I’m confident in my ability to spot high-probability setups.
📌If you would like to learn how to use the heatmap, cumulative volume delta and volume footprint techniques that I use below to determine very accurate demand regions, you can send me a private message. I help anyone who wants it completely free of charge.
🔑I have a long list of my proven technique below:
🎯 ZENUSDT.P: Patience & Profitability | %230 Reaction from the Sniper Entry
🐶 DOGEUSDT.P: Next Move
🎨 RENDERUSDT.P: Opportunity of the Month
💎 ETHUSDT.P: Where to Retrace
🟢 BNBUSDT.P: Potential Surge
📊 BTC Dominance: Reaction Zone
🌊 WAVESUSDT.P: Demand Zone Potential
🟣 UNIUSDT.P: Long-Term Trade
🔵 XRPUSDT.P: Entry Zones
🔗 LINKUSDT.P: Follow The River
📈 BTCUSDT.P: Two Key Demand Zones
🟩 POLUSDT: Bullish Momentum
🌟 PENDLEUSDT.P: Where Opportunity Meets Precision
🔥 BTCUSDT.P: Liquidation of Highly Leveraged Longs
🌊 SOLUSDT.P: SOL's Dip - Your Opportunity
🐸 1000PEPEUSDT.P: Prime Bounce Zone Unlocked
🚀 ETHUSDT.P: Set to Explode - Don't Miss This Game Changer
🤖 IQUSDT: Smart Plan
⚡️ PONDUSDT: A Trade Not Taken Is Better Than a Losing One
💼 STMXUSDT: 2 Buying Areas
🐢 TURBOUSDT: Buy Zones and Buyer Presence
🌍 ICPUSDT.P: Massive Upside Potential | Check the Trade Update For Seeing Results
🟠 IDEXUSDT: Spot Buy Area | %26 Profit if You Trade with MSB
📌 USUALUSDT: Buyers Are Active + %70 Profit in Total
🌟 FORTHUSDT: Sniper Entry +%26 Reaction
🐳 QKCUSDT: Sniper Entry +%57 Reaction
📊 BTC.D: Retest of Key Area Highly Likely
📊 XNOUSDT %80 Reaction with a Simple Blue Box!
📊 BELUSDT Amazing %120 Reaction!
📊 Simple Red Box, Extraordinary Results
I stopped adding to the list because it's kinda tiring to add 5-10 charts in every move but you can check my profile and see that it goes on..

Stella (Alpha) Starts to Recover From True-BottomLet's start with the linear chart.
ALPHAUSDT is trading at bottom prices and here we can appreciate two sessions recently with really high volume. When the bottom is getting close, we tend to see whale accumulation happening.
The second high volume session came in 28-April.
The session that produced the correction bottom was the week of 5-May. Now ALPHAUSDT is turning green.
The orthodox end of the bear market happened June 2022 and the ensuing action is the same consolidation pattern we've been seeing through many charts. The difference is that here we have lower lows. Some produce higher lows others lower lows, still, it is the same market phase. A transition period from neutral to bullish. Look at the linear chart again and you can see the action being 100% flat.
Now, once we hit bottom, there is no other place left to go but up.
» ALPHAUSDT already hit bottom just two weeks ago; it is getting ready to grow. Long-term growth. This is an easy buy and hold.
Namaste.

ALPHA is Ready To Fly (8H)ALPHA has encountered a key zone filled with strong buy orders.
The volume of these orders appears sufficient to potentially pump ALPHA to higher levels.
On the chart, we also have bullish confirmations, such as the formation of a CH (Change of Character) and the breakout of the trigger line.
As long as the green zone holds, ALPHA can move toward the target profit (TP) levels marked on the chart.
However, a daily candle closing below the invalidation level would invalidate this analysis.
Do not enter the position without capital management and stop setting
Comment if you have any questions
thank you

#ALPHA/USDT#ALPHA
The price is moving within a descending channel on the 1-hour frame, adhering well to it, and is heading for a strong breakout and retest.
We are seeing a bounce from the lower boundary of the descending channel, which is support at 0.0293.
We have a downtrend on the RSI indicator that is about to be broken and retested, supporting the upward trend.
We are looking for stability above the 100 moving average.
Entry price: 0.0300
First target: 0.0306
Second target: 0.0314
Third target: 0.0323

ALPHA Is Ready To Fly (8H)ALPHA has encountered a key zone filled with strong buy orders.
The volume of these orders appears sufficient to potentially pump ALPHA to higher levels.
On the chart, we also have bullish confirmations, such as the formation of a CH (Change of Character) and the breakout of the trigger line.
As long as the green zone holds, ALPHA can move toward the target profit (TP) levels marked on the chart.
However, a daily candle closing below the invalidation level would invalidate this analysis.
Do not enter the position without capital management and stop setting
Comment if you have any questions
thank you

ALPHAUSDT 1WALPHA ~ 1W Analysis
#ALPHA This is the lowest support for now. Buy from here with a short -term target of at least 15%+. Trading is very high risk.

Stella, is she finally ready?Stella has been in a massive downtrend since it's run in 2021.
Looking at the above chart there is a reason to be bullish now and with a massive pricetarget.
It has been trading in a bull-flag for years and has recently broken out, AND retested the upper bound of the channel.
Target: 3$ (would mean an mcap of 3B, which is doable)
Stoploss: 0.035$ (would mean re entry of the channel and invalidates this idea)
Will update frequently when asked
Rustle

#ALPHA: Will the Bulls Take Over or Is Another Shakeout Coming?Yello, Paradisers! Is #ALPHAUSDT ready for a major breakout, or will weak hands get liquidated before the real move begins? Let’s dive into the latest setup of #Stella:
💎#ALPHA is trading within a falling wedge, a classic bullish reversal pattern. This setup often signals a strong breakout once the price breaks above the descending resistance. The probability of a bullish breakout is high due to the bullish divergence on the MACD.
💎The immediate resistance is at $0.0659. A decisive break and close above this level could trigger a bullish rally toward the next target at $0.0934. But the real game-changer will be the strong resistance zone around $0.12. If ALPHA pushes through that, you can expect fireworks.
💎The bullish divergence on the MACD further strengthens the bullish outlook. This indicates potential momentum building up for a reversal. However, don't rule out a possible liquidity grab—we might see the price dip towards the $0.0368 or even the $0.0245 strong support zone to shake out weak hands before the real move happens.
💎The $0.0368 support level is crucial. A breakdown below this could lead to a retest of the $0.0245 zone. If #ALPHAUSD falls below $0.0245, the bullish setup would be invalidated, and we might see a deeper correction towards $0.01. Stay vigilant and manage your risk carefully.
Stay focused, patient, and disciplined, Paradisers🥂
MyCryptoParadise
iFeel the success🌴

ALPHAUSDT 1WALPHA ~ 1W Analysis
#ALPHA If you still have a Conviction on this Coin, Maybe you can consider this support to start buying again, a minimum target of 20%+
BUY ALPHAUSDT - BULLISH SIGNAL, HIGH REWARD 100%+ GAINOverview:
We are excited to share a high-probability trading signal for BINANCE:ALPHAUSDT ALPHA/USDT , backed by strong technical indicators and market analysis.
Chart Analysis:
The chart for ALPHA/USDT indicates a compelling opportunity with a probability of success estimated at up to 80%. Technical indicators align with a positive trend, providing a solid foundation for potential price appreciation.
Reasons to Consider:
Bullish Momentum: ALPHA/USDT is exhibiting clear signs of bullish momentum, with key indicators pointing towards a sustained upward movement.
Historical Support: Historical price action shows a strong support level at , reinforcing the likelihood of a positive price trend.
Market Sentiment: Current market sentiment supports the potential for a significant price increase, with an estimated 80% probability of success.
Stop-Loss: To manage risk, consider placing a stop-loss at .
Disclaimer:
While the probability of success is estimated at 80%, trading always involves risk. Conduct thorough research and consider market conditions before making any investment decisions. This analysis is based on technical indicators and historical data, and market dynamics may change. Implement proper risk management strategies to safeguard your capital.
Conclusion:
The ALPHA/USDT signal presents a high-probability opportunity for traders, with strong technical support and positive market sentiment. Stay vigilant, monitor price movements, and adapt your strategy as needed. Happy trading!
Adjust the details and levels based on your specific analysis and market conditions. Always keep your trading signals updated as new information becomes available.

ALPHAUSDT 1WALPHA ~ 1W
#ALPHA So far it continues to maintain this support block,. If you still have Conviction on this coin,. buy after retesting this support block, with a short-term target of at least 20%+

ALPHA planThis is my plan for ALPHA. Buy in orange box because I expect us to go down a little bit lower.

Alpha/UsdtBINANCE:ALPHAUSDT
🔹 **Current Price:** $0.0839
🔹 **Resistance Levels (if price holds):**
- 🚀 **$0.0950**
- 🚀 **$0.1034**
- 🚀 **$0.132**
🔹 **Support Levels (if price doesn't hold):**
- 📉 **$0.0750**
- 📉 **$0.0645**
---
### 🚀 If the price stays around **$0.0839** and pushes higher, the next resistance levels are **$0.0950**, **$0.1034**, and potentially up to **$0.132**. If the price tests these levels successfully, it could indicate a strong bullish momentum. 💥
### 📉 If the price falls below **$0.0839**, the support levels to watch are **$0.0750** and **$0.0645**. If the price breaks these levels, there might be further downward movement. ⚠️
---
This is just a technical analysis and is **not financial advice**. Always do your own research (DYOR)! 📊

#ALPHA/USDT Ready to go higher
#ALPHA
The price is moving in a descending channel on the 1-hour frame and sticking to it well
We have a bounce from the lower limit of the descending channel, this support is at 0.1048
We have a downtrend on the RSI indicator that is about to be broken, which supports the rise
We have a trend to stabilize above the moving average 100
Entry price 0.1080
First target 0.1110
Second target 0.1182
Third target 0.1248

Stella (ALPHA)Stella's chart is straightforward; a sharp upward move followed by a lengthy correction wave unfolded in a big descending triangle pattern. Recently, ALPHA broke the major downtrend line. Let's see how up Stella can go.

Alpha/usdt approaching a critical breakout zone Alpha/usdt approaching a critical breakout zone
Alpha/usdt is nearing a significant trendline resistance after a prolonged consolidation phase. The price action suggests that momentum is building for a potential breakout. If this happens, it could pave the way for a strong bullish move.
Key observations:
- The trendline has acted as a cap on the price for an extended period, and a break above it could indicate a major shift in market dynamics.
- Volume is gradually increasing, signaling growing interest among traders.
- Momentum indicators like rsi and macd are aligning with the potential breakout, hinting at a bullish bias.
Tips for trading this setup:
- Wait for a clear 4h or daily candle close above the trendline to confirm the breakout.
- Look for a retest of the breakout zone to establish it as a new support level.
- Ensure the breakout is supported by a noticeable increase in trading volume to validate its strength.
Risk management is key. Set a stop-loss below the breakout zone to manage potential invalidation and position yourself wisely. This analysis is for educational purposes; always do your own research and trade responsibly.

ALPHA Will Shows Significant Gains But Finally CollapsesHello, Skyrexians!
As you know we like to share with you analysis on crypto assets which are in uptrend and have significant potential to grow. Today we wanna show you the example of coin which is likely in global downtrend. For sure BINANCE:ALPHAUSDT has not set the lower low in comparison to previous bull run, but it dropped significantly to set the new ATH, that is we expect only exit pump.
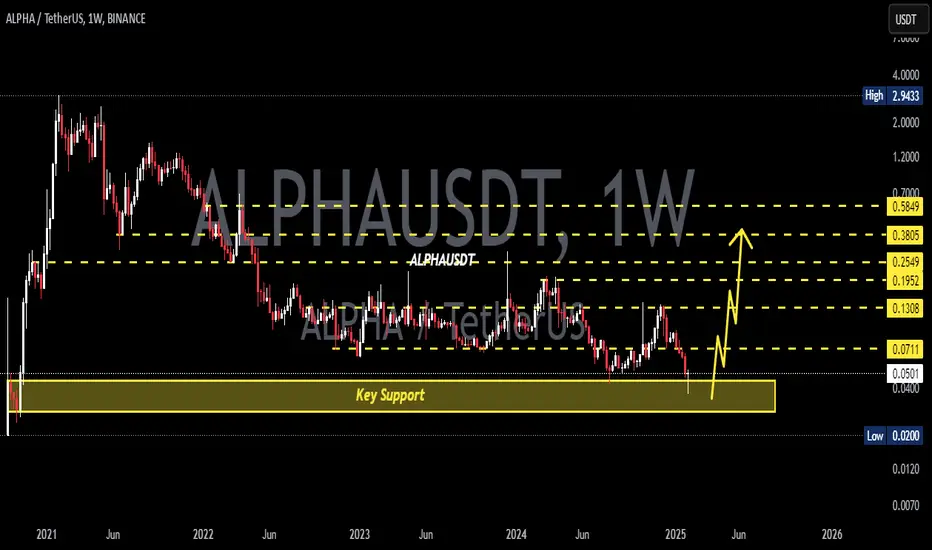
Let's take a look at the weekly time frame. We can see that current bear market is much more intensive than on other assets. We can see here the clear 5 Elliott waves structure to the downside. The wave 5 is likely to be finished already finishing the wave 1 of higher degree. Green dot on the Bullish/Bearish Reversal Bar Indicator shows us the strongest reversal sign that bear market is finished.
It means, that large wave 2 can happen now. Despite this asset is in global downtrend it can make significant gains reaching 0.5-0.61 Fibonacci retracement level. Notice that this Fibonacci based on regular chart. We show Fibo chart for your convenience. The target is located between $1.47 and $1.87. After such incredible growth we expect the huge crash to new all-time low.
Best regards,
Skyrexio Team
___________________________________________________________
Please, boost this article and subscribe our page if you like analysis!

ALPHAUSDT 1WALPHA ~ 1W
#ALPHA If you still have Conviction on this coin,. Buy gradually inside this pattern,. it is only a matter of time that this resistance line is successfully broken, with a minimum target of 20%+

Alpha - Could the whales be accumulating?My friends,
I continue to search for another coin that has yet to show significant movement amidst a market filled with optimism for investors, especially with the explosive growth of XRP. I am looking for a coin tied to the decentralized finance (DeFi) sector. With these two criteria in mind, Alpha has caught my attention.
What drew me to this coin wasn’t a divergence between price and RSI indicating a reversal, but rather its trading volume at the end of October. Do you see the trading volume I highlighted? It stands out remarkably compared to previous periods.
Even more striking, while the volume surged significantly, the price remained relatively stable. I’ve observed this across different timeframes and asked myself questions. The most convincing one is this: could the whales be accumulating? I don’t know for sure!
But I think it’s time to place an order and patiently wait to see the price levels it can achieve.
Best Regards,

ALPHAUSDT.PHow are you on this beautiful Friday?
I’m watching the ALPHAUSDT pair on the daily chart, and it seems bearish. Here’s why:
First, there’s an inverse hammer candle that was stopped at the black line resistance.
Second, the price has fallen back below the 200MA after a failed crossover.
One thing I don’t like is the volume from October 22. However, when switching to the 4H candles, I can see that most of the volume was on the downside, which reinforces my bearish bias.
Thanks for reading!
