ALPHAUSDT breakdown alertALPHAUSDT breakdown alert
ALPHAUSDT has broken down from a descending triangle pattern, which is typically a bearish continuation setup. The price failed to hold above the lower support trendline, indicating increased selling pressure and a possible continuation of the downtrend.
If the breakdown sustains with strong volume, we may see further downside movement. However, if the price quickly reclaims the broken support level, the move could turn out to be a fakeout.
Key levels to watch:
* Previous support now acting as resistance
* Breakdown confirmation zone
* Volume strength for validation
Keep an eye on ALPHA — confirmation of this breakdown could lead to lower targets ahead.
ALPHAUSDTPERP

ALPHAUSDT 1D Analyss ALPHA ~ 1D Analysis
#ALPHA Buy after successfully breaking through this resistance line with a short-term target of at least 15%++.

ALPHAUSDT | Sellers in Control—Key Resistance Levels DefinedALPHAUSDT shows a brief uptick, but the underlying strength remains with sellers. Buyers have yet to demonstrate sustained conviction, and this suggests any rally may be engineered rather than genuine.
🔴 Manipulation Target: Red Line
A slight advance today appears aimed at the area marked by the red line, where liquidity may be swept before a reversal. This level serves as a likely pivot for engineered moves designed to trap uninformed participants.
🔴 Core Resistance: Red Box
Beyond the red line, the red box identifies the primary seller domain. Price has stalled here repeatedly, confirming that sellers guard this zone aggressively. Until ALPHAUSDT clears the red box on substantial volume and with clear low‑time‑frame breakouts, the bearish bias remains intact.
📉 How to Trade This Setup
Short Entries
• Look for price to approach the red line and fail to hold—this often precedes a stronger reversal into the red box.
• Confirm with a clean breakdown on lower time frames and a negative divergence in CDV to validate seller dominance.
Risk Management
• Place stops just above the red box or red line, depending on your preferred trigger, to cap potential losses.
Stay Patient
• If price unexpectedly breaks above these levels with convincing volume and retests as support, only then will I reconsider the bearish view.
By focusing on where genuine selling pressure resides, and waiting for real confirmations, you avoid getting caught in manipulative spikes and trade with confidence.
📌I keep my charts clean and simple because I believe clarity leads to better decisions.
📌My approach is built on years of experience and a solid track record. I don’t claim to know it all but I’m confident in my ability to spot high-probability setups.
📌If you would like to learn how to use the heatmap, cumulative volume delta and volume footprint techniques that I use below to determine very accurate demand regions, you can send me a private message. I help anyone who wants it completely free of charge.
🔑I have a long list of my proven technique below:
🎯 ZENUSDT.P: Patience & Profitability | %230 Reaction from the Sniper Entry
🐶 DOGEUSDT.P: Next Move
🎨 RENDERUSDT.P: Opportunity of the Month
💎 ETHUSDT.P: Where to Retrace
🟢 BNBUSDT.P: Potential Surge
📊 BTC Dominance: Reaction Zone
🌊 WAVESUSDT.P: Demand Zone Potential
🟣 UNIUSDT.P: Long-Term Trade
🔵 XRPUSDT.P: Entry Zones
🔗 LINKUSDT.P: Follow The River
📈 BTCUSDT.P: Two Key Demand Zones
🟩 POLUSDT: Bullish Momentum
🌟 PENDLEUSDT.P: Where Opportunity Meets Precision
🔥 BTCUSDT.P: Liquidation of Highly Leveraged Longs
🌊 SOLUSDT.P: SOL's Dip - Your Opportunity
🐸 1000PEPEUSDT.P: Prime Bounce Zone Unlocked
🚀 ETHUSDT.P: Set to Explode - Don't Miss This Game Changer
🤖 IQUSDT: Smart Plan
⚡️ PONDUSDT: A Trade Not Taken Is Better Than a Losing One
💼 STMXUSDT: 2 Buying Areas
🐢 TURBOUSDT: Buy Zones and Buyer Presence
🌍 ICPUSDT.P: Massive Upside Potential | Check the Trade Update For Seeing Results
🟠 IDEXUSDT: Spot Buy Area | %26 Profit if You Trade with MSB
📌 USUALUSDT: Buyers Are Active + %70 Profit in Total
🌟 FORTHUSDT: Sniper Entry +%26 Reaction
🐳 QKCUSDT: Sniper Entry +%57 Reaction
📊 BTC.D: Retest of Key Area Highly Likely
📊 XNOUSDT %80 Reaction with a Simple Blue Box!
📊 BELUSDT Amazing %120 Reaction!
📊 Simple Red Box, Extraordinary Results
I stopped adding to the list because it's kinda tiring to add 5-10 charts in every move but you can check my profile and see that it goes on..

#ALPHA/USDT#ALPHA
The price is moving within a descending channel on the 1-hour frame, adhering well to it, and is heading for a strong breakout and retest.
We are seeing a bounce from the lower boundary of the descending channel, which is support at 0.0293.
We have a downtrend on the RSI indicator that is about to be broken and retested, supporting the upward trend.
We are looking for stability above the 100 moving average.
Entry price: 0.0300
First target: 0.0306
Second target: 0.0314
Third target: 0.0323

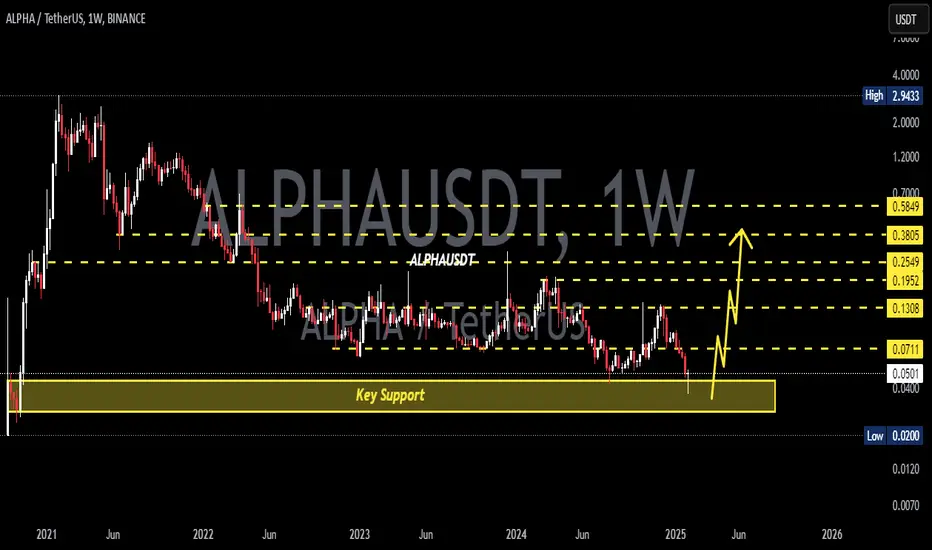
ALPHAUSDT 1WALPHA ~ 1W Analysis
#ALPHA This is the lowest support for now. Buy from here with a short -term target of at least 15%+. Trading is very high risk.

ALPHAUSDT 1WALPHA ~ 1W Analysis
#ALPHA If you still have a Conviction on this Coin, Maybe you can consider this support to start buying again, a minimum target of 20%+
ALPHAUSDT 1WALPHA ~ 1W
#ALPHA So far it continues to maintain this support block,. If you still have Conviction on this coin,. buy after retesting this support block, with a short-term target of at least 20%+

#ALPHA/USDT Ready to go higher
#ALPHA
The price is moving in a descending channel on the 1-hour frame and sticking to it well
We have a bounce from the lower limit of the descending channel, this support is at 0.1048
We have a downtrend on the RSI indicator that is about to be broken, which supports the rise
We have a trend to stabilize above the moving average 100
Entry price 0.1080
First target 0.1110
Second target 0.1182
Third target 0.1248

Alpha/usdt approaching a critical breakout zone Alpha/usdt approaching a critical breakout zone
Alpha/usdt is nearing a significant trendline resistance after a prolonged consolidation phase. The price action suggests that momentum is building for a potential breakout. If this happens, it could pave the way for a strong bullish move.
Key observations:
- The trendline has acted as a cap on the price for an extended period, and a break above it could indicate a major shift in market dynamics.
- Volume is gradually increasing, signaling growing interest among traders.
- Momentum indicators like rsi and macd are aligning with the potential breakout, hinting at a bullish bias.
Tips for trading this setup:
- Wait for a clear 4h or daily candle close above the trendline to confirm the breakout.
- Look for a retest of the breakout zone to establish it as a new support level.
- Ensure the breakout is supported by a noticeable increase in trading volume to validate its strength.
Risk management is key. Set a stop-loss below the breakout zone to manage potential invalidation and position yourself wisely. This analysis is for educational purposes; always do your own research and trade responsibly.

ALPHAUSDT 1WALPHA ~ 1W
#ALPHA If you still have Conviction on this coin,. Buy gradually inside this pattern,. it is only a matter of time that this resistance line is successfully broken, with a minimum target of 20%+

ALPHAUSDT 1WALPHA ~ 1W
#ALPHA Make purchases gradually on this support block. with a target of at least 15%+ from here.

Alpha/Usdt Plan Alpha/usdg is attempting to break out of the trendline resistance on the daily time frame. In the event of a successful breakout, there is the anticipation of a significant bullish rally. However, it is important to note that this information is not intended as financial advice. It is always recommended to conduct your own research (DYOR - Do Your Own Research) and consider various factors before making any investment decisions.

ALPHAUSD 1WALPHA ~ 1 W 📈
#ALPHA Make purchases gradually from here, with a minimum target of 20%++. A retest of this support line has been successful.

#ALPHA/USDT | Ready To Go#ALPHA
The 1-day bearish channel was broken strongly to the upside
Supported by stability above the Moving Average 100
It is supported by a rebound from the green support area on the chart
We also have a positive divergence on the RSI indicator
Entry price is 0.1150
The first target is 0.1253
The second goal is 0.1381
The third goal is 0.1543

ALPHA target 0.21D time frame
-
ALPHA is creating a bottom structure ranging from 0.5~0.7, and there are 3 obvious resistance zones on the chart. Considering the potential trend of Bitcoin and Ethereum, the first resistance (0.2) is the possible PRZ before bull coming. However, if bull market start running, we can expect 0.6 in next year.
TP: 0.2~0.26 / 0.4~0.43 / 0.6~0.7
SL: 0.057

ALPHAUSDT - Buy Setup!!ALPHAUSDT (1D Chart) Technical analysis
ALPHAUSDT (1D Chart) Currently trading at $0.085
Buy level: Above $0.084
Stop loss: Below $0.073
TP1: $0.09
TP2: $0.1
TP3: $0.12
TP4: $0.145
Max Leverage 3x
Always keep Stop loss
Follow Our Tradingview Account for More Technical Analysis Updates, | Like, Share and Comment Your thoughts

Alpha USDT Long Entry Chats shows a bullish signBINANCE:ALPHAUSDT.P Alpha USDT
Price Break the resistance level .11276 now retest the in 1 Hr TF. Bullish Candle in 4 Hr very good bullish sign towards price more upward direction in coming hr. Price 2 times test the .12544 Level now again test this level. If price break this level or stay above this level at least 1 day then chances move upward direction. Otherwise again tested and rejected this level again.
Now we enter the .11500 level. And tp is .12511.

Alpha Venture DAO (ALPHA) forming bullish BAT for upto 35% pumpHi dear friends, hope you are well and welcome to the new trade setup of Alpha Venture DAO (ALPHA).
On a 4-hr time frame, ALPHA with Bitcoin pair is about to complete a bullish BAT move.
Note: Above idea is for educational purpose only. It is advised to diversify and strictly follow the stop loss, and don't get stuck with trade

🟢 ALPHAUSDT - 1D (26.09.2022)🟢 ALPHAUSDT
TF: 1D
Side: Long
Pattern Bull Pennant
SL: $0.0939
Leverage: 5x
TP 1: $0.1212
TP 2: $0.1333
TP 3: $0.1431
TP 4: $0.1529
This thing is looking super oversold. It could have a nice run up if BTC pumps.

ALPHA USDT complicated tradeFirst of all this is a 2x max leverage.
you will have to keep an eye n this one.
i am entering a short position at 0.1140 with 75% of the total position and setting an order for the rest of the short at 0.1163.
i will have 2 take profit points.
50% at 0.1117
50% at 0.1041
stop loss if 4hour candle closes above 0.1160
if target one is hit,you set stop loss at entry price as always.
it is a make it or break it point for $alpha.
technically it is about to drop.
Follow for more and check previous signals guys.

ALPHA - Looking like a great level breakout!⭐️ BTC bullish and did a false breakout
⭐️ Mirror level is visible on daily timeframe
⭐️ Volume is at bottom
⭐️ 3rd touch
⭐️ Level is 4 days old
⭐️ 40 ATR
⭐️ Over VWAP
Will enter when price squeezes to the level on lower timeframes, the base will form and the strip will get faster.
Fix profit by parts:
1% - 1/3
2% - 1/3, stoploss to breakeven
What's left, hold to the maximum
What do you think of this idea? What is your opinion? Share it in the comments📄🖌
If you like the idea, please give it a like. This is the best "Thank you!" for the author 😊
P.S. Always do your own analysis before a trade. Put a stop loss. Fix profit in parts. Withdraw profits in fiat and reward yourself and your loved ones

Alpha talk to me Like Lovers Do 60Alpha has found support and is ready to take us for a joy ride. Padawan, this is a job for a Jedi, do me a favor-
Hand me my Lightsaber
Stop Loss 0.35

alpha retest inalpha looking good here after retesting breaking the down trend
could see a big move soon
