ALPHAUSDT 1D Analyss ALPHA ~ 1D Analysis
#ALPHA Buy after successfully breaking through this resistance line with a short-term target of at least 15%++.
Alphausdtsignal

ALPHAUSDT 1WALPHA ~ 1W Analysis
#ALPHA This is the lowest support for now. Buy from here with a short -term target of at least 15%+. Trading is very high risk.

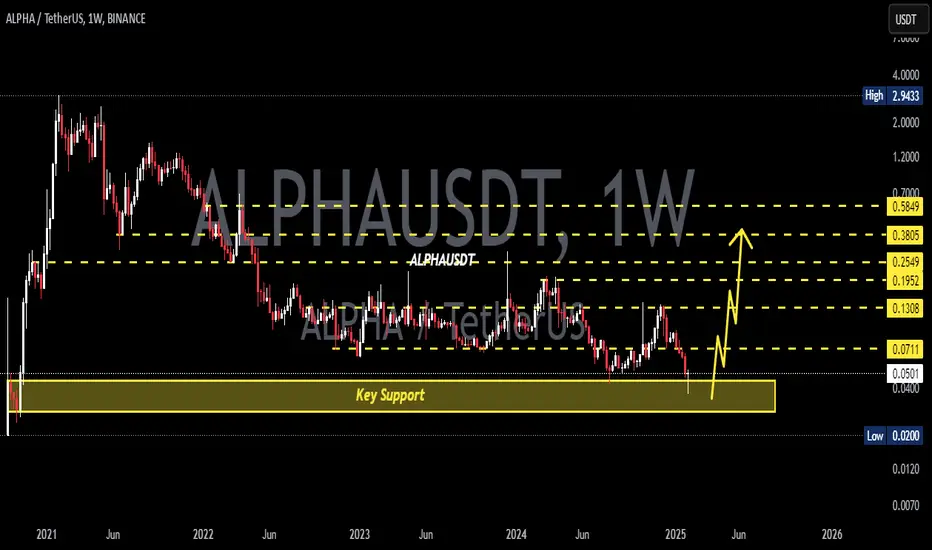
ALPHAUSDT 1WALPHA ~ 1W Analysis
#ALPHA If you still have a Conviction on this Coin, Maybe you can consider this support to start buying again, a minimum target of 20%+
ALPHAUSDT 1WALPHA ~ 1W
#ALPHA So far it continues to maintain this support block,. If you still have Conviction on this coin,. buy after retesting this support block, with a short-term target of at least 20%+

ALPHA Will Shows Significant Gains But Finally CollapsesHello, Skyrexians!
As you know we like to share with you analysis on crypto assets which are in uptrend and have significant potential to grow. Today we wanna show you the example of coin which is likely in global downtrend. For sure BINANCE:ALPHAUSDT has not set the lower low in comparison to previous bull run, but it dropped significantly to set the new ATH, that is we expect only exit pump.
Let's take a look at the weekly time frame. We can see that current bear market is much more intensive than on other assets. We can see here the clear 5 Elliott waves structure to the downside. The wave 5 is likely to be finished already finishing the wave 1 of higher degree. Green dot on the Bullish/Bearish Reversal Bar Indicator shows us the strongest reversal sign that bear market is finished.
It means, that large wave 2 can happen now. Despite this asset is in global downtrend it can make significant gains reaching 0.5-0.61 Fibonacci retracement level. Notice that this Fibonacci based on regular chart. We show Fibo chart for your convenience. The target is located between $1.47 and $1.87. After such incredible growth we expect the huge crash to new all-time low.
Best regards,
Skyrexio Team
___________________________________________________________
Please, boost this article and subscribe our page if you like analysis!

ALPHAUSDT 1WALPHA ~ 1W
#ALPHA If you still have Conviction on this coin,. Buy gradually inside this pattern,. it is only a matter of time that this resistance line is successfully broken, with a minimum target of 20%+

ALPHAUSDT 1WALPHA ~ 1W
#ALPHA Make purchases gradually on this support block. with a target of at least 15%+ from here.

ALPHA target 0.21D time frame
-
ALPHA is creating a bottom structure ranging from 0.5~0.7, and there are 3 obvious resistance zones on the chart. Considering the potential trend of Bitcoin and Ethereum, the first resistance (0.2) is the possible PRZ before bull coming. However, if bull market start running, we can expect 0.6 in next year.
TP: 0.2~0.26 / 0.4~0.43 / 0.6~0.7
SL: 0.057

ALPHAUSDT - Buy Setup!!ALPHAUSDT (1D Chart) Technical analysis
ALPHAUSDT (1D Chart) Currently trading at $0.085
Buy level: Above $0.084
Stop loss: Below $0.073
TP1: $0.09
TP2: $0.1
TP3: $0.12
TP4: $0.145
Max Leverage 3x
Always keep Stop loss
Follow Our Tradingview Account for More Technical Analysis Updates, | Like, Share and Comment Your thoughts

Alpha USDT Long Entry Chats shows a bullish signBINANCE:ALPHAUSDT.P Alpha USDT
Price Break the resistance level .11276 now retest the in 1 Hr TF. Bullish Candle in 4 Hr very good bullish sign towards price more upward direction in coming hr. Price 2 times test the .12544 Level now again test this level. If price break this level or stay above this level at least 1 day then chances move upward direction. Otherwise again tested and rejected this level again.
Now we enter the .11500 level. And tp is .12511.
