NPX - My take on this shitcoin :)Thanks to @Cryptobullet for bringing this idea to life :)
I made my own analysis and conclusion is , I don't see this coin "moon", however I do see a small relif rally occur that can be profitable.
This can be a good gamble with a small-sized high-leveraged position (lose little gain much).
Volume has been drying up in the falling wedge pattern, as we get closer to the apex I'm sure we will see some kind of reaction to the upside unless this coin really goes to 0.
I have no clue about the fundamentals and/or the project it self and this soley based on the chart and what I see.
NPXS is converging on the RSI and has formed a higher baseline on the RSI while the price has continued to decline.
Times looks grim for this coin and i think it will be stagnated after we get rejected at the potential upside limitations (see my targets - 4 possible trade setups, can be used for trailing SL).
This will probably will go sideways after the profits have been locked in - until something big happens withing the project.
Good luck!
ALT

Alt-Season coming! Sit on your belt before rocket launches!!!Hello traders and guys. Looking at the chart, Crypto Total Market is yet bullish!
Total MarketCap is tested Daily EMA50 line and bouncing up from EMA50 line and probably showing Inverse H&S as you can see in my chart.
However BTC Dominance was quite huge this year 2019 and now showing Rising wedge chart pattern.
Bitcoin is the king of crypto and the safest blockchain in the world. I believe it!
But then how about alt coins? Think what happened on Binance IEO coin BNB, ChainLink(LINK) and other major alts like ETH, BCHABC, DASH, EOS.
Alts was very bloody this year but alt season will be gone forever? Will BTC only survive in Crypto market? BTC can solve everything which have to be solved in crypto world's ecosystem?
I don't think so definitely! BLockchain still needs to be applied in many parts with proper ways. and there are better approach to solve this issue. Writing this article, I am still regret why I didn't launc ICO last year with my own idea. LOL Just a joke.
So to me, if alt season can come this year, Now is the moment to invest or setup a nice swing trading in alt coins. I think alts will grow quite much while BTC consolidating for a while.
I tried to choose some alts randomly, but seriously.
1. ETH
2. BNB
3. BCH
4. DASH
5. LINK
Good enough to give it a try with good entry!
Please leave comments!

Alt season on the horizon?I'm a noob so looking for feed back.
A lot of Alts have macro falling wedge set ups.. you think this could mean BTC is in consolidation for some months to come and Alt season kicks off?

$altseason wave 4 retracement- mini alt season before a huge oneEW analsysis of BTC dominance shows that we should be in wave 4 of the last wave 5 of 5. It s synonym of mini alt season, it will be followed by a wave 5 where BTC will pump again against alts, then it will be the crash and a big one. The targets for the wave 4 are in red on the chart. I tend to think the first red line at the 23.6 retracement is the most probable as wave 3 has been in hyper extension, which is most of the time synonym of short wave 4. I would long alts now until the 1st target is reached.
Happy trading beautiful people!

Bitcoin Dominance Back to 50% is ImminentMost are now are all in Bitcoin, especially considering BTC.D growth. This is market panic, which does result in a lot of money being moved from alts to Bitcoin.
But this is exactly when smart money goes in. The market pshycology tells me, that this is perfect time for BTC.D to start reversing. Nevertheless, the it could be too early for the Alt Season to start.
I'd expect it to BEGIN at the end of this year.... or, to END by the end of this year. Soon we'll find out, but I am holding my alts long term.
Now you might ask why BTC will lose so much dominance. Well, BTC is a store of value, a long term "GOLD" investment. But, blockchain continues to develop with mass adoption on its' way. This will stimulate the growth of other chains and capital will be slowly distributed. People don't like to keep all eggs in one basket, even if this is a basket of Gold. They will buy Silver, Diamonds, Property etc simply to diversify.


ALT Coin Dominance - more room for the downside.Its good to look at ALTs and see much further for them to drop.
Looking at the weekly and daily chart, the ALTs have past a critical level and will target the bottom of this channel.
This chart has both ALTs versus BTC (%) Dominance. No words required.


Altcoin bull run Cummings Soon, Altcoin MarketCap AnalysisWe are doing Analysis of AltCoin MarketCap on 3 Day Timeframe.
I have Mention Support and resistance levels on Chart
Note: This is only for Educational Purpose this is not an Investment advice.
Please support the setup with your likes, comments and by following on Trading View.
Thanks
Adil Khan

Alt Season just started! Enjoy it :)We are doing Analysis of BTC.D on 5 Day Timeframe.
I have Mention Support and resistance levels on Chart
Note: This is only for Educational Purpose this is not an Investment advice.
Please support the setup with your likes, comments and by following on Trading View.
Thanks
Adil Khan.

soon alt season, Elliott wave analysis BTC dominanceWe may be in the middle of wave 5 in BTC dominance, at the moment probably at the beginning of wave 4 with 3-4% correction still to go. Wave 5 will be followed by a major correction, it s when alts will moon. Good luck to all and happy trading!


BTC Dominance Tailing OffWe may finally start to see money going into the alt-coins now. Providing on some factors with volume of course.
We have seen the dominance come down before but also seen Bitcoin go up a lot. a lot of people did start of panic and sold alt-coins for Bitcoin to catch the move to the upside.
If you are holding alt coins, wait for the BTC values to go back up of those holdings before selling.

Crucial pivot point : Altcoins are in trouble if no higher highComparison of a same bubble structure between the Silver bubble and the total market cap of crypto (exl. Btc)
If alts don't produce a higher high around here, then new lows are to be expected, with a slow and long decling of several years.
Of course maybe a few alt coins will probably survive this pattern and will show a more bullish pattern than shitcoins and other alt coins, but this is a very important warning, as this bubble structure is so far 100% identical.
Humans reproduce the same patterns on charts as our behaviour and nature does not change, and will never change.
I am absolutely not against Alts beeing destroyed, as a large majority of them is a cancer to this space, and the crash of the majority of alts would educate the market in the way of driving dumb speculators into bitcoin maximalists, which is not worse.
A little zoom in shows the Smma totally blocked the upmove of the altcoins market cap :
Daily shows a golden cross, but the moving averages are already pointing to the downside, so i don't exclude a bearish cross to happen.
Last note about the Silver chart that produced the exact same bottoming pattern as the Bitcoin chart of 2015:

Alts Last line of support Total alts cap broke out the ascending channel and looking for discovery below the channel. If we count the wave, then we should be nearing a bottom any time soon. We are sure everyone is surprised why the alts seems to still be in a bear market.
Some alts devs can , we can count a number of projects whose devs don't have money to run the project anymore , some devs have dissapeared and left the project to the community without enough funds to continue.
So what we might be witnessing in the next couple of months might be real capitulation. Though Ethereum is responsible for more than 90% of the alt coin sphere,which means some the alt dev exit plan might be to sell as much eth n alts as possible into bitcoin , then into fiat , which in some other theory might be the actual reason for the bitcoin pump, but then we never know .
as seen previously alts with good fundamentals should really pump hard when bitcoin starts reaccumulating at its 0.618 fib level. Watching the support and bitcoin at 0.618 fib level to see how alts react.
Now fewer newbies to trick with buzz words, it is projected some alts might not survive this season.

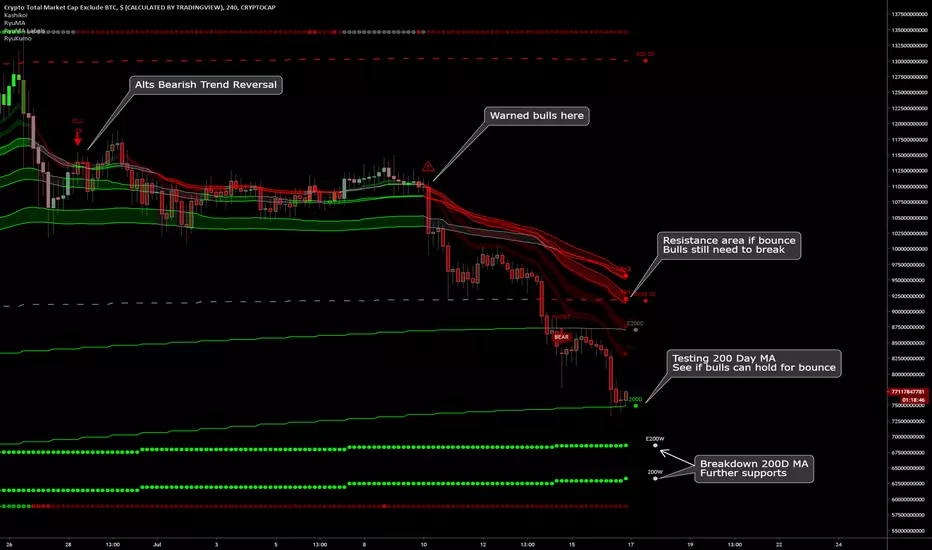
Crypto Alts Total Market Cap- Currently testing 200 Day MA
- Bulls need to bounce here
- Still resistances ahead shown
- Bears breakdown next supports shown
BTC Dominance streak ending soon? Is Alt season coming?Hi guys its Brian here. We may potentially see BTC dominating streak come to an end soon which can be a good thing for alt coins.
As you can see from the BTC dominance chart, it has been on a steady rise leading to alt coins bleeding as BTC gain dominance over them. However it is now reaching the resistance level and if it doesn't break through, then BTC dominance could go back down and let the money flow into the alt coins instead.
Looking at the way alt coin market is currently, I would say it is about time so I would keep a look out for the incoming alt season as it can be a big one seeing how low most alts have gone down.
www.brianchai.com
Free Trading Group (signals, news, price alerts & more!)

Alt coins Market Cap (With example bitcoin) from current to HighAlt coins Market Cap (With example bitcoin)
Bitcoin have same structur (Bitcoin correction or flat) Altcoins go UP in 2016.
Maybe same scenario in 2019?
Maybe we will repeat the scenario of rapid growth of altcoins. Many have already lost faith in the Altcoins. Similarly, it was with the bitcon on the price of 3000-4000. Altcoins as you know, are about 300% behind Bitcoin. I remain optimistic about the growth of altcoins.


Altcoin Bull Run Soon Btc.Dominance Comparison to Altcoin MarketWe are doing Analysis of BTCUSDT on weekly Timeframe.
Btc. Dominance Comparison to Altcoin Market Cap
I have Mention Support and resistance levels on Chart
Note: This is only for Educational Purpose this is not an Investment advice.
Please support the setup with your likes, comments and by following on Trading View.
Thanks
Adil Khan

COIN Market Cap / BTC DOMINANCE comprehensive analysisThe 2013 Chart material does not exist in the Trading View.
We analyzed it from another site.
Please check the link below.
charts.cointrader.pro
