Avalanche Potential UpsidesHey Traders, in today's trading session we are monitoring Avalanche for a buying opportunity around 19.20 zone, Avalanche is trading in an uptrend and currently is in a correction phase in which it is approaching the trend at 19.20 support and resistance area.
Trade safe, Joe.
Altcoin

Tron Potential DownsidesBINANCE:TRXUSDT
Hey Traders, in today's trading session we are monitoring Tron for a selling opportunity around 0.25 zone, Tron is trading in a downtrend and currently is in a correction phase in which it is approaching the trend at 0.25 support and resistance area.
Trade safe, Joe.

Threshold Network(T) Analysis: From Bear Trap to Bullish TrendAs long as Bitcoin ( BINANCE:BTCUSDT ) and Ethereum ( BINANCE:ETHUSDT ) are in a range, it is a good opportunity to take advantage of the movement of other tokens and take a look at their charts.
Today, I want to analyze the Threshold( BINANCE:TUSDT ) project for you, which has increased by +70% .
What Is the Threshold Network?
Threshold Network is a decentralized protocol that combines cryptography and privacy to power secure, permissionless applications. It enables users to protect their digital assets through threshold cryptography—where no single party has full control—supporting use cases like private key custody, privacy-preserving smart contracts, and tokenized Bitcoin on Ethereum (via tBTC).
Reasons for Price Increase:
Token Buybacks : Threshold Network is actively buying back T tokens from the market, potentially increasing demand and positively impacting the token's price.
Halting Treasury Sales : The project has stopped selling T tokens from its treasury, signaling confidence in the token's future value and reducing potential market supply.
BitcoinWorld
Reducing Operational Expenses : By streamlining operations to save costs, the project aims for long-term sustainability in the volatile crypto landscape.
-----------------------------------------------------
Technical Analysis:
Now let's take a look at the Threshold(T) chart on the Daily timeframe .
Can we still take advantage of the increase in the price of T Token or not!? Please Stay with me.
The Threshold(T) project is moving near the Heavy Support zone($0.0189-$0.0147) and has managed to break the Resistance lines with a high-volume candle , which could be good news for the continuation of the T token's bullish trend .
The Threshold(T) Project also created a Bear Trap , which basically moves in the opposite direction of the Trap after traps on the price chart with high momentum , which is what happened here as well.
In terms of Elliott Wave theory , the T token is currently completing 5 impulsive waves after completing a Zigzag Correction(ABC/5-3-5) , which seems like we should wait for the main wave 4 and then a re-increase .
I expect the T token to start rising again from the Potential Reversal Zone(PRZ) and give us at least +30% profit opportunity .
Note: If the T token goes below $0.016, we should expect further decline and possibly a break of the Heavy Support zone($0.0189-$0.0147).
Please respect each other's ideas and express them politely if you agree or disagree.
Threshold Analyze (TUSDT), Daily time frame.
Be sure to follow the updated ideas.
Do not forget to put a Stop loss for your positions (For every position you want to open).
Please follow your strategy and updates; this is just my Idea, and I will gladly see your ideas in this post.
Please do not forget the ✅' like '✅ button 🙏😊 & Share it with your friends; thanks, and Trade safe.

BTC.D Wave 5 is formingWe are now in the final wave of the btc.d market share
The black V wave is in the final stage
In my opinion, btc.d is in the red wave 4 and is expected to have another red uptrend to complete 5 waves and at the same time, it will also have 5 black V waves
If all the waves are complete, we will have a btc.d break and the altcoin season will take place
We can see that altcoin is at the bottom and is recovering, this uptrend is likely to increase (because btc.d is decreasing wave 4) then btc.d goes up to the red wave 5 as analyzed above, the altcoin will test the possible double bottom pattern (with some strong coins that can slightly recover to the 50% fibonacci and then go up)
to go up, the weaker ones can have triple bottoms
Anyway, we are at the end of btc.d and it is also the altcoin season that is about to begin

After a -90% Dump, MANTRA(OM) Finds Support!!!Today, I want to analyze the MANTRA ( BINANCE:OMUSDT ) projec t for you, which fell by more than -90% on April 13 .
What is MANTRA(OM)?
MANTRA (OM) is a DeFi + RWA (Real World Assets) focused project aiming to bring real-world assets like real estate and bonds on-chain. Built with the Cosmos SDK, it’s developing a purpose-built layer-1 chain to facilitate tokenization and institutional adoption of RWAs.
The main crash reasons:
Massive forced liquidations on exchanges
90% of the token supply reportedly held in a single wallet
Rumors of a rug pull (which the team denied)
Team Response:
MANTRA’s team has launched an internal investigation
Plans for buybacks and token burns are underway
They reassured the community that team tokens remain locked and untouched
-----------------------------------
Technical Analysis:
Now let's take a look at the MANTRA(OM) chart on the 1-hour timeframe .
After the fall on April 13, MANTRA(OM) reacted to the Heavy Support zone($0.45-$0.20) and started to rise again (upward correction) .
From the perspective of Elliott Wave theory , MANTRA(OM)'s big fall can be considered as a main wave 3 , and it seems that MANTRA(OM) is completing a main wave 4 . The main wave 4 could be a Double Three Correction(WXY) . Since the momentum of the main wave 3 was high, there is a possibility that main wave 5 will be a Truncated type .
I expect MANTRA(OM) to start rising from the Potential Reversal Zone(PRZ) and rise to at least $0.76(+30%) ( First Target ) and then attack the Resistance zone($1.10-$0.84) ( Second Target(+60%) ).
Do you think the MANTRA(OM) project can return to its good days?
Note: If the MANTRA(OM) falls below $0.500(Round Number), we can expect further declines.
Please respect each other's ideas and express them politely if you agree or disagree.
MANTRA Analyze (OMUSDT), 1-hour time frame.
Be sure to follow the updated ideas.
Do not forget to put a Stop loss for your positions (For every position you want to open).
Please follow your strategy and updates; this is just my Idea, and I will gladly see your ideas in this post.
Please do not forget the ✅' like '✅ button 🙏😊 & Share it with your friends; thanks, and Trade safe.

ALTSEASON | ALTS | BUY Zones SummaryOver the past few weeks I've been gradually analyzing the alts that I believe have great potential for the next cycle.
These include:
✅ ATOM
✅ Litecoin
✅ Fantom
✅ Doge
✅ SUI
✅ SHIB
✅ DOT
✅ PEPE
✅ BNB
✅ Tron
✅ The Graph
✅ Render
✅ Maker
✅ AAVE
Here's your quick video summary on ideal buying zones for the above altcoins. Enjoy!
____________________________

Still Have a Chance in This Sideways MarketPrice is currently moving within a wide sideways range between 2.670 – 4.000, which is roughly a 50% price fluctuation—still a tradable range if we can identify key reversal zones and market structure.
From the structure, we can see that BINANCE:ORCAUSDT has broken the previous high and formed a Higher High (HH)—a sign of strong buying momentum. This shift suggests that the support zone around 3.164 – 3.073 could hold and prevent the price from falling back to the bottom of the range at 2.670.
If the price revisits the support area (3.164 – 3.073), we can wait for bullish confirmation candles before entering. The potential upside target would be in the 3.862 – 4.000 zone.
Additional Notes:
Watch for signs of Higher Low (HL) confirmation around support
If HL forms successfully, this could be a base for continuation to the upper range

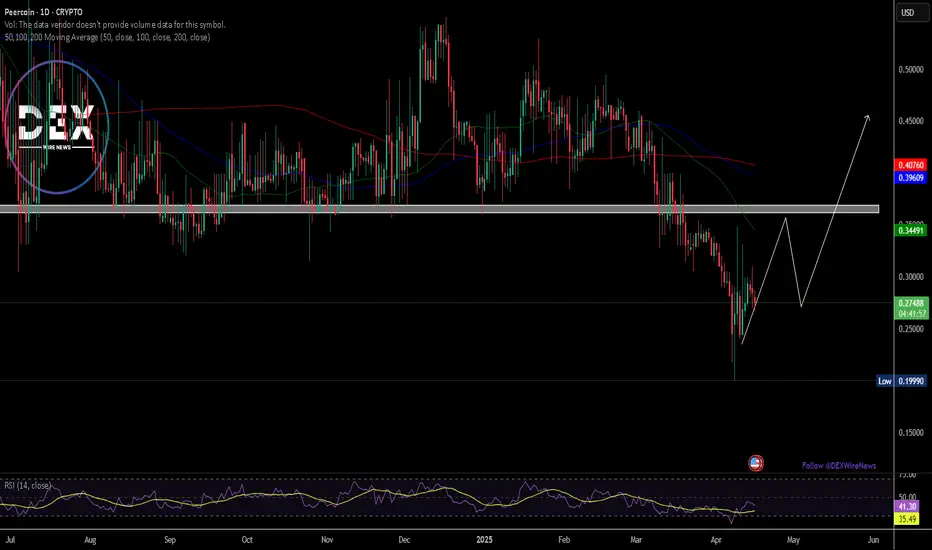
Breaking: Peercoin ($PPC) Coin Might Be Gearing For A ReversalPeercoin ( NASDAQ:PPC ) an altcoin created 2012 has since been mute for over 5 years.
Also known as PPC or Peer-to-Peer Coin, the coin was created by Sunny King and his team and launched in August 2012. It is the first blockchain to implement Proof-of-Stake consensus.
The primary inspiration behind the creation of Peercoin was to address a number of perceived shortcomings of Bitcoin, including energy efficiency, security and sustainability, decentralization and long-term viability.
Essentially it was designed as an enhanced replacement for Bitcoin. As such, it was originally forked from Bitcoin and uses the same UTXO style blockchain. However, Peercoin's code was modified to introduce Proof-of-Stake as its primary consensus protocol.
Peercoin's daily price chart depicts a perfectly formed resistant structure, should NASDAQ:PPC break above the $0.36 resistant point, a breakout to the $1 pivot is feasible. Similarly, failure to pull that stunt might negate the assets growth.
Peercoin Price Metric
The Peercoin price today is $0.277113 USD with a 24-hour trading volume of $27,510.89 USD. Peercoin is down 5.39% in the last 24 hours. The current CoinMarketCap ranking is #1053, with a market cap of $8,175,841 USD. It has a circulating supply of 29,503,607 PPC coins and the max. supply is not available.
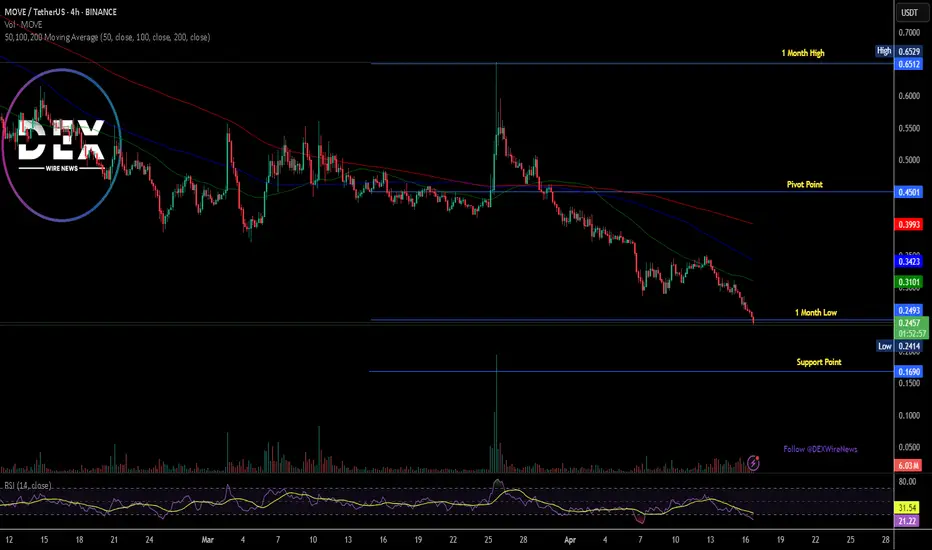
Breaking: Movement Token ($MOVE) Dips 12% TodayThe price of Movement coin ( TVC:MOVE ) nosedived 12% today, leading to a bearish pennant.
The ecosystem of Modular Move-Based Blockchains that enables developers to build secure, performant, and interoperable blockchain applications, bridging the gap between Move and EVM ecosystems has experience immense selling pressure today albeit the general crypto industry was also in a state of turmoil with CRYPTOCAP:BTC losing its $85k grip now down to $83k.
The first Move-EVM L2 for Ethereum has not being exempted, as hinted by the RSI at 20.64, TVC:MOVE has long being oversold with the asset moving around the 1-month low axis and a break below that axis could be dire for TVC:MOVE token.
Similarly, a break above the 50% Fibonacci retracement point could resort to a bullish reversal for Movement token ( TVC:MOVE ).
Movement Price Data
The Movement price today is $0.251764 USD with a 24-hour trading volume of $104,973,849 USD. Movement is down 10.27% in the last 24 hours. The current CoinMarketCap ranking is #87, with a live market cap of $616,822,310 USD. It has a circulating supply of 2,450,000,000 TVC:MOVE coins and a max. supply of 10,000,000,000 MOVE coins.
SOL - Longs on the Horizon!Hello TradingView Family / Fellow Traders. This is Richard, also known as theSignalyst.
📈 Medium-Term : SOL has been overall bearish and it is currently trading within the flat wedge pattern marked in red.
📍 As it retests the lower bound of the wedge — which perfectly intersects with the $100 round number — I’ll be looking for short-term longs.
🚀 In parallel, for the bulls to take over in the long term and kick off the next bullish phase, a breakout above the $147 previous daily high is needed.
Which scenario do you think will happen first — and why?
📚 Always follow your trading plan regarding entry, risk management, and trade management.
Good luck!
All Strategies Are Good; If Managed Properly!
~Rich

Breaking: Despite Binance Delisting $AERGO The Coin Spiked 730% The well known crypto exchange Binance has released on her X page that they would be delisting about 5 tokens of which $AERGO happens to be one of them claiming they don't follow industry standards, despite being listed on top CEX like Coinbase, Upbit, etc.
Binance delisted $AERGO late March, 2025, however, the event took a deja vu as $AERGO has been surging consecutively for over 2 weeks now breaking out of a falling wedge pattern, equating to 730% ROI so far so good despite the delisting campaign by Binance.
While the asset is up 14% as of the time of writing, $AERGO is currently overbought with the RSI of 75, we may experience a cool-off. Regardless, $AERGO is sitting on $194+ million market cap is feasible for a trend continuation.
What is Aergo?
Aergo describes itself as an open-source enterprise blockchain platform optimized for hybrid deployments, which consist of both permissioned and permissionless blockchain architectures. It includes support for SQL allowing for easy data handling and familiar smart contract programming for developers.
The platform is built and utilized by Blocko, the Samsung-backed South Korean blockchain technology company that, according to Korean media sources, has deployed production blockchain solutions for large-scale clients including Lotte Card, Shinhan Bank, Korea Exchange, Hyundai Motors, and more.
Aergo Price Metric
The live Aergo price today is $0.419087 USD with a 24-hour trading volume of $518,508,512 USD. The current CoinMarketCap ranking is #177, with a market cap of $200,113,830 USD. It has a circulating supply of 477,499,996 AERGO coins and a max. supply of 500,000,000 AERGO coins.

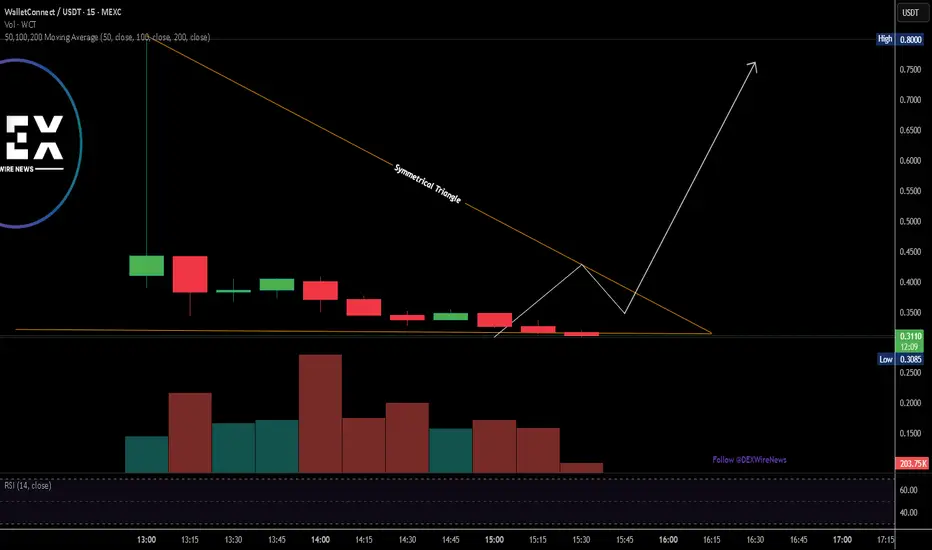
Breaking: The Wallet Connect Token $WCT Got Listed On ExchangesWallet Connect a platfrom known to be a mediator or connector to crypto wallets like metamask, Trustwallet, Phantom, etc., got listed on Binance, Bybit, OKX, and so many major exchanges today.
The asset saw an 80% uptick in price prior data from Binance feeds. while presently down to $0.32, the 15-minute price chart depicts a symmetrical triangle pattern and a breakout above the ceiling could cement the grounds for a $1 move.
While sitting on a market cap of $58.86M, NASDAQ:WCT is well feasible to bridged the the $1 resistant zone. For now, all eyes are set on the breakout of the symmetrical triangle pattern.
With the asset testing weak hands, NASDAQ:WCT could be on a cusp of a breakout.
What is WalletConnect and the WalletConnect Token ( NASDAQ:WCT )?
The WalletConnect Network is the onchain UX ecosystem powering 150 million connections for over 23 million users across 600 wallets, 40K app projects, and all chains. It is the open and decentralized network that enables users to connect to apps onchain, designed for both utility and ownership without compromises. The WalletConnect Token (WCT) is integral to the WalletConnect Network — fueling the onchain UX ecosystem by empowering its community of users, apps, and wallets to contribute to a better onchain future through shared incentives. Launching on Optimism’s OP Mainnet, the token will employ Ethereum’s security and OP Mainnet’s speed.
Yellow Ket Gearing For A Breakout Amidst Symmetrical Triangleyellow ket coin ($KET) a token created under the Avax ecosystem is set for a breakout move amidst a symmetrical triangle pattern on the 4-hour price chart.
Should the asset break from the Ceiling of the symmetrical triangle, a bullish campaign will be materialise with a 100% surge in sight albeit $KET has to be listed on major exchanges to fuel the hype of the memecoin.
Similarly, on a bearish scenario, a break below the symmetrical triangle could also send $KET to a nosedive- leading to a selling spree.
About yellow ket
YellowCatDAO sets itself apart by integrating cutting-edge AI-driven trading mechanisms with a community-centered governance model. At its core, the project leverages an AI agent capable of executing trades across multiple blockchain networks, making it a pioneer in cross-chain AI trading. Unlike typical trading bots, this AI agent not only focuses on profitability but also strategically reinvests gains into the project’s treasury to ensure sustainable growth and support ongoing initiatives.
yellow ket Metric
The live yellow ket price today is $0.184953 USD with a 24-hour trading volume of $5,874,478 USD. Yellow ket is down 3.78% in the last 24 hours, with a market cap of not available. The circulating supply is not available and the max. supply is not available.

LTO - Two Potential Longs!Hello TradingView Family / Fellow Traders. This is Richard, also known as theSignalyst.
📚 LTO has been rejecting a massive weekly support and the key $0.02 round number.
🛡️ As long as this level holds, I'm eyeing a potential 5x move towards the upper bound of the falling channel and the $0.10 round number.
🚀 From a macro perspective, a break above $0.10 could trigger a continuation towards $0.30 — unlocking major upside potential!
📚 Always follow your trading plan regarding entry, risk management, and trade management.
Good luck!
All Strategies Are Good; If Managed Properly!
~Rich

bnb sell midterm "🌟 Welcome to Golden Candle! 🌟
We're a team of 📈 passionate traders 📉 who love sharing our 🔍 technical analysis insights 🔎 with the TradingView community. 🌎
Our goal is to provide 💡 valuable perspectives 💡 on market trends and patterns, but 🚫 please note that our analyses are not intended as buy or sell recommendations. 🚫
Instead, they reflect our own 💭 personal attitudes and thoughts. 💭
Follow along and 📚 learn 📚 from our analyses! 📊💡"


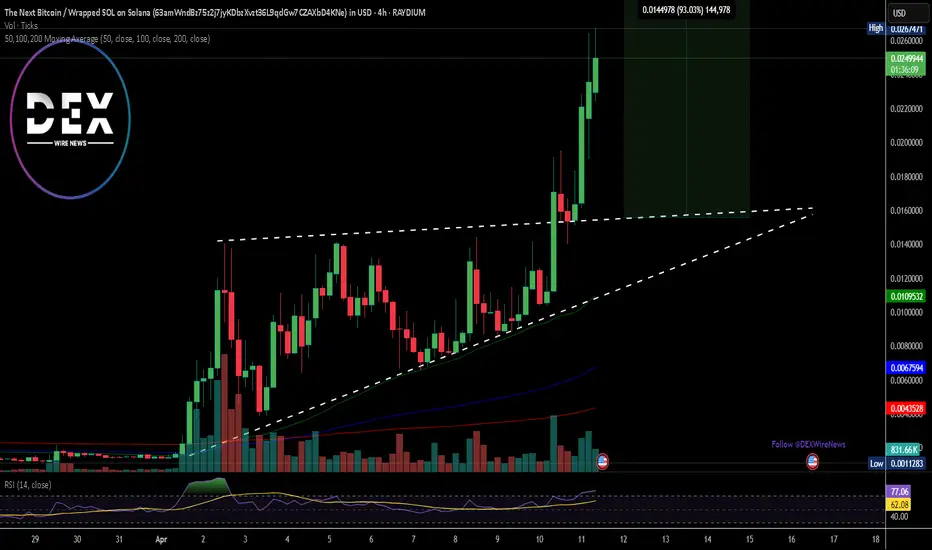
Breaking: $BUTTCOIN Spikes 50% Gearing Up For 100% Surge The price of "The Next Bitcoin" ($Buttcoin) broke out of a bullish symmetrical triangle pattern soaring 50% and setting sail for 100% voyage amidst build-up momentum and increase hype.
Based on the 4-hours time chart, the asset broke out of a presumed symmetrical triangle pattern albeit the crypto market was overall consolidating yesterday.
The 4-hour price chart depicts a typical three white crow pattern, a pattern generally seen as a continuation of a current trend with ($BUTTCON) gearing up for a 100% surge as hinted by the Relative Strength Index (RSI) at 77.
What is The Next Bitcoin?
Buttcoin (BUTTCOIN) is a playful twist on the cryptocurrency landscape, embodying the spirit of a meme while functioning as a real token. Launched on January 30, 2025, on Pump.fun, it’s a community-driven memecoin on the Solana blockchain. The concept was inspired by a humorous 2013 YouTube video by James D. McMurray, which satirized Bitcoin's complexities and introduced Buttcoin as a simpler alternative.
The Next Bitcoin Price Live Data
The live The Next Bitcoin price today is $0.024262 USD with a 24-hour trading volume of $14,482,140 USD. The Next Bitcoin is up 50.31% in the last 24 hours, with a live market cap of $24,241,574 USD. It has a circulating supply of 999,151,679 BUTTCOIN coins and a max. supply of 1,000,000,000 BUTTCOIN coins.
CRO - Building Block!Hello TradingView Family / Fellow Traders. This is Richard, also known as theSignalyst.
Let’s keep it simple!
📈 Short-Term Bullish:
CRO is currently hovering around a key weekly support level. As long as the $0.07 support holds, we can look for short-term long opportunities.
With bullish momentum picking up, the next target/resistance is around $0.11 (marked in blue).
🚀 Long-Term Bullish:
For the bulls to fully take control and aim for the next major resistance at $0.163 (marked in red), a confirmed breakout above the $0.115 level is needed.
📚 Always follow your trading plan regarding entry, risk management, and trade management.
Good luck!
All Strategies Are Good; If Managed Properly!
~Rich

Bitcoin Prediction - Crypto MarketBitcoin has broken the weekly structure to the downside, and we’ve been bearish since then.
However, the monthly chart still looks bullish, and I expect the price to return to the monthly demand zone and get a reaction from there.
I believe the crypto market could turn bullish again by the end of summer 2025.
Possible scenario:
We short from the current levels down to the monthly demand zone, sweeping the engineered weekly liquidity (by 'engineered,' I mean a level designed to push price higher). That level is around $67,000.
I’ll be watching for LTF confirmations to take longs from that zone.
Most likely, the monthly demand zone will hold and send us toward new all-time highs.

TradeCityPro | BTC.D: Predicting Alt Seasons with Bitcoin Domina👋 Welcome to TradeCity Pro!
In this analysis, I want to discuss an important crypto index that can significantly impact our trading, known as BTC.D. First, I'll provide some explanations for those unfamiliar with this index, and then we'll dive into the analysis.
🤔 What is Bitcoin Dominance?
Bitcoin Dominance is a major indicator in the crypto market. It does not directly represent supply and demand and is not tradable; the chart you see is calculated by TradingView and does not exist physically.
⚡️ This index represents the strength of Bitcoin in the crypto market. It shows the amount of money in Bitcoin divided by the total money in the crypto market.
100x(Bitcoin MarketCap / Total MarketCap) = Bitcoin Dominance
✔️ For example, if the total money in crypto is 1 trillion dollars and 500 billion dollars of that is in Bitcoin, then Bitcoin's dominance would be 50%.
✔️ Or, if the total money in crypto is 1 trillion dollars and 300 billion dollars of that is in Bitcoin, then Bitcoin's dominance would be 30%.
Now that we know what Bitcoin dominance is and how it is calculated, let's see how it can help us in trading and where it can be useful.
🤔 How is Bitcoin Dominance useful?
When we trade, we often encounter situations where both Bitcoin and an altcoin (for example, Ethereum) are triggered simultaneously according to our strategy. There are several ways we can open positions in these situations. Some open positions simultaneously on both, increasing the risk of the trade and doubling the potential loss if the market moves against us. Others may randomly choose between the two positions, which could result in taking a position on Bitcoin and hitting a stop-loss while Ethereum moves towards your target. But how can we determine which one is likely to be more profitable?
🔹 As mentioned, Bitcoin dominance indicates the strength of Bitcoin relative to the rest of the market, and there are three scenarios to consider for its analysis.
📈 In the first scenario, if the market is bullish, Bitcoin dominance can be bullish, bearish, or range-bound. If Bitcoin dominance is bullish, it means more money is entering Bitcoin, so if both Bitcoin and Ethereum are triggered simultaneously, Bitcoin is likely to rise more than Ethereum. If Bitcoin dominance is bearish, less money is entering Bitcoin relative to altcoins, so altcoins like Ethereum are likely to rise more. If Bitcoin dominance is range-bound, we analyze the market candle by candle and pay more attention to short-term momentum, deciding based on the current trend of Bitcoin dominance.
📉 In the second scenario, if the market is bearish, Bitcoin dominance can again be bullish, bearish, or range-bound.
✔️ Before explaining this scenario, let me tell you how it's possible for the market to be bearish while Bitcoin dominance increases even though Bitcoin's price is also falling. As I mentioned, Bitcoin dominance is a ratio and is shown in percentage terms, so if the market is crashing, it might be that Bitcoin is selling less than altcoins. For example, Bitcoin might sell for 10 million dollars and altcoins for 20 million dollars. Even though Bitcoin is being sold and its price is falling, it is being sold less than altcoins, so its dominance increases.
🔹 Now, let's examine the second scenario. If Bitcoin dominance is bullish, less Bitcoin is being sold compared to altcoins, so altcoins like Ethereum will have a greater drop and are better for short positions. If Bitcoin dominance is bearish, Bitcoin is being sold more than altcoins, so a short position on Bitcoin would be more suitable. Lastly, if Bitcoin dominance is range-bound, like in the first scenario, we analyze candle by candle and focus on short-term momentum.
📊 In the third scenario, if the market is range-bound, I first suggest not opening any positions because many strategies do not work well in range-bound markets, and it's better to wait for a breakout of the range's floor or ceiling before opening a position. However, if you do decide to open a position in this phase, short positions fall under the second scenario, and long positions fall under the first.
⭐ So, with Bitcoin dominance, we can optimize the positions we open and choose the best option between Bitcoin and the selected altcoin. If we look at Bitcoin dominance in higher time frames and not just as a confirmation for futures positions in lower time frames, we can identify alt seasons.
🤔 How to identify alt seasons and alt parties with Bitcoin Dominance?
So far, we've seen how dominance in different states and positions can help us in trading. Now, if we analyze Bitcoin dominance over a longer term, we can determine whether the money in the market will move more towards altcoins or Bitcoin in the coming weeks or months.
✔️ For example, if Bitcoin dominance is bullish in the weekly time frame and has a strong upward trend, naturally, more money will enter Bitcoin over time, making Bitcoin a better investment than altcoins. However, if Bitcoin dominance undergoes a correction for a few days or weeks during this bullish trend, altcoins can experience significant growth during that short time frame, which we call an alt party.
💥 On the other hand, if Bitcoin dominance completely changes trend and is bearish for several weeks or months, altcoins will naturally grow much more and will be a better investment option until Bitcoin dominance turns bullish again, which we call an alt season.
🔹 An important note about alt seasons is that Bitcoin's trend during this time must be bullish or range-bound; if Bitcoin is bearish, neither an alt season nor an alt party will occur. So, be sure to first understand the overall market trend using indicators like Total and Total2, and then look for an alt party.
Now that we've examined how this index works, let's move on to a technical analysis of the chart.
📅 Monthly Time Frame
As you can see in the monthly time frame, Bitcoin dominance had a very long range above the 95% area between 2015-2017, which was because the crypto market was still very small at that time, and many investors thought it was a scam. Thus, if anyone wanted to invest in crypto, they only bought Bitcoin.
✨ But in 2017, during Bitcoin's bull run when it reached the 20k ceiling, altcoins also entered the game, and Bitcoin dominance began to fall, spreading the crypto money among other coins. This downward movement continued down to the 40% area, and after it consolidated around this area, Bitcoin dominance started rising again, correcting the severe downturn it had experienced.
🔍 At the start of the next bull run in late 2020, Bitcoin dominance reached its peak and formed a range between 57.13 and 71.04 until the end of the bull run. After Bitcoin's bull run, in the second leg when the price moved towards the 69k area, Bitcoin dominance broke the 57.13 support and moved down to the 40% support, leading to a major alt season.
🎲 In early 2023, coinciding with the start of Bitcoin's bullish trend from the 16k bottom, Bitcoin dominance broke the 47.80 area, which was the ceiling of its box, and its upward movement restarted. Currently, Bitcoin dominance has also broken the 57.13 area and is near 64%. As long as Bitcoin dominance remains bullish, Bitcoin will still be a better buy, and altcoins will not be able to grow significantly.
💥 If Bitcoin dominance finally confirms a trend change and turns bearish, if Bitcoin's trend remains bullish, we will witness another major alt season like in 2021. For now, we confirm the change in trend in Bitcoin dominance on the monthly chart by breaking 57.13, and for a better and more accurate analysis, it's better to move on to the weekly time frame.
📅 Weekly Time Frame
In the weekly time frame, after breaking the 47.46 area, an ascending trend has formed within an ascending channel, and the price has been in this channel for about two years.
🧩 The next resistance for Bitcoin dominance is 65.59, which it is moving towards, and the main ceiling for Bitcoin dominance is 71.04. If the upward trend continues, more money will enter Bitcoin, and altcoins will not be good investment options.
🔽 For a trend change and a bearish turn in Bitcoin dominance, breaking the 60.50 area is suitable, and if Bitcoin dominance records lower highs and lows below this area, we will confirm the trend change. Breaking the channel will also be one of the most important confirmations.
📅 Daily Time Frame
In the daily time frame, we can analyze the price movement with more detail.
💫 Currently, the 62.23 area has been broken, and Bitcoin dominance is performing another bullish leg, having reached the channel ceiling. If the channel ceiling breaks, we can expect a move to the 65.59 area.
📉 For a trend change in this time frame, it's better to wait for the channel to break, but besides the channel, the 62.23 and 60.50 areas are also significant, and breaking them will confirm it.
📝 Final Thoughts
This analysis reflects our opinions and is not financial advice.
Share your thoughts in the comments, and don’t forget to share this analysis with your friends! ❤️

Breaking: $PTGC Coin Set For 700% Surge Amidst Market BloodbathCreated and deployed on the Pulsechain, $PTGC is set for a 700% surge as it is gearing up to break out from a falling wedge pattern. The altcoin has already formed a solid support point for a reversal and with the RSI at 39.90, this proffers more room for a trend reversal.
While the general crypto landscape is in a blood bath, $PTGC stand out to be different as technical charts hints at an impending breakout with 700% surge in sight.
Trading below key moving averages, and momentum brewing should the crypto market stabilize , this altcoin might be the next big play as there isn't any CEX listings yet but already sitting on a market cap above $50 million.
What is The Grays Currency about?
The Grays Currency is the first truly decentralized DAO on Pulse Chain. It allows users to collect rewards simply by holding, with the option to earn double the rewards by staking without any time lock.

Ethereum (ETH) Forecast with NEoWave1M Cash Data Chart
Based on the price size of wave-B, it appears that a flat pattern with a regular wave-B is forming. In this pattern, wave -C typically retraces the entirety of wave -B, though a flat with a C-failure may occur at times.
Our primary scenario suggests that wave -C could conclude within the 1000–1200 range, indicating a flat with a C -failure. However, if the price breaks strongly through the 1000–1200 range and consolidates below this level, wave-C might extend to the 700–807 range.

Just In: $CORE Surges 15% Becoming The Top Performing AltcoinAlbeit the bloodbath besieging the crypto market, one asset stood tall defying market odds surging 15% today with about 86.58% increase in 24 hours volume. "CORE" or Satoshi Core is a L1 blockchain that is compatible with Ethereum Virtual Machine (EVM), therefore it can run Ethereum smart contracts and decentralized applications (dApps).
With increased volatility today, MIL:CORE stood different surging 15%. The asset still has room for a continuation trend as hinted by the RSI at 59.
In the case of cool-off, the 38.2% Fibonacci retracement level is a suitable point for consolidation further selling pressure could push it lower to the 1-month low axis. Similarly, should MIL:CORE break above the 1-month high pivot, the $1 resistant will be feasible, therefore, attainable.
Core Price Live Data
The live Core price today is $0.476759 USD with a 24-hour trading volume of $71,813,902 USD. Core is up 13.98% in the last 24 hours, with a live market cap of $476,107,555 USD. It has a circulating supply of 998,633,921 CORE coins and a max. supply of 2,100,000,000 CORE coins.
