BTC - 1H Clean Liquidity Hunt & Bearish Continuation BINANCE:BTCUSDT - 1H Update
Bitcoin remains in a bearish trend on the 4H and daily timeframes. After hunting the liquidity above the resistance zone, price began to drop exactly from our shared short entry at 83,700—and it's now on the move toward deeper targets.
🔹 Key Insights:
BTC grabbed liquidity just above resistance before reversing.
Price is now likely heading toward the liquidation zone below the support, aligning with the broader downtrend.
This setup offered a perfect short opportunity from $83,700, with clearly defined targets and risk.
🎯 Last Target: 80,200
💡 Congrats to all who followed our signal! The move is unfolding as expected.
📊 Stay locked in for the next big setups—follow for precise, real-time trade ideas! 🔔
Altcoin

Breaking: Aavegotchi ($GHST) Coin Gearing Up for 100% SurgeBuild and integrated into the Ethereum chain, Aavegotchi ( OTC:GHST ) Coin is setting the stage for a for 100% rally amidst breaking out of a Falling Wedge.
After losing about 50% of market value as per February 3rd, 2025 last month, Aavegotchi ( OTC:GHST ) Coin regained momentum surging 30% for the past 24 hours. The asset is simultaneously forming a support point and also gearing for the next leg up.
With the Relative Strength Index (RSI) at 67.77, Aavegotchi ( OTC:GHST ) Coin is well position for a continuation of current trend.
What Is Aavegotchi (GHST)?
Aavegotchi ( OTC:GHST ) is the governance token of the Aavegotchi NFT Gaming protocol. GHST token holders receive voting power in the AavegotchiDAO, which oversees all aspects of the protocol, Aavegotchi’s flagship game the Gotchiverse, and Aavegotchi NFTs.
Aavegotchis themselves are pixelated ghosts backed by the ERC-721 token standard. The Aavegotchi NFTs have dynamic metadata that changes over time through user interaction.
Aavegotchi Price Live Data
The live Aavegotchi price today is $0.583848 USD with a 24-hour trading volume of $14,186,737 USD. Aavegotchi is down 1.77% in the last 24 hours, with a live market cap of $30,796,717 USD. It has a circulating supply of 52,747,801 GHST coins and the max. supply is not available.

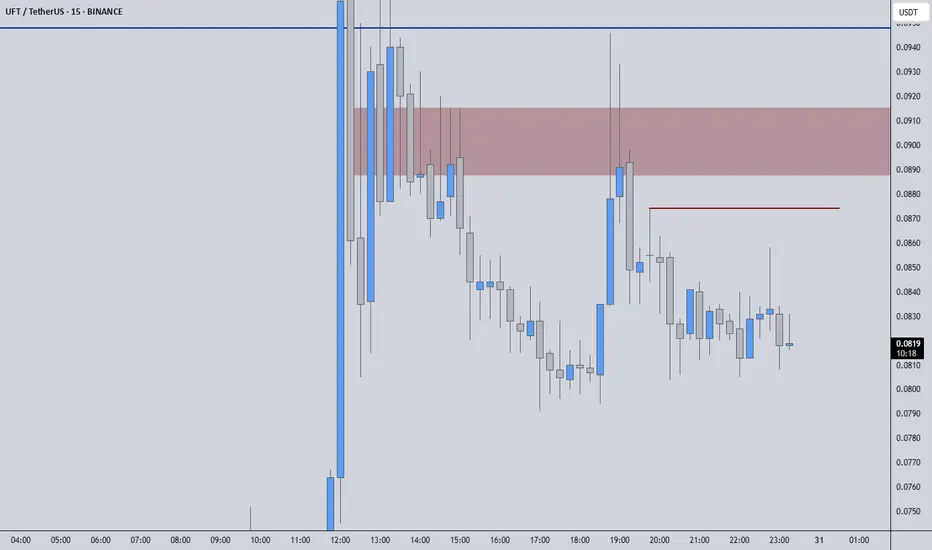
UFTUSDT – High-Precision Short Opportunities!UFTUSDT has faced a sharp decline, confirming the accuracy of our pre-identified key levels. Now, we focus on the red box and red line as prime shorting zones. This is not guesswork—these levels are carefully selected using Volume Footprint & Time Price Opportunities, tools that most traders don’t even understand.
🔥 Key Trading Strategy:
✅ Red Box & Above Red Line = Short Opportunities
These areas have historically acted as strong resistance, and without a breakout with volume, they are ideal for potential reversals.
✅ Risk Tolerance Matters
For a more conservative approach, wait for a rejection at resistance. If you prefer more aggressive entries, every downward breakout from key levels could be an additional opportunity.
✅ Confirmation is Everything
Blind entries are amateur moves. Every position should be backed by CDV analysis, volume profile validation, and LTF breakdowns. That’s how professionals trade.
📌 Why My Analysis Stands Out
This is not just charting, it’s high-level trading backed by data and years of expertise. My levels are not random lines; they are calculated, tested, and used with high precision. You can check my high success rate from my profile. Most traders don’t have access to these techniques, and that’s why they struggle.
Don’t trade like the crowd, trade with an edge. Follow the plan, follow the data, and dominate the market.
📌I keep my charts clean and simple because I believe clarity leads to better decisions.
📌My approach is built on years of experience and a solid track record. I don’t claim to know it all but I’m confident in my ability to spot high-probability setups.
📌If you would like to learn how to use the heatmap, cumulative volume delta and volume footprint techniques that I use below to determine very accurate demand regions, you can send me a private message. I help anyone who wants it completely free of charge.
🔑I have a long list of my proven technique below:
🎯 ZENUSDT.P: Patience & Profitability | %230 Reaction from the Sniper Entry
🐶 DOGEUSDT.P: Next Move
🎨 RENDERUSDT.P: Opportunity of the Month
💎 ETHUSDT.P: Where to Retrace
🟢 BNBUSDT.P: Potential Surge
📊 BTC Dominance: Reaction Zone
🌊 WAVESUSDT.P: Demand Zone Potential
🟣 UNIUSDT.P: Long-Term Trade
🔵 XRPUSDT.P: Entry Zones
🔗 LINKUSDT.P: Follow The River
📈 BTCUSDT.P: Two Key Demand Zones
🟩 POLUSDT: Bullish Momentum
🌟 PENDLEUSDT.P: Where Opportunity Meets Precision
🔥 BTCUSDT.P: Liquidation of Highly Leveraged Longs
🌊 SOLUSDT.P: SOL's Dip - Your Opportunity
🐸 1000PEPEUSDT.P: Prime Bounce Zone Unlocked
🚀 ETHUSDT.P: Set to Explode - Don't Miss This Game Changer
🤖 IQUSDT: Smart Plan
⚡️ PONDUSDT: A Trade Not Taken Is Better Than a Losing One
💼 STMXUSDT: 2 Buying Areas
🐢 TURBOUSDT: Buy Zones and Buyer Presence
🌍 ICPUSDT.P: Massive Upside Potential | Check the Trade Update For Seeing Results
🟠 IDEXUSDT: Spot Buy Area | %26 Profit if You Trade with MSB
📌 USUALUSDT: Buyers Are Active + %70 Profit in Total
🌟 FORTHUSDT: Sniper Entry +%26 Reaction
🐳 QKCUSDT: Sniper Entry +%57 Reaction
📊 BTC.D: Retest of Key Area Highly Likely
📊 XNOUSDT %80 Reaction with a Simple Blue Box!
📊 BELUSDT Amazing %120 Reaction!
I stopped adding to the list because it's kinda tiring to add 5-10 charts in every move but you can check my profile and see that it goes on..
ALT Market cap - Dip before 3TThe Crypto Total Market Cap Excluding BTC (CRYPTOCAP) is currently testing a critical support zone at the 21-month Simple Moving Average (SMA). Historically, this moving average has acted as a strong dynamic support, marking significant market reversals and uptrends.
✅ Price is bouncing off the 21 SMA, similar to previous bull market cycles.
✅ The recent correction appears to be a healthy retest of support rather than a trend reversal.
✅ The formation of higher lows suggests bullish momentum building up.
✅ If price holds above this level, we could see a strong rally in altcoins, pushing the total market cap higher.
A successful bounce from the 21 SMA could trigger a bullish continuation, leading to a market expansion toward 1.6T - 2.3T levels in the coming months.
🔸 A monthly close below the 21 SMA could invalidate this setup, leading to a deeper correction.
🔸 Key support zone to watch: $900B - $950B
🔸 Breakout confirmation: Monthly close above $1.1T
If history repeats, this could be the perfect accumulation zone before the next major altcoin season! Keep an eye on the monthly close and volume confirmation for the next big move.
Follow our TradingView account for more technical analysis updates. | Like, share, and comment your thoughts.
Cheers
GreenCrypto

Market Moves & Token Trends – Analysis with Me!Hi everyone, I hope you're all having a fantastic weekend!
To receive a token analysis , please follow the format below and leave your request in the comment section:
Example:
Project Name: Bitcoin
Token Symbol: BTC
Important Notes:
I will analyze a maximum of 20 tokens.
Each follower is allowed to submit one analysis request.
Once submitted , your token analysis will be shared directly below your comment .
Looking forward to your requests! 😊
If you found this helpful, please hit the ✅ Like Button ✅ (It fuels my energy) 💪 and Share it with your friends! Let’s grow together! 🙏😊
Wishing you health, wealth, and success! 🚀💸

XRP in BIG TROUBLE | BearishXRP is known as the "PUMP and DUMP" alt for a reason.
If you look at this chart from the macro timeframe, it clearly shows how XRP dumps hard after every parabolic increase - and this isn't even the entire price history..
The lower highs and lower lows we currently observe are not helping its case, either.
Pulling up the technical indicator in the weekly timeframe and we see a clear SELL - indicating that the price/trend has turned bearish.
And from what we know of XRP - it's likely that the price will drop ALL the way back to the lows, aka the beginning of the parabolic rally - possibly even further down.
______________________
BINANCE:XRPUSDT

KANGO TO THE MOON! TECHNICAL ANALYSIS🔸 Chart Pattern: Falling Wedge Formation
KANGO has been trading inside a well-defined falling wedge, a classic bullish reversal pattern that often signals a potential breakout after sustained downtrend pressure. The price is nearing the apex and has started to show signs of bullish momentum, testing the upper resistance of the wedge.
🔸 Key Technical Highlights:
Support Zone: 0.00001200 – 0.00001800 USDT
Resistance Zone: 0.00010000 – 0.00018000 USDT
Breakout Trigger: A confirmed breakout above 0.00002000 USDT with volume confirmation
🔸 Indicators:
VMC Cipher B: Bullish divergence detected, momentum turning green, indicating hidden buyer strength
RSI (14): 45.43 and climbing – neutral territory, leaving room for a strong upward move
MFI (Money Flow Index): Currently at 56, suggesting renewed accumulation and capital inflow
Stochastic RSI: Oversold (~20), pointing to an imminent bullish crossover
🔸 Volume Analysis:
A visible volume squeeze is occurring; a spike in volume could catalyze a breakout and rapid price appreciation.
🚀 KANGO TO THE MOON 🔥
🎯 Falling wedge pattern? Check. Bullish divergence? Check. Meme coin magic? DOUBLE CHECK.
KANGO is locked, loaded, and ready to blast off! After months of consolidation, it's tightening the coil inside a textbook falling wedge, and the breakout zone is just a breath away. With bullish momentum building and the community revving up, all eyes are on KANGO to flip resistance into launch fuel. 🌕🚀
From stealth mode to beast mode – the KANGO ROCKET is warming up.
📈 Eyes on the 0.00002000 zone – a clean break here and it’s liftoff time!
🔥 If you're not strapped in yet, this might be your final boarding call.
👉 KANGO isn't just a meme. It's a MOVEMENT.

$EBULL Gearing Up for A Massive Comeback Amidst RSI LevelsThe price of Ethereum is Good ($EBULL) is gearing up for a 100% uptick amidst the Relative Strength Index (RSI) indicating the asset has been oversold for long.
Further supporting the bullish thesis is the fact that $EBULL is constrained in a falling wedge patter for almost 3 months now losing almost 62% of total value. The asset is now prime for investors to horde as the market is subtle to volatility with $EBULL sitting under a market cap of $987K.
For $EBULL, a break above the 38.2% Fibonacci level is needed to pave way for the 100% surge in sight. With the RSI at 36, this screams bullish since the asset is presently oversold.
About ETHEREUM IS GOOD
$EBULL is here to reignite the glory of Ethereum in the memecoin universe, emphasizing the chain's unmatched legacy. With a nod to Ethereum's resilience and vitality, $EBULL invites the community to embrace their inner bull and charge forward with confidence.
ETHEREUM IS GOOD Price Live Data
The live ETHEREUM IS GOOD price today is $0.000099 USD with a 24-hour trading volume of $99.98 USD. ETHEREUM IS GOOD is down 15.53% in the last 24 hours. The current CoinMarketCap ranking is #1949, with a live market cap of $988,261 USD. It has a circulating supply of 10,000,000,000 EBULL coins and a max. supply of 10,000,000,000 EBULL coins

#Altcoins running it!Altcoins index OTHERS was rejected from the uptrend support and is then preparing for another run

TRX bullish soon!CRYPTOCAP:TRX -@trondao
TRON is dedicated to building the infrastructure for a decentralized internet. 🌐
#TRX is currently rejecting a strong demand zone marked in blue.
For the bulls to take over and initiate the next upward impulse phase, a break above the last major high marked in green at $0.252 is needed.🚀

ETH - As long as the $1,950 holds...Hello TradingView Family / Fellow Traders. This is Richard, also known as theSignalyst.
📈After breaking above the $2,000 level, ETH has been overall bullish trading within the rising orange channel.
Moreover, it is retesting as strong support zone, so we will be looking for longs as long as the $1,950 level holds.
🏹 Thus, the highlighted blue circle is a strong area to look for buy setups as it is the intersection of support and lower orange trendline acting as a non-horizontal support.
📚 As per my trading style:
As #ETH approaches the blue arrow zone, I will be looking for bullish reversal setups (like a double bottom pattern, trendline break , and so on...)
📚 Always follow your trading plan regarding entry, risk management, and trade management.
Good luck!
All Strategies Are Good; If Managed Properly!
~Rich

VELAS IS READY TO IGNITE!🔥 VELAS IS READY TO IGNITE! 🔥
This chart screams massive breakout incoming — and here's why you should be paying attention right now:
📈 Falling Wedge Pattern Detected!
One of the most bullish reversal patterns in crypto. Velas ( LSE:VLX ) is tightening its coil, and once that breakout hits, we're looking at a potential moonshot.
🚀 Explosion Incoming – Targets as High as $0.024!
That massive blue arrow isn’t just for show – it’s pointing to the next major resistance zone. If this breakout plays out (and all signs say YES), we're talking about +400% gains from current levels!
🧠 Technical Indicators Support the Pump
MACD is showing early signs of bullish divergence.
RSI is climbing out of oversold territory.
Stochastic is crossing up — the bottom may already be in.
Money Flow Index is turning — smart money may already be accumulating.
🗓️ Key Catalyst: March 20th Update by Alex Alexandrov
With the Velas 2.0 Subchain Devnet, ERC20 upgrades, EVML support, and more — the fundamentals are aligning with the technicals. This is textbook launchpad energy.
⚡️ TL;DR: Velas is building momentum like a slingshot being pulled back. The tighter it winds, the harder it’s going to snap forward. Don’t miss this wave. Don’t blink. The move could be violent.
🌕 VELAS TO THE MOON – ARE YOU READY? 🌕

TOTAL2 Altcoins #Altcoins mcap TOTAL2 gathers strength above coraltrend and ema20 major support ahead of next major run!

What will happen first? BTC to 67k or to 100K?Hey traders! Long time no see.
Looks like Trump and his team won’t be responsible for keeping the market healthy anymore—or maybe they just don’t care right now...
So let’s check some technicals and try to figure out what to expect next.
Not gonna lie, the picture isn’t looking too bright 🥹
Even though we’re moving up a bit, this price action feels more like a bearish flag—meaning we could be setting up for further downside (nervous laugh). Plus, that golden cross on the weekly chart isn’t giving bullish vibes, and volume is confirming our fears.
So… if this plays out, does that mean no bull season for now?
What do you think, guys? Any promising news out there?

COMP - Shift in Momentum in Action!Hello TradingView Family / Fellow Traders. This is Richard, also known as theSignalyst.
🔹 COMP has been overall bearish trading within the falling channel in red.
However , it is currently rejecting a strong weekly support at $35 - $40.
Moreover, it is clear that the bears are exhausted as the bearish impulse phases are getting more flat.
📈 For the bulls to take over, and shift the momentum in their favor, a break above both trendlines and $50 round number is needed.
📚 Always follow your trading plan regarding entry, risk management, and trade management.
Good luck!
All Strategies Are Good; If Managed Properly!
~Rich

S - Roadmap to $1S has been overall bullish trading within the rising channel marked in blue.
Currently, S is retesting the upper boundary of the channel and a key structure at $0.63.
For the bulls to stay in control and aim for the $1 round number, a break above $0.63 is needed.
In the meantime, if S retests the lower boundary of the blue channel and the $0.50 round number, we will be looking for trend-following long opportunities.

Altcoins Can Explode In 2025 [READ CAREFULLY]Hello, Skyrexians!
It's time to update our CRYPTOCAP:OTHERS.D idea. In fact nothing changed still. We don't have the growth confirmation, but let's put together all facts which tell us that this growth can happen soon.
Let's take a look at the weekly time frame. We can see that Bullish/Bearish Reversal Bar Indicator gave us the green dot signal. This signal is unconfirmed. For confirmation we need breakout of 9% level. Much better if candle will be closed above it. This fact can finish the huge ABC correction which has been started after the previous altcoin season. This reversal bar has the great angle with alligator which is another one sign of soon trend change. All these signals can bring the dominance above 20%. In this case we will see massive gains on altcoins.
Best regards,
Skyrexio Team
___________________________________________________________
Please, boost this article and subscribe our page if you like analysis!

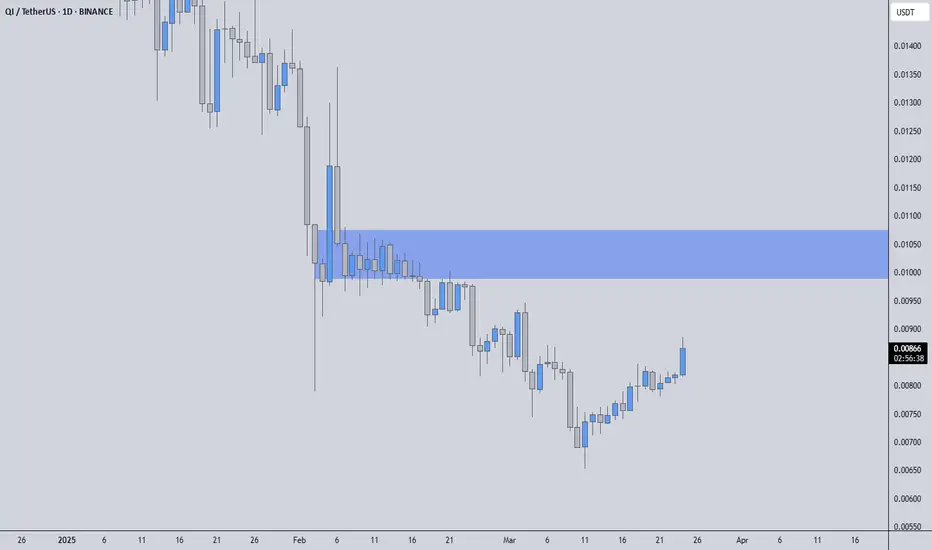
QIUSDT – MASSIVE %284 VOLUME SPIKE!🔥 Key Level Alert: The blue box is a huge resistance zone—we are at a critical decision point. Blind entries = bad trades. Smart entries = profits.
📊 How I’m Approaching This:
✅ Volume Surge = Increased Interest – But where is price heading?
✅ Blue Box = Key Resistance – If we reject, I’ll look for LTF breakdowns + CDV confirmations to short.
✅ Break & Retest? If we push above with volume and confirm on the retest, I’ll flip long instead.
💡 Trading Like a Pro:
I never insist on a short just because it "looks high." If the price breaks up with momentum, I adjust my bias and ride the trend. Flexibility is what separates winners from losers.
🚀 Follow for next-level, no-nonsense trading insights. The market moves, I move smarter. 🔥
I keep my charts clean and simple because I believe clarity leads to better decisions.
My approach is built on years of experience and a solid track record. I don’t claim to know it all, but I’m confident in my ability to spot high-probability setups.
If you would like to learn how to use the heatmap, cumulative volume delta and volume footprint techniques that I use below to determine very accurate demand regions, you can send me a private message. I help anyone who wants it completely free of charge.
I have a long list of my proven technique below:
🎯 ZENUSDT.P: Patience & Profitability | %230 Reaction from the Sniper Entry
🐶 DOGEUSDT.P: Next Move
🎨 RENDERUSDT.P: Opportunity of the Month
💎 ETHUSDT.P: Where to Retrace
🟢 BNBUSDT.P: Potential Surge
📊 BTC Dominance: Reaction Zone
🌊 WAVESUSDT.P: Demand Zone Potential
🟣 UNIUSDT.P: Long-Term Trade
🔵 XRPUSDT.P: Entry Zones
🔗 LINKUSDT.P: Follow The River
📈 BTCUSDT.P: Two Key Demand Zones
🟩 POLUSDT: Bullish Momentum
🌟 PENDLEUSDT.P: Where Opportunity Meets Precision
🔥 BTCUSDT.P: Liquidation of Highly Leveraged Longs
🌊 SOLUSDT.P: SOL's Dip - Your Opportunity
🐸 1000PEPEUSDT.P: Prime Bounce Zone Unlocked
🚀 ETHUSDT.P: Set to Explode - Don't Miss This Game Changer
🤖 IQUSDT: Smart Plan
⚡️ PONDUSDT: A Trade Not Taken Is Better Than a Losing One
💼 STMXUSDT: 2 Buying Areas
🐢 TURBOUSDT: Buy Zones and Buyer Presence
🌍 ICPUSDT.P: Massive Upside Potential | Check the Trade Update For Seeing Results
🟠 IDEXUSDT: Spot Buy Area | %26 Profit if You Trade with MSB
📌 USUALUSDT: Buyers Are Active + %70 Profit in Total
🌟 FORTHUSDT: Sniper Entry +%26 Reaction
🐳 QKCUSDT: Sniper Entry +%57 Reaction
📊 BTC.D: Retest of Key Area Highly Likely
📊 XNOUSDT %80 Reaction with a Simple Blue Box!
I stopped adding to the list because it's kinda tiring to add 5-10 charts in every move but you can check my profile and see that it goes on..
AVAX / AVAXUSDT | 1H | Avax will be the rocketHey there;
I have prepared avax analysis for you. All I ask from you is to support this analysis with your likes.
My Avax target level is 22.62 and my stop level is 17.37.
This analysis has a win rate of 2.00
Guys I will update this analysis under this post
Now let's just follow this analysis and see if my analysis is correct or not.
Thank you very much to everyone who has been kind and supported me with their likes.
Thanks to your support, I am constantly preparing special analyzes for you.
I love all my followers very much.

24/03/25 Weekly outlookLast weeks high: $87,453.65
Last weeks low: $81,140.91
Midpoint: $84,297.28
Great weekly close for the bulls! A reclaim of the weekly high in the dying hours of the week is a huge win and has spurred on an early run for the weekly high.
The overall goal for this move should be $91,000 in my opinion, and a must not lose area is $86,000 or 0.75 line/ last weeks weekly high.
What happens at $91,000 is yet to be determined and I have an idea many will be tentative around that area. On the high time frames a reclaim of this level unlocks the capability to retest the highs from a TA standpoint as price re-enters the range bound environment. A rejection of that level would make a $73,000 retest a very real possibility.
In terms of altcoins we're seeing some strength returning with some strong gains but relative to their sell-offs it is a a drop in the ocean so far. Currently the market conditions are a traders dream but a long term investor/holders nightmare. No major news is planned to come this week so unless something drastic happens TA should be the driving factor this week.

QTUM is almost ready...NASDAQ:QTUM -@qtum
Qtum is a smart contract platform forked from Bitcoin Core and Ethereum.🔐
#QTUM rejected the $2 support level and round number.
For the bulls to take control in the medium term, a break above the inverse head and shoulders neckline marked in orange at $2.47 is needed.🚀

Levels in LINK: Breakdown or Breakout?If you find this information inspiring/helpful, please consider a boost and follow! Any questions or comments, please leave a comment!
### **Technical Overview**
- **Current Price**: $14.35 (approx.)
- **Trend Structure**: Elliott Wave count suggests Wave 3 has wrapped up. Wave 4 and 5 are likely next.
---
### **Key Observations**
- **Impulse Invalidation Level**: $19.190
→ A break above this invalidates the current bearish impulse.
- **Bullish Barriers**:
- *Minor Resistance*: $15.002
- *Major Resistance*: $17.677
These are the key spots bulls need to reclaim to regain control.
- **Crucial Support**: $12.426
→ If this breaks, expect more downside—likely toward the final Wave 5 zone.
- **Bearish Target**: $9.283
→ Probable landing spot for Wave 5 (of C). Could shape up as a longer-term accumulation zone.
---
### **Elliott Wave Context**
- A possible running or expanded flat scenario is in play, with Wave (B) topping around the 1.382 extension.
- Wave 3 appears to have completed near the 1.618 extension, a textbook zone for this kind of move.
---
### **Potential Scenarios**
1. **Bullish Reversal Case**:
- Price reclaims $15.00 and ideally $17.677.
- The bearish count falls apart.
2. **Bearish Continuation Case**:
- Price stalls under resistance.
- A break of $12.426 sets the stage for continuation down to $9.283.
3. **Neutral Scenario**:
- Choppy consolidation between $12.5–$15 while the market sorts itself out.
---
### **Strategic Considerations**
- **Short-term Bulls**: Watch $15–$17.6. Any strong reclaim could offer clean long setups.
- **Bears & Shorts**: Prime fade zone if price gets rejected near resistance.
- **Long-term Investors**: If we hit $9.283, that’s a potential loading zone for the next cycle.
Trade safe, trade smart, trade clarity.

ORCAUSDT – First Support at the Blue Box!🐋 ORCAUSDT – First Support at the Blue Box! 🚀
“Patience is key—the blue box is our first support area, but confirmation is everything!”
🔥 Key Insights:
✅ Blue Box = First Support Zone – A reaction here could be a strong buy signal.
✅ No Blind Entries! – We wait for CDV, LTF breakouts & volume confirmation.
✅ If Support Holds, Expect a Strong Bounce – Otherwise, we wait for the next level.
💡 The Smart Plan:
Monitor Price Action at the Blue Box – Buyers must step in.
Wait for Market Structure Break on LTF – No breakout = No trade.
CDV & Volume Profile Must Confirm Strength – We only follow smart money.
“Discipline wins. If confirmation comes, we strike—otherwise, we wait.” 📈🔥🐋
A tiny part of my runners:
🎯 ZENUSDT.P: Patience & Profitability | %230 Reaction from the Sniper Entry
🐶 DOGEUSDT.P: Next Move
🎨 RENDERUSDT.P: Opportunity of the Month
💎 ETHUSDT.P: Where to Retrace
🟢 BNBUSDT.P: Potential Surge
📊 BTC Dominance: Reaction Zone
🌊 WAVESUSDT.P: Demand Zone Potential
🟣 UNIUSDT.P: Long-Term Trade
🔵 XRPUSDT.P: Entry Zones
🔗 LINKUSDT.P: Follow The River
📈 BTCUSDT.P: Two Key Demand Zones
🟩 POLUSDT: Bullish Momentum
🌟 PENDLEUSDT.P: Where Opportunity Meets Precision
🔥 BTCUSDT.P: Liquidation of Highly Leveraged Longs
🌊 SOLUSDT.P: SOL's Dip - Your Opportunity
🐸 1000PEPEUSDT.P: Prime Bounce Zone Unlocked
🚀 ETHUSDT.P: Set to Explode - Don't Miss This Game Changer
🤖 IQUSDT: Smart Plan
⚡️ PONDUSDT: A Trade Not Taken Is Better Than a Losing One
💼 STMXUSDT: 2 Buying Areas
🐢 TURBOUSDT: Buy Zones and Buyer Presence
🌍 ICPUSDT.P: Massive Upside Potential | Check the Trade Update For Seeing Results
🟠 IDEXUSDT: Spot Buy Area | %26 Profit if You Trade with MSB
📌 USUALUSDT: Buyers Are Active + %70 Profit in Total
🌟 FORTHUSDT: Sniper Entry +%26 Reaction
🐳 QKCUSDT: Sniper Entry +%57 Reaction
📊 BTC.D: Retest of Key Area Highly Likely
I stopped adding to the list because it's kinda tiring to add 5-10 charts in every move but you can check my profile and see that it goes on..
