$NEAR Local Still looks corrective..Though the CBOE:NEAR weekly looks good the same pattern on NEAR that I have highlighted here was also found on NYSE:FET and EURONEXT:RNDR local charts that has held these coins back from moving compared to others and appears corrective in nature and they all end at the daily 200EMA on bearish divergence.
Just something to look out for. A rejection in alts now could see fresh lows
Safe trading
Altcoin

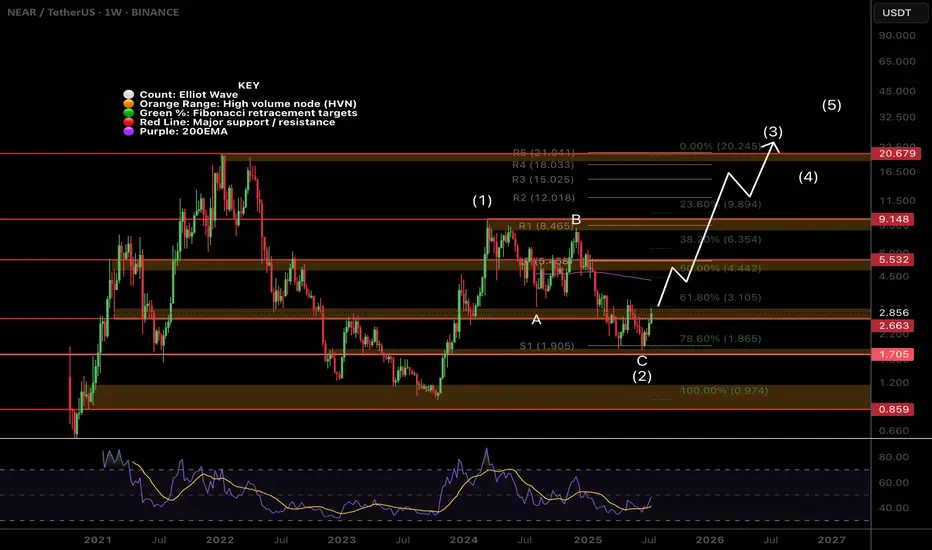
$NEAR Weekly TextBook Elliot Wave!CBOE:NEAR Weekly chart is a great demonstration of the text book motif wave followed by ABC corrective wave.
Bullish divergence has printed on the weekly RSI at the S1 weekly pivot support and the 'alt-coin golden pocket' 0.786 Fibonacci retracement. Price is closing in the major resistance High Volume Node.
The upside target is the newly printed weekly 200EMA followed by the weekly pivot and major resistance HVN just above $5.
A terminal target for this cycle may only see NEAR hitting all time highs around $21, the R5 weekly pivot point.
Safe trading
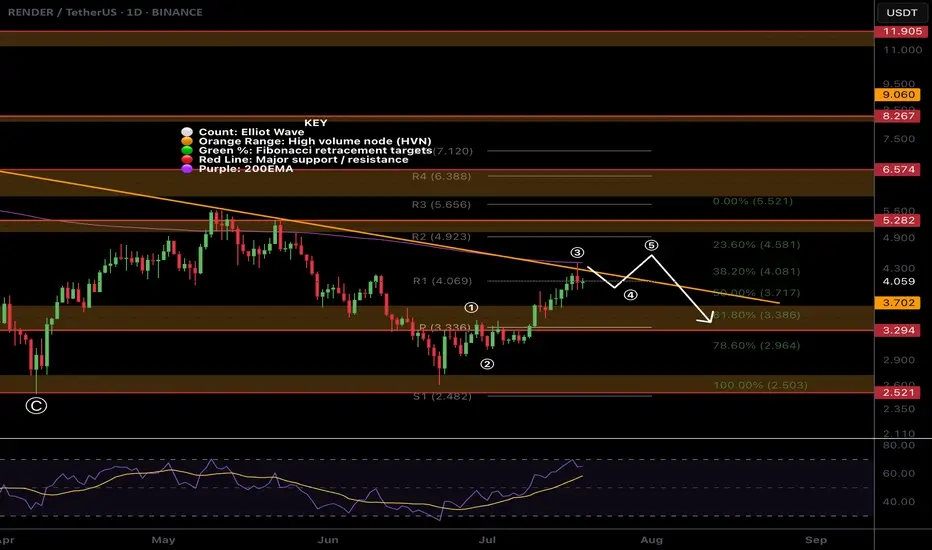
$RENDER At Major Resistance!CRYPTOCAP:RENDER has been relatively weak. Looking at the local chart it appears we have finished a wave (3) at the daily 200EMA and descending resistance.
Price has overcome the High Volume Node (HVN) support flipped resistance but a strong at coin pull could see fresh lows for Render.
There is also daily bearish divergence on the RSI.
The Elliot Wave count could also be an ABC corrective wave up which has now terminated.
If its a new motif wave and a major bottom has formed , wave 2 should find support at the HVN, daily pivot and 'alt-coin' golden pocket between 0.168 and 0.782 Fibonacci retracement
Safe trading
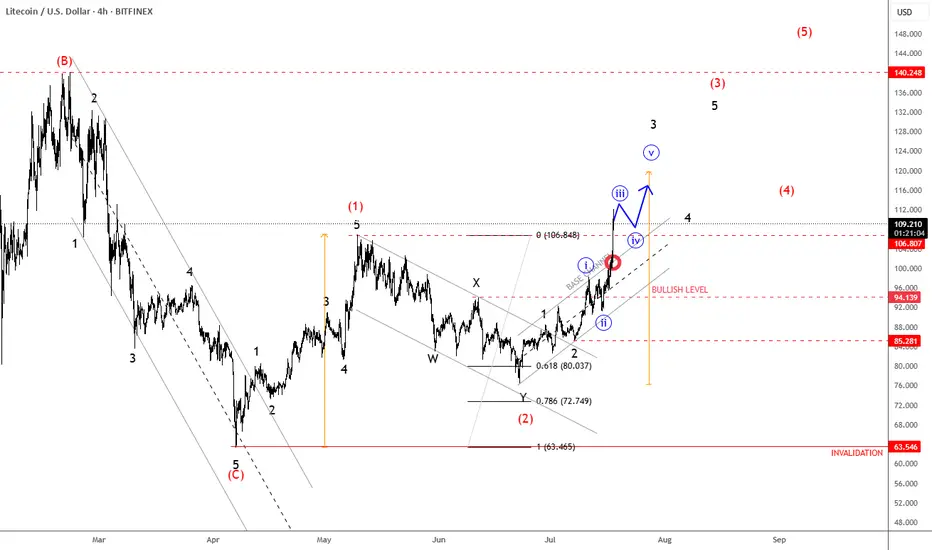
Litecoin Continues Its Bullish Cycle As ExpectedLitecoin Continues Its Bullish Cycle As Expected, which can send the price even higher from technical point of view and by Elliott wave theory.
We talked about Litecoin back on May 30, when we spotted a bullish setup formation with waves (1) and (2) that can extend the rally within wave (3) of a five-wave bullish impulse.
As you can see today on July 18, Litecoin with ticker LTCUSD is now breaking strongly back above May highs after we noticed a complex W-X-Y correction in wave (2). Now that ALTcoin dominance is stepping strongly in, we may easily see more gains within a projected five-wave bullish cycle during the ALTseason, just be aware of short-term pullbacks.
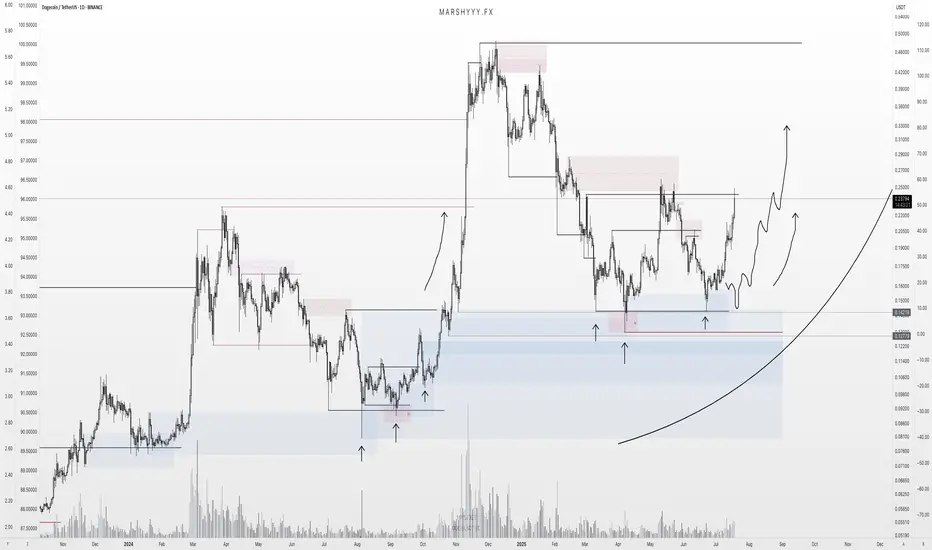
DOGE Update: Reversal Playing Out — $1+ in Sight?DOGE is playing out almost exactly as forecast back on June 14th, where I was monitoring for price to sweep the SSL and tap into range low demand within this larger HTF range.
Price did exactly that — pushing into discount, tagging the marked demand zone, and bottoming out right where I expected the reversal. I DCA’d hard at $0.165 after the initial low printed — just as planned.
Now sitting around +50% on those buys, and my plan remains to ride this out toward the ATH at $0.74 and potentially $1+.
The HTF closes forming here — across 3D, 4D, 5D, 6D candles — are showing clear strength. For me, the low is likely in, and I’m expecting new higher highs and ATHs from here. Now it’s just about letting the market do its thing, trailing stops, and taking profits into strength as alerts and targets get hit.
Zooming way out — I’m also watching DOGE’s 10-year uptrend channel. Price has once again tagged the lower bound of that channel, and historically, this has led to moves back to the channel highs.
🧠 Layer on a fib projection from the previous ATH to the bear market low, and we get:
1.272 Fib → ~$1.54
1.618 Fib → ~$3.92
Both of which align perfectly with the upper bounds of that long-term trend channel — giving us a key HTF reversal zone to monitor in the future.
In summary:
- Reversal from demand ✅
- DCA filled ✅
- HLs printing ✅
- Targets = ATH and beyond
- Watching HTF fibs + channel highs for eventual cycle top formation
DOGE is doing what DOGE does — don’t overcomplicate it.
1D:
3D:
1W:
1M:
/3.5 The Winner's Psychology & The Hunt for Trade
Introduction: The Dangerous Time of Euphoria
I want to start by thanking you for the phenomenal support for the "Altseason: Live" experiment. We closed Round 1 with a +92% profit on the initial capital from just two trades.
But I need to be brutally honest with you: the most dangerous time is just beginning. Let's be clear: for these two months, I won't be chasing a conservative 3% per month. I will be trading quite aggressively.
That's why, in the coming weeks, you will see various coins "pump" without any logic. Your inner FOMO will be screaming at you: the feeling that you're late, you're in the wrong coin, you've missed out. In this frenzy, many will jump on a moving train. And my forecast remains: sometime around July 17th to 21st, the market will brutally shake out these passengers.
My Philosophy: The Battle with the Main Enemy—My Own Euphoria
After a huge win like +92% on the portfolio, it's very easy to get caught up in the "winner's high." A dangerous confidence appears, the feeling that you've figured out the market and that it will always be like this. This is a trap.
That is why I did something that might seem illogical: I cut my position size for the next trades by a factor of four.
Why? To tame that euphoria. To prove to myself that discipline is more important than elation. To remember that my win rate is not 100%, and a single losing trade on a wave of overconfidence can wipe out all the previous hard work. The most important thing is my inner calm.
Of course, when I talk about "calmness" in the context of futures, leverage, and altcoins, it sounds ridiculous. I get that. But striving for inner composure is the only shield a trader has.
My core principle remains unchanged: Fear losing more than you fear missing out on gains.
The Hunt for Leaders: My Methodology for Picking the Next Trade
Rebranding and New Tokenomics:
When a project undergoes a rebrand, it almost always means the team has a plan. The pressure from old sellers decreases, and the probability of a subsequent rally is high.
' Smart Money' Footprints (Accumulation):
This is my favorite pattern. Long periods of accumulation at certain levels, anomalous volumes, and candles with long wicks—all of this indicates that a major player has entered a position and is preparing for a breakout.
New Listings and Unique Patterns:
Projects recently listed on top exchanges don't have the "baggage" of disappointed holders. Over the years, I've noticed certain unique patterns in their charts that have a high probability of leading to growth.
The Art of the Entry: Hunting for the Entry Point
I try to enter positions with limit orders, and I always wait for a pullback. I look for an entry on a local correction when panic is shaking out the random passengers.
Hunt for your entry point. That is the most important thing.
The Golden Rule: Not a Single Step Without a Stop-Loss
Trading without a stop-loss is suicide. Accepting a small, planned loss is not a weakness but a part of the professional game.
What's Next?
I've already missed one coin I wanted to trade—it took off without me. I didn't chase it. Now, I am patiently waiting and searching for the next setup that meets ALL of my criteria.
The "Altseason: Live" experiment continues. You can watch everything in real-time on my streams. The hunt is on.
Thank you for your attention.
Best Regards EXCAVO
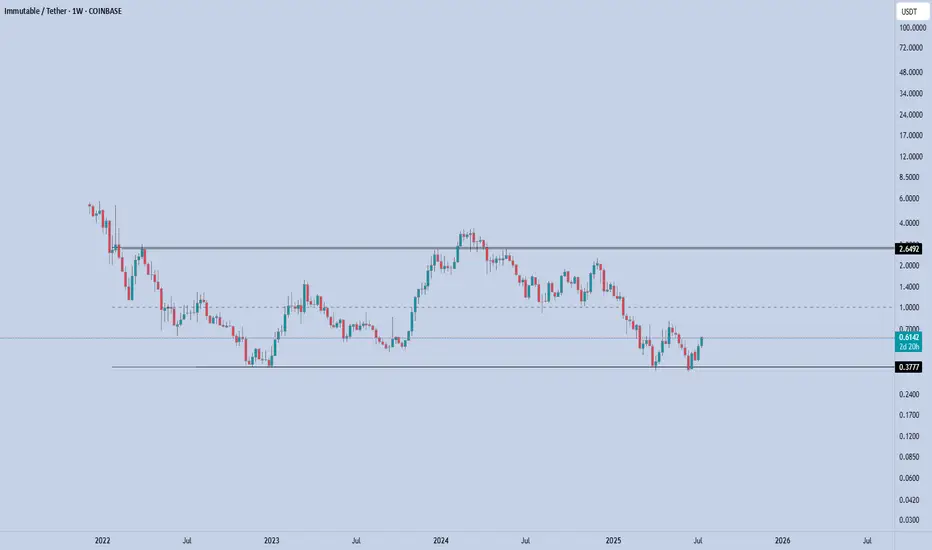
IMX – Range Low ReclaimedIMX has once again defended the $0.37–0.38 demand zone, bouncing sharply off the lows. This level has acted as a long-term accumulation base since late 2022, and price is now showing early signs of another range rotation.
Currently trading at $0.61, IMX is holding above the reclaimed support. As long as this level is maintained, the setup favors a move toward the mid-range and potentially the upper boundary of the established range.
🎯 Key Levels:
Support: $0.38 (range low & invalidation)
Mid-range: $1
Target: $2.65 (range high)
If bulls can push through the $1 mid-range resistance, the top of the range at $2.65 becomes the next magnet.
📌 Risk Management:
$0.38 is the line in the sand. A close below this level breaks the structure and invalidates the setup.
XRP - One More Wave Soon!Hello TradingView Family / Fellow Traders. This is Richard, also known as theSignalyst.
📈XRP has been overall bullish trading within the rising wedge pattern in blue.
However, it is approaching its all-time high at $3.4.
🏹 The highlighted blue circle is a strong area to look for buy setups as it is the intersection of the orange demand zone and lower blue trendline acting as a non-horizontal support.
📚 As per my trading style:
As #XRP retests the blue circle zone, I will be looking for bullish reversal setups (like a double bottom pattern, trendline break , and so on...)
📚 Always follow your trading plan regarding entry, risk management, and trade management.
Good luck!
All Strategies Are Good; If Managed Properly!
~Rich

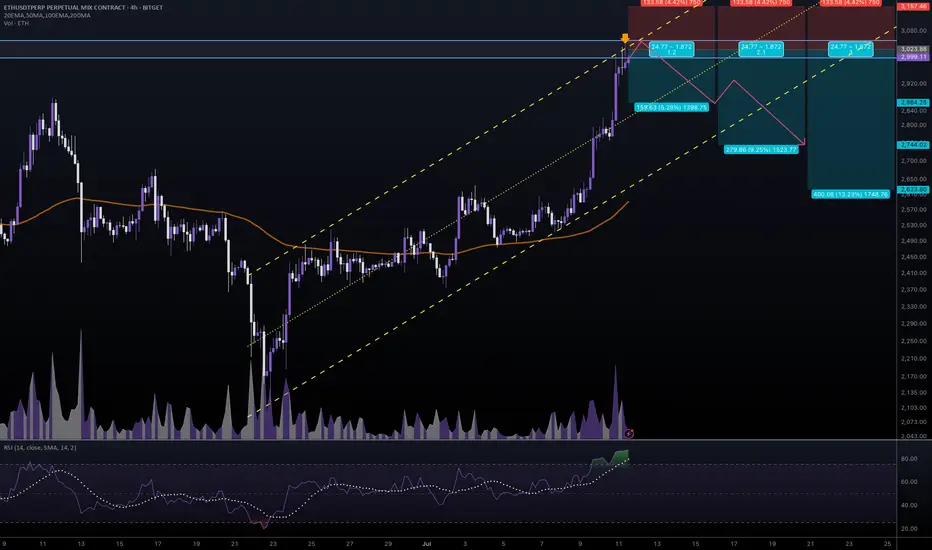
#ETHUSDT #4h (Bitget Futures) Ascending channel on resistanceEthereum printed a gravestone doji followed by a shooting star, RSI is overbought, local top seems in.
⚡️⚡️ #ETH/USDT ⚡️⚡️
Exchanges: Bitget Futures
Signal Type: Regular (Short)
Leverage: Isolated (9.0X)
Amount: 5.0%
Entry Zone:
2996.99 - 3050.49
Take-Profit Targets:
1) 2864.25
2) 2744.02
3) 2623.80
Stop Targets:
1) 3157.46
Published By: @Zblaba
CRYPTOCAP:ETH BITGET:ETHUSDT.P #4h #Ethereum #PoS ethereum.org
Risk/Reward= 1:1.2 | 1:2.1 | 1:3.0
Expected Profit= +47.5% | +83.3% | +119.0%
Possible Loss= -39.8%
Estimated Gaintime= 1-2 weeks
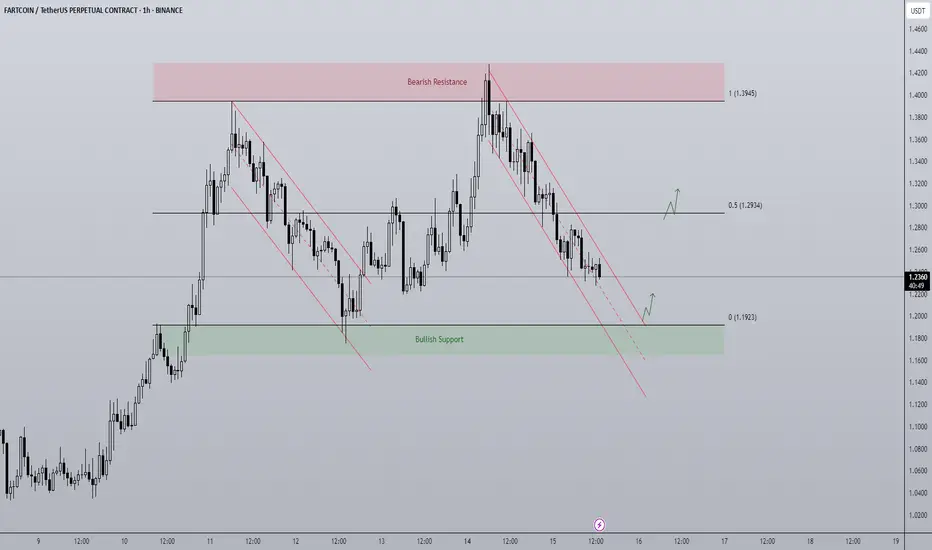
Fartcoin - Rangebound repeat? A BTC makes new highs attention has turned towards altcoins to play catch up.
FARTCOIN has been a top performer of the last month and currently on the 1D timeframe finds itself in a rangebound environment capped between $1.1923 - $1.3945. The end of last week price trended down in a bearish channel from top to bottom and it looks to be doing the same currently. As the supply zone above the range high got swept, price printed a SFP getting back inside the range and began trending down, for me there are two actionable long entries here:
- A range low bounce + breakout of trend channel would be an ideal long entry. An area of clear support coupled with a breakout is a historically strong setup with a clear invalidation if price breaks below the range and gets accepted.
- A more aggressive but potentially less ideal setup would be a breakout of the downtrend before hitting range lows. Higher risk as the level of support is not as defined but in the more risk-on environment crypto is currently in, the chance of major support levels being front run does go up as buyers become more impatient when FOMO grows.
The midpoint is key level to look out for too as a reclaim would mean a run at the highs, rejection opens the door to retest the lows.
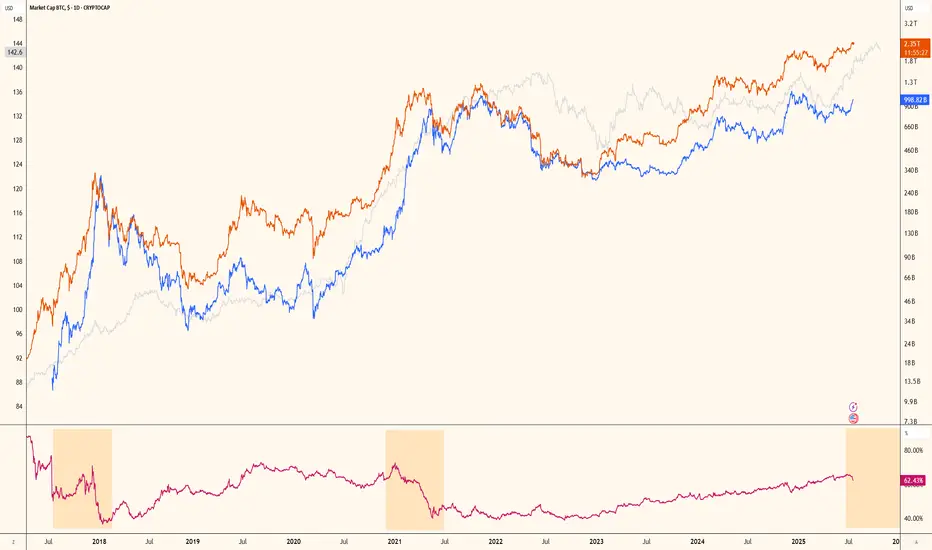
The Final Turn Before the Altcoin RotationAs Bitcoin continued its rise, altcoins couldn't keep up. This isn't the first time; the market has experienced this many times. The general pattern is as follows:
1. Global liquidity increases, providing a kind of spark to the market.
2. Bitcoin catches fire, and a bull market begins. If global liquidity increases during this time, great.
3. For various reasons, altcoins don't rise at the same pace as Bitcoin, and therefore Bitcoin's dominance begins to gradually increase.
4. When the market reaches saturation, dominance declines, leading to a rotation into altcoins.
5. The altcoin market capitalization equals Bitcoin's, and the bull market begins.
We're currently at a stage where Bitcoin's dominance has peaked and liquidity is still rising. The beginning of a decline in dominance will trigger a market rotation. This will trigger a capital flow into altcoins, bringing their market value equal to Bitcoin's.
Therefore, we're at the final plateau before entering a bull market. A further rise or hold in Bitcoin is expected. I'm currently buying altcoins, but I'm holding Bitcoin. I don't have a sell mindset at the moment.
$PENGU Taking a Breather? CSECY:PENGU Taking a Breather? Wave 4 May Be Brewing
After a strong move, CSECY:PENGU looks like it might be pausing for breath. The recent action suggests we may have just wrapped up a small-degree Wave 3, with price now struggling to clear a key resistance level from earlier in the structure.
That hesitation could mark the early stages of a Wave 4 correction...Conservatively.
Here’s the zone I’m watching for a potential W4 pullback:
- .236 to 50% retracement of Wave 3, measured from the Wave 2 low
- Most Likely Target (MLT) sits right around the .382 fib
- Keep an eye on time symmetry—Wave 4 may offset the time duration of Wave 2
- Price could react off the base channel as a support guide
If this is a W4, it could give us a clean continuation setup into Wave 5—provided it holds structure and doesn’t overlap the Wave 1 territory. Stalking the pullback as it plays out, and am ready to react if we see support step in at the expected fib levels or the base channel.
Trade Safe!
Trade Clarity!

HBAR Is About to Melt Faces!I see a powerful reversal coming on HBAR due to a breakout from this falling wedge pattern. A new high above the $0.35 resistance should be coming soon. I’m bullish!
As always, stay profitable.
– Dalin Anderson

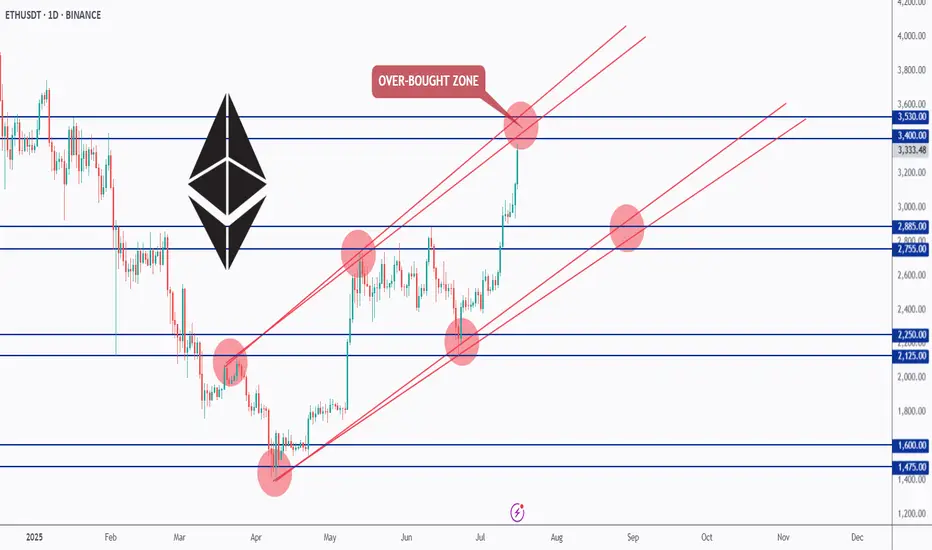
ETH Testing Overbought Zone — What’s Next?📊ETH has been overall bullish, trading inside this rising red channel for months.
After breaking above the $2,885 resistance, bulls took full control, and price is now approaching the upper red trendline — an overbought zone where we’ve seen rejections before.
As long as ETH holds above the $2,885 zone, the bulls remain in control. But since we’re near a strong resistance and the top of the channel, we’ll be waiting for a potential correction or at least a slowdown in momentum before looking for fresh entries.
📌 Key levels to watch:
Resistance: $3,400 – $3,530
Support: $2,885 – $2,755
Let’s stay patient and follow the market’s lead. 🧠
Let me know your thoughts in the comments 👇
📚 Always follow your trading plan regarding entry, risk management, and trade management.
Good luck!
All Strategies Are Good; If Managed Properly!
~Richard Nasr
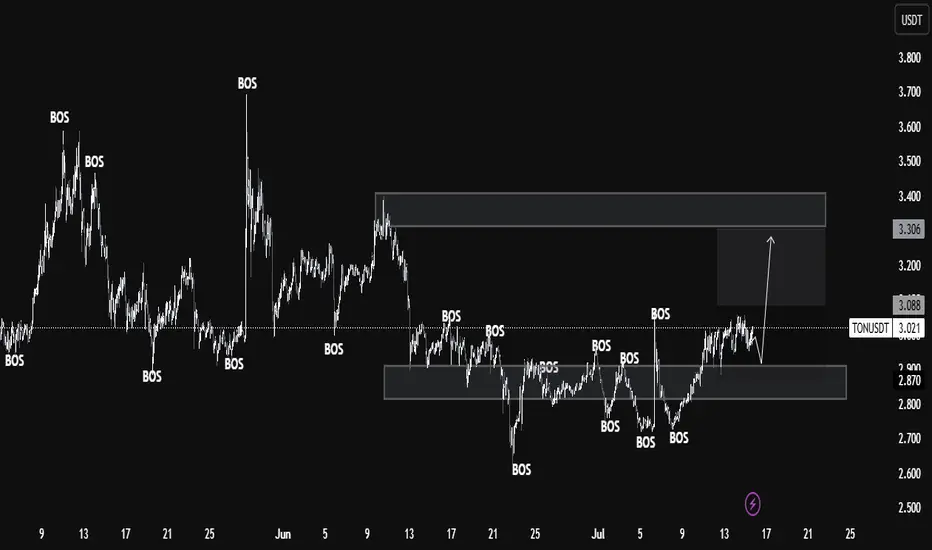
TON/USDT Monthly Structure Flip – Smart Money Targets $3.30+ Aft🔍 Key Observations:
Current Price: 2.974 USDT
Support Zone (Demand Area):
Strong demand zone around 2.870 - 2.800 USDT.
Price previously reacted multiple times from this zone, showing strong buyer interest and BOS confirmations.
Resistance Zone (Supply Area):
The next significant resistance lies in the range of 3.306 - 3.400 USDT.
This zone previously caused a BOS to the downside, making it a critical level to monitor for potential profit-taking or reversals.
Market Structure:
Price is currently consolidating just above the demand zone after a bullish BOS.
Recent BOS confirms a shift in structure from bearish to bullish bias.
Potential Price Path:
If price sustains above the 2.870 support, a bullish move targeting the 3.306 level is likely.
Expect short-term retracements within the structure but with a medium-term bullish bias.
Liquidity Mapping:
Liquidity is likely resting above the 3.088 local highs and the 3.306 major resistance.
Smart money may push price to these levels to mitigate orders or engineer exit liquidity.
📈 Educational Perspective:
This chart is a strong representation of Smart Money Concepts (SMC), particularly the use of BOS as confirmation for directional bias. Traders can look to:
Use the demand zone for potential long entries.
Watch for confirmation (like bullish engulfing or internal BOS) within the zone.
Manage trades toward the premium zone near 3.3 for a favorable risk-reward.
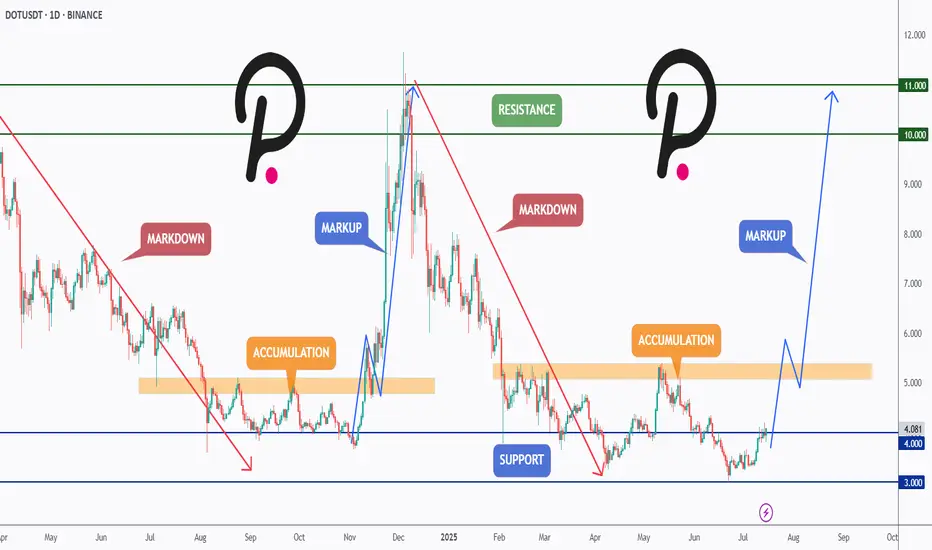
DOT Reloading for Takeoff ?CRYPTOCAP:DOT has been following a textbook Wyckoff cycle — moving from markdown into accumulation, followed by a sharp markup, then another markdown, and once again settling into a fresh accumulation zone.
After retesting the major support at $4 and holding above it, DOT is showing early signs of bullish momentum. If this structure continues, we could be preparing for another markup phase with potential targets at the $6, $10, and even $11 resistance zones.
This setup mirrors the previous cycle — will history repeat itself?
📍 Key Levels:
Support: $4.00 & $3.00
Resistance: $6.00, $10.00, and $11.00
Let me know your thoughts in the comments 👇
📚 Always follow your trading plan regarding entry, risk management, and trade management.
Good luck!
All Strategies Are Good; If Managed Properly!
~Richard Nasr
HolderStat┆BTCUSD above $120BINANCE:BTCUSDT has surged past $129,000 following a breakout from long-term consolidation. The chart shows a clean continuation structure with the next resistance between $135,000–$137,000. Momentum remains on the side of bulls.

HolderStat┆BNBUSD breakoutBINANCE:BNBUSDT has reclaimed $670 support after breaking out from a long-term falling wedge. The bounce has been strong, and the rising structure now targets the $735–$740 resistance zone. Price action confirms bullish intent with consolidation beneath resistance before breakout.

Balla is still Bullish on BITCOIN. Cup & Handle pattern. The trend is still our friend.
I still see bullish developments in the price action.
We must have patience.
Dips still must be bought.
The plan hasn't changed.
We still aiming for that time period of 9 -15 months post #BTC Halving.
We are only one month down :)

FET – HTF Setup Primed for ExpansionFET is looking strong here from a high time frame perspective — currently sitting around $0.739, well into the discount zone of the macro trend channel.
We’ve got:
✅ Price holding monthly demand
✅ A clear swing higher low forming on the weekly and 3W
✅ Already seen the first expansion leg out of demand
✅ Now potentially loading the next move higher
Zooming out, price is still trading below the midline of the long-term uptrend channel — and a move back to the upper boundary puts targets in the $6 region, aligned with a new higher high.
📈 HTF Structure
Midline rejection flipped support
Demand tested and respected
HL printed after clean retest
370% upside just to retest the prior HH at $3.50
HTF trend structure still fully intact
This setup is also supported by the broader HTF bullish bias across BTC, ETH, and majors, which adds confluence to a potential larger expansion phase for alts — especially strong narratives like AI.
🎯 Targets
🎯 $3.50 = prior high
🎯 $6.00+ = upper channel target / next HTF extension zone
From current levels, risk/reward looks very clean.
1W:
3W:
3M:

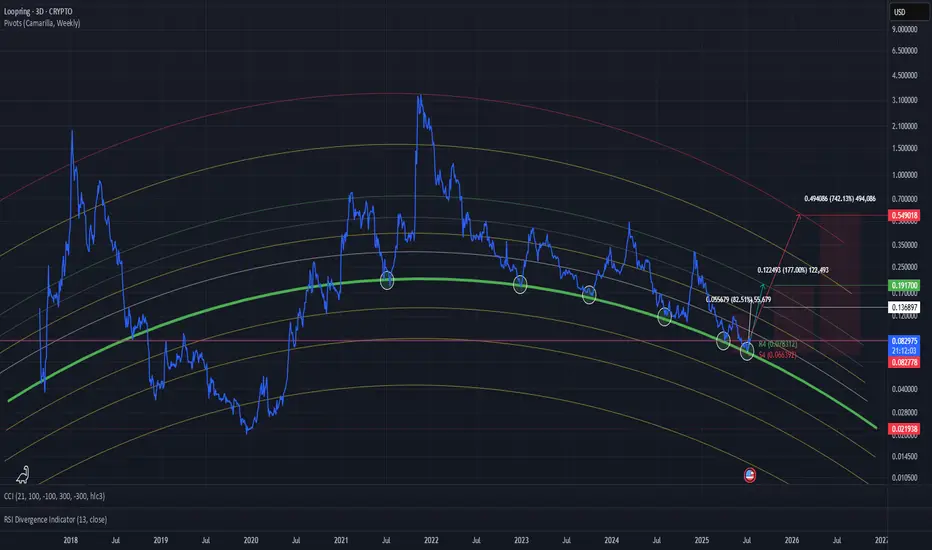
LRC/USDTI’m not sure if there’s a specific method of analysis for this, but it’s clear how precisely the coin reacts to these levels.
That’s why I dare to assume we won’t go any lower.
The green line has consistently acted as a strong support — almost like a trampoline that price bounces off.
All realistic and objective targets are already marked on the chart.
Additionally, the weekly Camarilla Pivot is showing significant strength right now, which adds further bullish confluence.
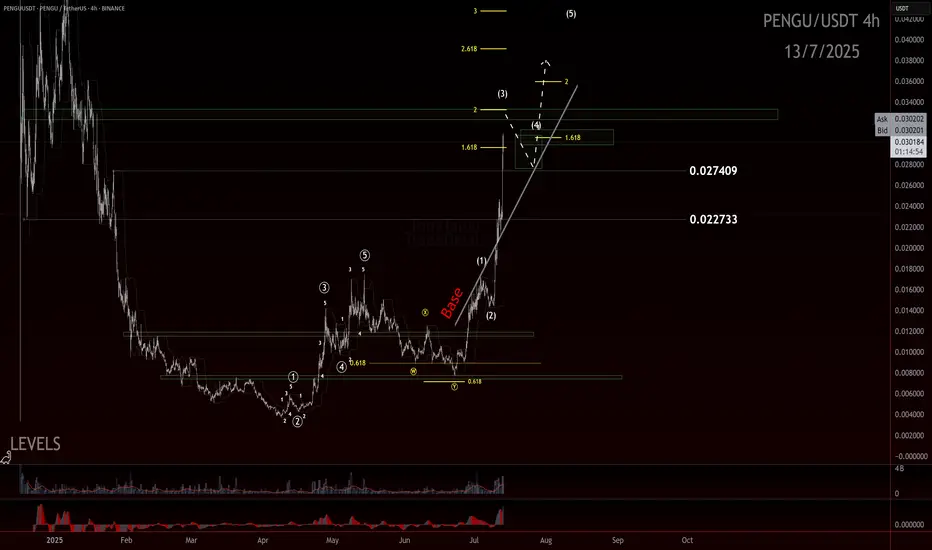
PENGU still has room!?If you find this information inspiring/helpful, please consider a boost and follow! Any questions or comments, please leave a comment!
The move off the low looked like a clean, completed impulse—sharp, decisive, and well-structured. After that, we got a double zigzag retracement. It ran a bit deeper than the textbook version, but still landed right in the normal range you’d expect for a healthy correction. From there, we saw another smaller-degree impulse form off the .007 pivot, suggesting bullish momentum was building again.
Since the last update, PENGU has come a long way—more than doubling in price and now hovering around a most likely target for a wave 3. What’s notable is how it got there: not just by breaking above the 0.017 resistance, but by blowing through multiple base channels on solid momentum and healthy volume.
We didn’t get the ideal depth for a retrace for a wave 2 before that breakout, but that doesn’t disqualify the larger count. In fact, from an Elliott Wave perspective, I still believe we haven’t seen a proper wave 4 to balance out the earlier wave (2). So I’m holding off on calling a top to this wave 3 just yet.
Here’s what we’re watching closely now:
The secondary impulse off .007 continues to build structure
Ideally, the next pullback holds above the 0.027 or .022 region, signaling respect for previous support and AOIs
That pullback needs to unfold correctively, not impulsively, to confirm bullish continuation
The next trade setup I’m eyeing is that wave 4 into wave 5 move. I’ll be stalking this ticker closely as structure unfolds.
Trade safe.
Trade clarity.
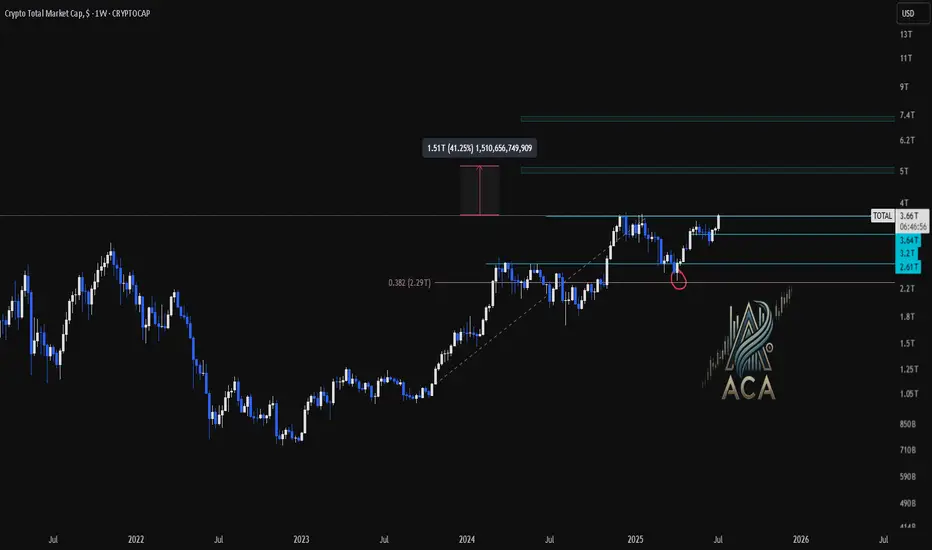
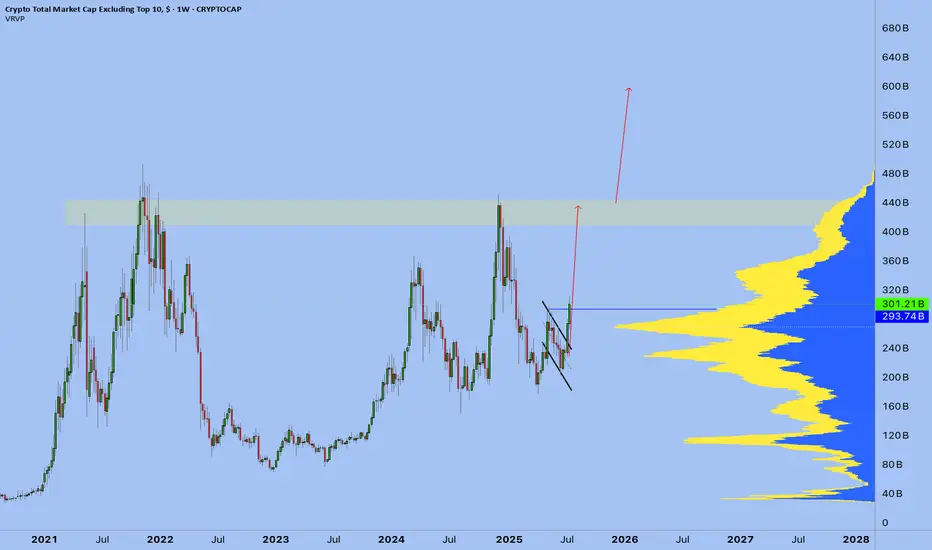
CRYPTO TOTAL MARKET CAP | Weekly Chart Analysis | Breakout in PrCRYPTO TOTAL MARKET CAP | Weekly Chart Analysis | Breakout in Progress
🔍 Let’s break down the crypto total market cap and highlight why the next move could be explosive.
⏳ Weekly Overview
The weekly chart shows a strong breakout above the consolidation box, following a classic fakeout to the downside. The 0.382 Fibonacci retracement level at $2.29T provided solid support, confirming the bullish structure and setting the stage for this move.
🔺 Bullish Scenario:
- The market faked out below the box, trapping bears, and is now breaking out above resistance.
- The breakout targets align with the Fibonacci extension, projecting a move toward the $5T region.
- This $5T target is not only a psychological level but also matches the next major Fibonacci confluence, adding further conviction to the bullish outlook.
📊 Key Highlights:
- 0.382 Fibonacci retracement ($2.29T) held as support during the fakeout.
- Breakout above the box signals renewed momentum and a shift in market sentiment.
- Upside target around $5T is supported by both the measured move and Fibonacci extensions.
- Previous resistance levels at $3.27T and $3.54T now act as support zones.
🚨 Conclusion:
Crypto is breaking out after a textbook fakeout and reclaim of the range. With confluence from Fibonacci targets and strong momentum, the $5T region is now firmly in play as the next major target. Watch for sustained closes above $3.54T to confirm the move and open the door for further upside