HolderStat┆AVAXUSD broke the resistanceBYBIT:AVAXUSDT on the 3h chart has confirmed a breakout from a falling wedge and is retesting $17.26. Price is now forming a higher low, with targets set at $20.50 and $23. This breakout structure supports continuation as momentum shifts back to buyers.
Altcoin

SPA - Next Alt to MOON ??SPA is an altcoin that could make great increases in the near future.
Even though it's currently still trading under the moving averages in the Daily, once it turns there is good upside potential for this alt.
On the bright side, we observe higher lows for SPA:
One should also consider that this may be as good as it gets in terms of a low after the big dip, because a 47% correction is quite something:
IF that diagonal trendline of higher lows doesn't hold, I'd look at these zones next even if just for a wick:
And from here, we can really start to see BIG increases, IF you have the patience:
________________________
COINBASE:SPAUSD

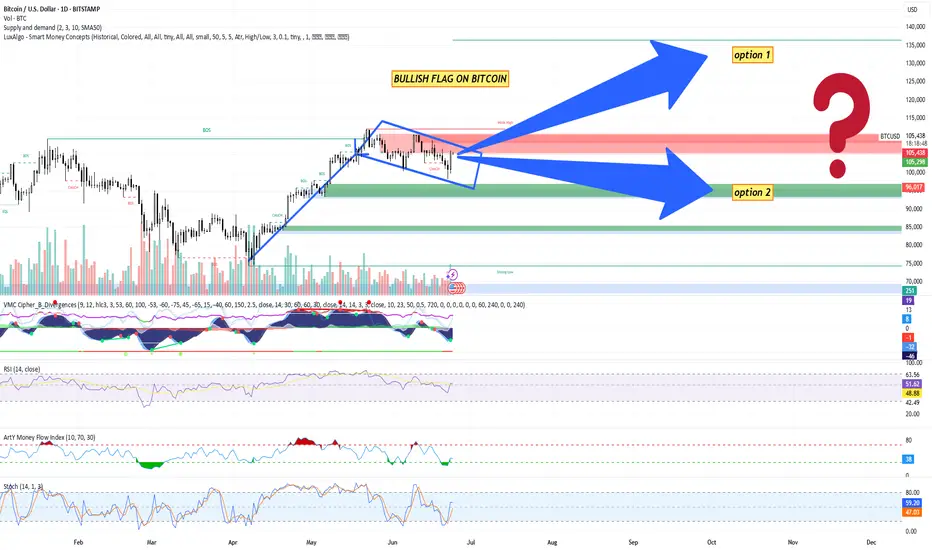
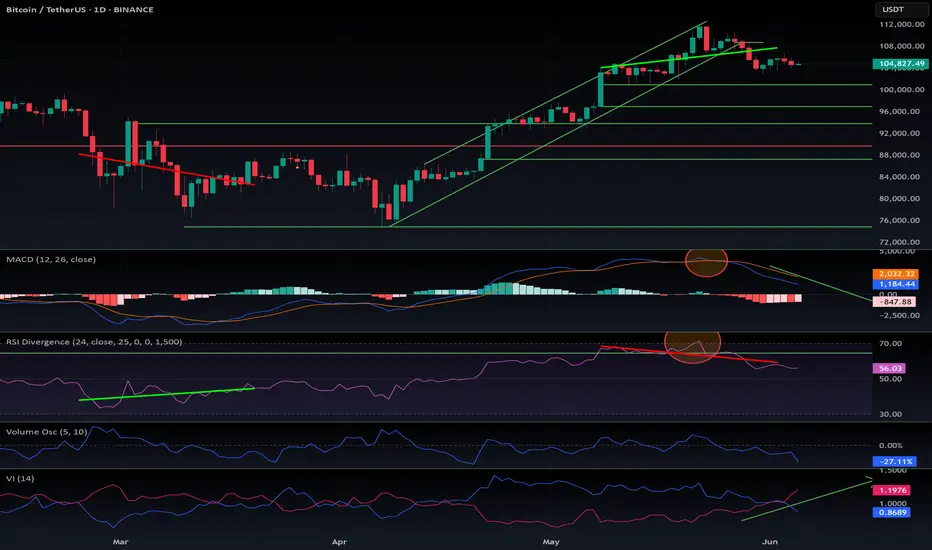
Bitcoin (BTC/USD) Technical Analysis + trade planBitcoin (BTC/USD) Technical Analysis – June 24, 2025
Pattern Identified: Bullish Flag Formation
A clear upward impulse leg followed by a downward-sloping consolidation (flag) indicates a continuation pattern.
The flag is bounded within a descending parallel channel, suggesting a potential breakout to the upside.
Break of Structure (BOS): Multiple BOS signals indicate strong market structure shifts favoring bullish continuation.
Change of Character (CHOCH): Minor CHOCH noted inside the flag, indicating local liquidity grabs but no trend reversal yet.
Key Levels
Current Price: ~$105,126
Flag Resistance: ~$105,291 (watch for breakout)
Major Supply Zone (Resistance): ~$115,000 (red zone)
Demand Zones (Supports):
$96,000 (minor)
$85,000 (medium strength)
$75,000 - $70,000 (strong low / high-confluence area)
Volume Analysis
Declining volume during flag formation supports the bullish flag hypothesis (low-volume pullback).
Anticipate increased volume on breakout for confirmation.
Indicators Summary
1. VMC Cipher B
Green dots signal potential local bottoms.
Wave trends support bullish reversal setup, though momentum still neutral.
2. RSI (14)
Current RSI: ~50.76
Neutral zone; not overbought/oversold – provides room for upside movement.
3. Money Flow Index (Art’y)
Positive inflow recovering, signaling accumulation phase.
4. Stochastic RSI
Blue line crossing above orange around 46. Indicates bullish crossover from the oversold region – early entry signal.
Bitcoin Trading Plan
Trading Bias: Bullish (Contingent on Flag Breakout)
Entry Plan
Breakout Entry: Enter long above $105,300 with confirmation (4H or daily candle close).
Aggressive Entry: Pre-breakout entry inside the flag at ~$104,000–$105,000, anticipating breakout.
Stop Loss
Conservative: Below $96,000 (below key support + 50 SMA).
Aggressive: Below $102,500 (inside flag, tighter stop).
Take Profit Levels
TP1: $110,000 (local high)
TP2: $115,000 (strong resistance zone)
TP3: $123,000–$125,000 (measured move from flag breakout target)
Measured Move Target: Height of the pole ($25K) added to the breakout zone ($105K) = Target zone: $130,000 (theoretical).
Alternative Scenario – Bearish Breakdown
If BTC breaks below $96,000, the bullish structure is invalidated.
In that case:
Look for short entries below $95,500.
Target zone: $85,000 – $75,000.
SL above $98,000.
Risk Management Guidelines
Risk per trade: 1–2% of capital
Use position sizing tools to determine trade size.
Monitor macroeconomic news (Fed, inflation, ETF flows) and crypto market sentiment.
To sum up things:
BTC is consolidating within a textbook bullish flag.
Momentum indicators align with a potential breakout.
Caution warranted until clear breakout occurs – volume confirmation is key.
Keep alert for fakeouts due to low summer volatility.
USDT.D LONG - MID TERM PLANUSDT.D is one of the best tools to understand what's happening in the crypto market.
It shows the dominance of USDT across the entire space — and has a strong inverse correlation with BTC and crypto assets.
Technicals:
USDT.D is approaching its long-term support trendline.
I expect a deviation below that line — possibly toward the 0.75 Fibonacci level — before a strong move up.
That move could last 1–3 months, which means more downside for alts during this time.
Plan:
Shorting altcoins — especially ETH-related tokens and memecoins.
Looking to buy back around early August.

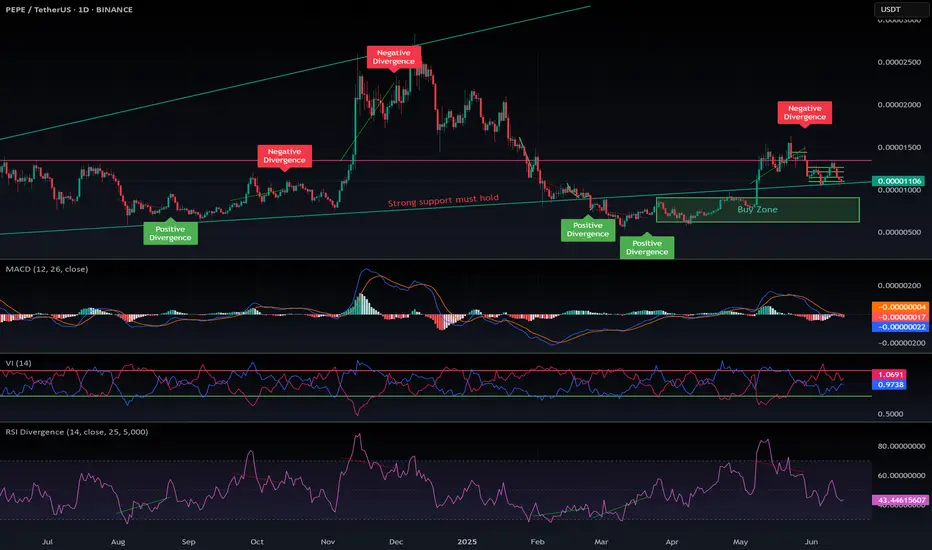
$PEPE follow up for June 2025Follow-up on my previous CRYPTOCAP:PEPE analysis — it played out exactly as expected.
CRYPTOCAP:PEPE remains my top meme coin, backed by some of the strongest tokenomics in the space. When altseason hits — if it hits — this one is primed to pump hard.
Like most altcoins right now, CRYPTOCAP:PEPE is in a short-term corrective pattern. That opens up another great opportunity to enter low and potentially ride a 2x or 3x move on the next leg up.
I’ve marked my usual buy zone. It may seem optimistic for now, but history shows how fast meme coins can dump… and then recover just as quickly. A drop into that green zone is entirely possible.
📲 Follow me for alerts — I’m monitoring CRYPTOCAP:PEPE daily. It’s one of my top picks.
DYOR.
Here was the previous analysis:
#PEPE #MemeCoin #Altseason #CryptoGems #BuyTheDip #Altcoins #CryptoTrading #Tokenomics #DYOR #CryptoAlerts
AERO: Clears the Runway! Can it gain altitude!?AERO gave a valid long setup
We were eye a possible retrace of an impulsive move and it displayed enough to trigger a rules-based entry.
Technical Breakdown
Key structural elements supported the setup:
Initial leg up showed impulse-like behavior
Pullback found support at a clearly defined AOI
Multiple MLT levels aligned with a common zigzag framework
Swift bounce off the Golden Corner Pocket (GCP)
Break and close above 0.54 completed the impulse structure
Prior resistance flipped into support
Volume confirmed the move, and price reached the first algo target, producing a reactive wick and confirming potential of algo activity.
This created a textbook TDU-style GCP/Algo/C-3 setup with measured entry and exit.
Risk Management
Partial profit was taken at the first MLT zone
Stop loss was moved into profit post-structure break
Scenario planning:
If move continues: positioned
If move stalls as a larger zigzag: no loss
Outlook
Attention now shifts to the next actionable level, possible second entry long
0.62 is the AOI for re-entry atm
Ideal scenario = Continuation in a wave 3, obvi
Alt scenario = Clean corrective to AOI + long
Bear scenario = Zig Zag complete
Conclusion
The trade played by the book!
Confluence across AOI, GCP, MLT, and volume created a qualified entry — not a guess.
This remains a great example of structure over sentiment and waiting for the market to meet criteria before engaging.

ETH - Do you Notice a Pattern here? I DO...Hello TradingView Family / Fellow Traders. This is Richard, also known as theSignalyst.
📈I find ETH 4h chart as it looks like history repeating itself.
Previously in 1 to 5 June, it formed a slight lower low before starting the next big bullish impulse leading towards the upper bound of the channel.
📚 Today, ETH just formed the slight lower low we are looking for.
Is it time for the next bullish impulse to start? well it will be confirmed after breaking above the last major high at $2,600.
What do you think?
📚 Always follow your trading plan regarding entry, risk management, and trade management.
Good luck!
All Strategies Are Good; If Managed Properly!
~Rich

GateChain Slows Down Within An Impulsive Bullish TrendGateChain with ticker GTUSD came slightly lower, but we still see it trading in a higher degree wave »iv« correction that can resume the bullish trend for wave »v«. It can be actually finishing final subwave (c) of a three-wave (a)(b)(c) corrective decline, so keep an eye on strong support here at the former wave (iv) swing low and 38,2% Fibonacci retracement. If we get sharp rebound and impulsive rise back above channel resistance line near 20 bullish confirmation level, then we can easily expect further rally within final wave »v« of 5 this year, which can push the price even up to 35 – 40 target area.

0x0 About to Explode? A Bullish Reversal No One Is Talking AboutYello, Paradisers! Are you watching this breakout on #0x0? Because if you blink, you might miss the start of a major trend reversal that’s been quietly forming for months.
💎After a prolonged downtrend, 0x0 is finally showing signs of life. The price has completed a multi-month bottoming structure, forming a textbook inverse head and shoulders, a classic reversal signal that is known for its reversal strength.
💎Currently, 0x0 is starting to push through a critical zone between 0.1080 and 0.1180, a region that previously acted as strong resistance. This zone also aligns perfectly with the neckline of the inverse head and shoulders and is now being flipped into support — a bullish development.
💎Even more importantly, price is now breaking above the EMA-200, a long-term trend indicator that often marks the transition from bearish to bullish sentiment. This EMA break gives even more credibility to the reversal setup.
💎For #0x0USDT the descending resistance at $0.1500 is the next key level. A confirmed breakout above this level would signal a shift from bullish to aggressively bullish, opening the door for a quick push towards the initial target at $0.1650, where moderate resistance is expected.
💎However, based on the strength of the current structure and the inverse head and shoulders pattern, 0x0 has the potential to rally much further, with the primary target sitting in the $0.21 to $0.23 range. This target zone also aligns with the 50% Fibonacci retracement of the full downtrend, making it a highly probable magnet for price if momentum accelerates.
Paradisers, strive for consistency, not quick profits. Treat the market as a businessman, not as a gambler.
MyCryptoParadise
iFeel the success🌴

HolderStat┆ETHUSD accumulationBYBIT:ETHUSDT is compressing in an ascending triangle, pivoting around 2 500. A decisive break above 2 520 tees up 2 800–2 900 continuation, while closing back under 2 430 would negate the immediate setup but leave macro structure bullish.

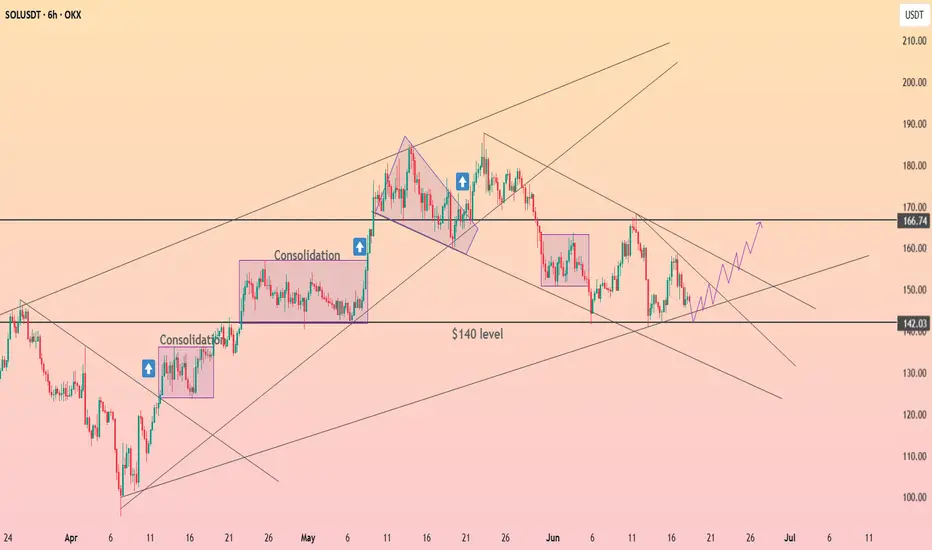
HolderStat┆SOLUSD accumulation before growthOKX:SOLUSDT respects the $140 axis and tests the roof of its falling channel. Holding that shelf lets bulls aim for 160-170 and keeps the broader up-channel alive; a dip under 135 would postpone the rally but not derail the long-term trend ⚡️
OP / USDT 4hr PUMP INCOMING? OP/USDT – 4H Chart Summary
Market Structure:
4H Timeframe:
- Price consolidating within a descending triangle/wedge pattern, indicating potential buildup before a breakout.
- Lower Timeframes (1H and below): Bearish trend structure with lower highs and lows.
- OBV (On-Balance Volume): Forming a wedge—suggesting accumulation or distribution phase nearing a breakout.
Key Zones:
Demand Zone (Support):
- 0.5483 – 0.6351
This area has provided strong support historically. A clean break below could signal continuation of the larger downtrend.
Supply Zone (Resistance):
- 0.9068 – 1.0414
-Historically rejected price; high probability of reversal or consolidation if revisited.
Fair Value Gaps (FVG):
- FVG 1: 0.6659 – 0.6838
- FVG 2: 0.7024 – 0.7308
These inefficiency zones are likely to attract price if bullish momentum builds. Watch for potential short-term rejection or continuation setups here.
Volume Profile:
Strongest volume node (high liquidity zone) sits between 0.7470 – 0.8000
Suggests this area has been heavily traded and may act as magnet/resistance if approached again.
Fibonacci Confluence:
Previous swing high at 0.8232 aligns with the 0.618–0.65 golden pocket
A critical zone for potential take-profit or trend reversal on a breakout.
Scenarios:
Bullish Case:
If price holds above 0.6351 and bounces, look for:
- Retest of FVG 1, followed by FVG 2.
- Breakthrough of 0.7308 could target the golden pocket and swing high at 0.8232.
- Sustained bullish move may reach the supply zone above 0.9068.
Bearish Case:
- Breakdown below 0.6351 and especially below 0.5483 would:
- Invalidate the wedge support.
- Confirm continuation of the macro downtrend.
-Open room for new lows and bearish expansion.
Conclusion:
Price is at a key decision point inside a wedge.
Reaction at 0.6351 is critical—support bounce targets higher inefficiencies; breakdown signals deeper bearish continuation.
OBV and volume structure suggest an imminent volatility spike—prepare for a breakout.

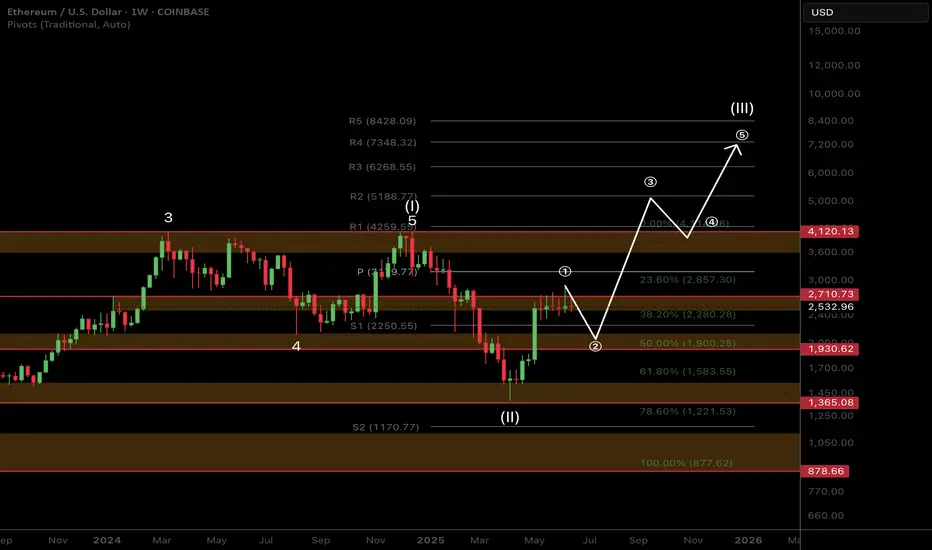
ETH Macro Analysis☕ 𝙂𝙈. CRYPTOCAP:ETH Macro analysis update...
📈 𝙇𝙤𝙣𝙜 𝙩𝙚𝙧𝙢 outlook remains unchanged and recent price action printing a doji. Target is still $7k for this cycle.
📉 𝙎𝙝𝙤𝙧𝙩 𝙩𝙚𝙧𝙢 outlook has investors looking lower towards the $1900 target but this isn't guaranteed to be reached and price action may front tat $2200.
War escalation's and retail selling are keeping price suppressed. ETF inflows and staking continue to grow!
The time for patience continues. Money is made in the sitting, weathering volatility, not flipping in and out of trades on every bit of news and price movement
𝙏𝙚𝙘𝙝𝙣𝙞𝙘𝙖𝙡 𝘼𝙣𝙖𝙡𝙮𝙨𝙞𝙨
Price is consolidating at its recent highs. Consolidation under resistance has high probability of breaking out, the longer it remains the higher the probability.
Elliot Wave (EW) analysis suggests a motif wave ended at the $2700 resistance, with a wave 2 retracement underway, likely a shallow one.
Safe trading
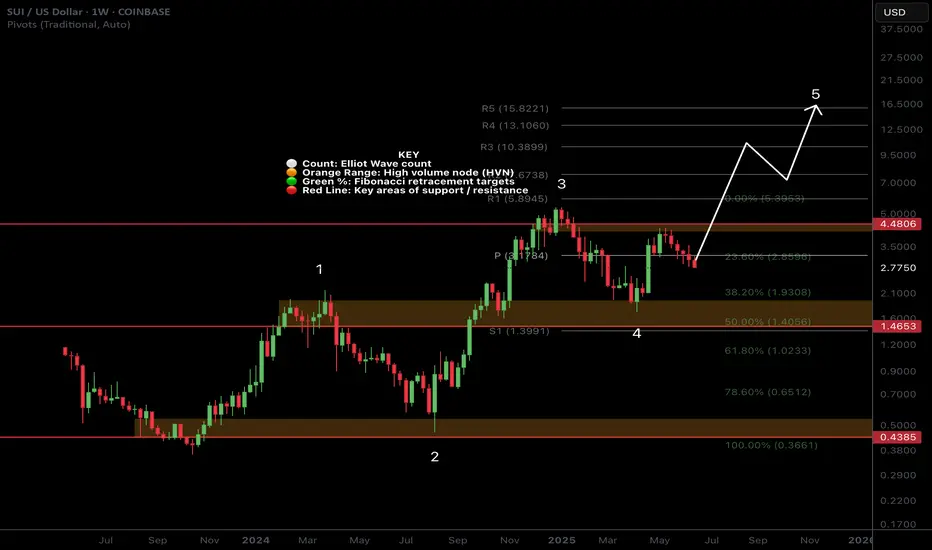
SUI Macro AnalysisCRYPTOCAP:SUI macro analysis update...
📈 𝙇𝙤𝙣𝙜 𝙩𝙚𝙧𝙢 outlook shows price action still outperforming most alts with a great rally recently. Target remains the R5 weekly pivot at $15
📉 𝙎𝙝𝙤𝙧𝙩 𝙩𝙚𝙧𝙢 outlook has price pulling back, looking to find a bottom between $2.3-2.65
War escalation's and retail selling are keeping price suppressed as price changes hands to private companies and large wallets.
The time for patience continues. Money is made in the sitting, weathering volatility, not flipping in and out of trades on every bit of news and price movement
𝙏𝙚𝙘𝙝𝙣𝙞𝙘𝙖𝙡 𝘼𝙣𝙖𝙡𝙮𝙨𝙞𝙨
Price is testing the weekly pivot and daily S1 pivot as support
Elliot Wave (EW) analysis was a strong, textbook motif wave with a wave 2 retracement underway. Wave 2 often extends to the 61.8 Fibonacci retracement of $2.4 but the alt-coin golden pocket is the 78.6 at $2.03. No surprises if we see that area revisited and could be a great buying opportunity.
Price has lost the daily 200EMA and DEMA which is bearish short term.
Safe trading
XRP - Trade The Range!Hello TradingView Family / Fellow Traders. This is Richard, also known as theSignalyst.
📈XRP has been trading within a range between $2 and $2.35 in the shape of a flat rising broadening wedge pattern in red.
🏹 The highlighted blue circle is a strong area to look for buy setups as it is the intersection of the green support and lower red trendline acting as a non-horizontal support.
📚 As per my trading style:
As #XRP approaches the blue circle zone, I will be looking for bullish reversal setups (like a double bottom pattern, trendline break , and so on...)
📚 Always follow your trading plan regarding entry, risk management, and trade management.
Good luck!
All Strategies Are Good; If Managed Properly!
~Rich

ETH is doing it AGAIN!Hello TradingView Family / Fellow Traders. This is Richard, also known as theSignalyst.
📈ETH has been overall bullish trading within the flat rising channels marked in blue.
Moreover, the green zone is a strong support zone!
🏹 Thus, the highlighted blue circle is a strong area to look for buy setups as it is the intersection of support and lower blue trendlines acting as non-horizontal support.
📚 As per my trading style:
As #ETH approaches the blue circle zone, I will be looking for bullish reversal setups (like a double bottom pattern, trendline break , and so on...)
📚 Always follow your trading plan regarding entry, risk management, and trade management.
Good luck!
All Strategies Are Good; If Managed Properly!
~Rich

Sell Bitcoin and buy Altcoins!🚨 Controversial Take Ahead – Packed With High-Value Insights 🚨
Let’s dive deep.
👨💻 A bit about me:
I’ve been riding the tech wave since the beginning:
Programmed video games in the 80s and 90s
Built VSTi plugins in the early 2000s
Started creating websites when Internet Explorer 1.0 launched
Sold 3D assets when Unity 2.5 (first PC version) dropped
Launched my own blockchain in 2016
Deployed smart contracts on TRON in 2018
I don’t follow trends—I predict them. My instincts are backed by decades of hands-on experience.
Now, here’s what I see coming:
⚠️ 1. Sell Your Bitcoins
Yes, Bitcoin is obsolete. It’s a technology—not a precious metal—and like all tech, it must evolve or die.
Ask yourself:
Do you use a Blackberry today?
Still flying in 1930s planes?
Gaming on an Atari or Commodore 64?
Surfing the web with Lycos or Altavista?
No? Then why are you betting on a 2009 technology?
Most people don’t even understand how Bitcoin works—ask around what SHA256 or RSA means.
Crypto is misunderstood, and that’s dangerous.
Back in 1998, I created the UPL library, which handled data compression & encryption using all major algorithms—Huffman, LZSS, DES, RSA, etc. I’m not just throwing words around—I’ve built this stuff.
Politicians and financial institutions (yes, even Saylor) are 15 years late to Bitcoin. They're missing the truth: BTC’s upgrades failed (Ordinals, Runes, etc). Its value holds due to FOMO from the uninformed, not innovation.
One day, your Bitcoins will be as worthless as mp3.com stock. That’s not opinion—that’s technological reality.
🪙 2. Buy Altcoins
Not every altcoin is a winner—but that’s where the real opportunity is.
Remember:
Nokia and Blackberry ruled before Samsung and Xiaomi.
The next Amazon, Google, or Nvidia already exists—and it's trading for pennies.
When people laugh at altcoins, that’s the time to buy low.
Altcoins like CRYPTOCAP:SOL , CRYPTOCAP:SUI , MIL:UNI could 100x… even 100,000x.
Bitcoin might double—and then crash.
Smart traders buy when everyone else is mocking.
🌍 3. Consequences of the BTC Collapse
This collapse will come at a turning point in global power.
Wall Street and U.S. states are heavily exposed to BTC. If it crashes, the Western financial system could implode—a dot-com-level disaster.
China, on the other hand, is stable, adaptive, and tech-forward.
Crypto without staking, DeFi, NFTs, GameFi, smart contracts? That’s not the future—that’s Bitcoin. Altcoins are the future.
Bookmark this post. Re-read it in 10 years.
You’ll remember I said it first: Innovation is unstoppable.
Enjoy the last Bitcoin pump. Then watch what comes next.
DYOR.
#CryptoRevolution #AltcoinSeason #BitcoinCollapse #Web3Future #BlockchainInnovation #SellBitcoin #BuyAltcoins #CryptoTruth #DeFi #GameFi #SmartContracts #CryptoShift #UnstoppableInnovation
AERO: Take Off!?If you find this information inspiring/helpful, please consider a boost and follow! Any questions or comments, please leave a comment!
Long Entry at $0.515
Recap
SPARKS:AERO caught a bid after Coinbase news hit, but world events quickly clipped the rally’s wings. Price bounced cleanly off the .48 level, which aligned with an Area of Interest (AOI), a Level of Interest (LOI), and a golden zone retracement displayed in the last analysis.
Explanation
The .48 level was key and the reaction was textbook. The Coinbase news provided a catalyst just as price reached the .55 level. However, macro uncertainty remains a headwind.
Now, all eyes are back on .55. Bulls need to defend this structural level. The current pierce of .75 is an encouraging move. Continuation and a proper flip of that level would keep confidence high. Wave 3s are a sight to see, so a retrace may not even occur if price simply sends. Still, while AERO stood up and moved counter to the broader market when world news dropped, that alone may not be enough if global bearish reactions continue.
Outlook
Entry projected in the previous analysis has played out in ideal fashion, but the market remains fluid. Key levels:
.75 recent break
.55 ideal hold
.48 impulse invalidation
Current trend at the lesser degree is up and holding higher lows. Next objective: take out the .80 pivot and change the trend at the higher degree.
Break of the higher lows at the lesser degree would be the first sign of weakness. I’m watching for a definitive correction for a potential long add. A swift move that breaks higher lows could signal danger to bulls.
Trade Safe!
Trade Clarity!

KAS-USDT (Bybit spot), 4-hour candles TA+Trade plan1. Market context & chart structure
Asset / venue / timeframe: KAS-USDT (Bybit spot), 4-hour candles, data to 12 Jun 2025 06:45 UTC (see image).
Primary pattern in play: Price has compressed into a contracting (symmetrical) triangle that began after the 28 May low. The apex is only ~1–2 candles away, so a decisive break is statistically imminent.
Preceding structure:
17-day descending channel → capitulation into a falling-wedge reversal (27–28 May).
Two-legged double-bottom (“Bottom 2”) at 0.075–0.078 USDT.
Sideways rectangle 29 May-7 Jun, now morphing into the present triangle.
Key horizontal levels (4 h closes): 0.0930 (upper triangle rail / neckline) · 0.0891 (local supply) · 0.0797 (strong demand / wedge base) · 0.0620 (monthly support)
Volume picture: Realised volume has been drying up since 31 May, a classic pre-breakout contraction. A spike on the break will confirm direction.
2. Indicator read-out
Market Cipher B - Green momentum wave printing, money-flow bars just turned positive Mildly bullish, Early bull divergence vs 28 May
RSI(14) - 46 and curling up - Neutral-to-bullish Hidden bullish divergence vs price higher-lows
Stoch RSI 26/24 and crossing up from oversold Bullish Momentum reset complete
ArTy Money-Flow Index +3.5 and rising Bullish Positive inflow after five sessions of outflow
Collectively the oscillators favour an upside resolution, provided volume confirms.
3. Scenario probability matrix
Scenario Trigger & confirmation
Option 1 – Uptrend continuation
4 h close ≥ 0.0925 USDT with volume ≥ 2× 20-period average
Measured-move 0.107 → 0.118;
extended fib 1.618 ≈ 0.125–0.128
Est. probability: 60 %
Option 2 – Downtrend resumption
4 h close ≤ 0.079 USDT with similar volume spike 0.072 (range EQ) → 0.067–0.062 structural support
Est. probability: 40 %
Weighting derives from: oscillator bias, shrinking supply above 0.092 (order-book heat-map), but tempered by external models calling for a short-term dip toward 0.067 USDT
4. Trading plan
Component Long (Option 1) Short (Option 2)
Entry Buy stop 0.0926 USDT Sell stop 0.0789 USDT
Initial stop-loss 0.0838 USDT 0.0870 USDT (back inside triangle)
Primary target-1 0.1050 (≈1R) 0.0725 (≈1R)
Secondary target-2 0.1180 (≈2.5R) 0.0670 (≈2.5R)
Position size Risk ≤ 1 % of account per trade (adjust contracts accordingly)
5. Additional catalysts & risk factors
Macro-beta: BTC dominance and broad market risk-on / risk-off could swamp pattern-based setups; monitor DXY and SPX correlations.
Protocol news: Kaspa’s DAG-based roadmap upgrades and potential exchange listings remain upside catalysts. Conversely, lack of progress or regulatory headlines could accelerate a downside break.
kaspa.org
Weekend liquidity gaps: KAS often shows slippage outside US trading hours; consider reducing size or using wide stops if breakout occurs late Friday–Sunday.
6. To sum up
Bias: I lean 60 % toward Option 1 (bullish breakout) provided we get a 4 h close above 0.092 with volume confirmation. Otherwise, a flush to the 0.07 area (Option 2) is the alternative. Trade the break, not the prediction, and keep risk tight.

others - altcoins It looks like the altcoin season is about to begin and we will witness an alt party or alt season.

GRT | Altcoins | MASSIVE UPSIDE Potential on The GraphAnother altcoin that has great upside potential is the Graph BINANCE:GRTUSDT
The Graph from a weekly perspective may seem like there's not much action, but if you zoon in to the daily timeframe we see a different picture.
WEEKLY:
VS DAILY:
We can see anything from a +40% increase to a -30% dip in just a few days; a picture that is lost when we look at the weekly. This is IDEAL for swing trading.
Once you've established the general direction from the MACRO, swing trades become very viable (spot). If your patient enough to wait for a few days, a +30% could easily be achieved within a two week timespan.
______________________
BINANCE:GRTUSDT

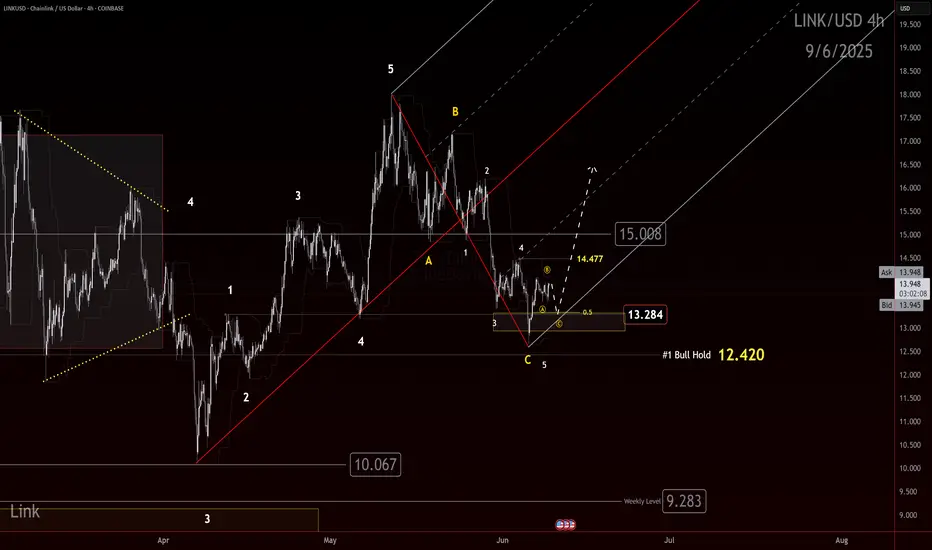
LINK Bulls Building Toward a Chain ReactionIf you find this information inspiring/helpful, please consider a boost and follow! Any questions or comments, please leave a comment!
LINK just gave us a clean reaction out of an identified box. Bulls may finally be gaining control and a trend shift up is on the table.
We had eyes on this box for a potential reaction. The market delivered. Now bulls need to prove they can build on it. The first key is to defend 13.284. As long as this level holds, the case for a higher trend remains alive.
Next, bulls need to clear 14.47. That is the first smaller degree LH that must be taken out to confirm that buyers are pushing through the structure.
The big step remains 15.00. This has acted as a major flipping level. A true test for the bulls will be whether they can reclaim and hold above it. If they do, the door opens for stronger upside follow through.
The path is clear:
💥 Hold 13.284
💥 Break 14.47
💥 Reclaim 15.00
We will continue to track this closely with the Elliott Scanner mindset. If momentum picks up through these levels, this could become an attractive higher-degree setup.
Watch these levels carefully. Bulls have work to do, but the ingredients for a shift are building.
Trade Safe!
Trade Clarity!
TOTAL3 – Altcoin Market Cap (Excluding BTC & ETH) Weekly TF 2025Summary
TOTAL3 is currently in a macro bullish cycle and undergoing a mid-cycle correction. The chart presents a Fibonacci-based structural roadmap with 3 Take Profit zones, identifying both correction supports and breakout targets. There is a high probability of short-term downside before a significant altcoin rally.
🌈 Chart Context
Fibonacci Retracement (Primary Leg):
100% = 285.3B
0% = 1.16T
Trend-Based Fibonacci Extension
A = 285.3B
B = 775B
C = 464.11B
Price as of analysis: ~845.62B
Key Technical Observations
Support Levels:
61.8% Fib Retracement = 618.5B
Strong Confluence Zone: Fib Retracement 48% + Fib Extension 50–61.8% (highlighted on chart)
38.2% Fib Retracement = 824.38B
Resistance Levels:
951.73B: 23.6% Retracement + 100% Extension – strong resistance zone before $1T psychological level
Take Profit Zones:
1 TP (1.1T) = 127% Fib Extension (Upper leg of parallel extension)
2 TP (1.28T) = 161.8% Fib Extension
3 TP (1.7T) = -61.8% Fib Retracement and 261.8% Extension confluence zone
Pattern & Projection:
The structure suggests a possible correction phase to lower support before continuation.
Bullish continuation expected after corrective phase, shown by the projected dotted path.
Structure: Bullish structure with healthy correction in mid-phase of the macro uptrend.
Fundamental Context
Altcoin Lag: TOTAL3 remains ~40% below its ATH, while BTC and ETH have already hit new highs.
Liquidity Shift Expected: Altcoin capital rotation tends to follow after BTC dominance stabilizes or drops.
Macro Backdrop:
Fed expected to cut rates later in 2025
Stablecoin legislation and ETF narratives building altcoin trust
Institutional inflows are slowly diversifying from BTC to ETH and large-cap alts
These suggest a possible shakeout or deeper correction before altseason breakout gains strength.
Bias & Strategy Implication:
Bias: Bullish Mid-Term – Correction Before Continuation
Expected Scenario: Pullback to strong support zones (824B–733B–618B), followed by a sustained breakout toward 1.1T–1.7T.
Invalidation: Weekly close below 618B may delay bullish structure and extend correction.
Strategy:
Long entries at support zones with tight invalidation
Scaling out near TP1, TP2, TP3 based on market momentum
Philosophical View
Patience is the virtue of the second leg in a macro trend. The correction serves to eject the impatient, reprice risk, and strengthen conviction. When TOTAL3 rises from deep support, it will be not just price but confidence that rallies.
Related Reference Charts
TOTAL Market Cap Structural Breakout:
TOTAL2 Altcoin Chart with Fibonacci Path:
✅ Tags
#TOTAL3 #AltcoinMarket #Fibonacci #Altseason #CryptoCorrection #CryptoMacro #TechnicalAnalysis #BullishOutlook #MidCycleCorrection #Crypto2025
⚠️ Notes & Disclaimers
This analysis is educational and not financial advice. Markets are inherently risky. Do your own research and manage risk accordingly.
