XLMUSDT Potential UpsidesHey Traders, in today's trading session we are monitoring XLM/USDT for a buying opportunity around 0.2730 zone, XLM/USDT is trading in an uptrend and currently is in a correction phase in which it is approaching the trend at 0.2730 support and resistance area.
Trade safe, Joe.
Altcoin

ALTCOIN BOOM FOR CHINTAI 2025-2026 PROPOSALCHEX (Chintai) is a blockchain platform focused on tokenizing real-world assets (RWA) like real estate, carbon credits, and private equity. It’s built to streamline compliant digital securities trading, targeting institutions and enterprises that need regulatory-friendly solutions. Think of it as the "bridge" between TradFi and DeFi, emphasizing compliance without sacrificing blockchain’s efficiency.
Recent News
Chintai secured a key regulatory approval in Singapore this month, enabling it to operate as a licensed digital asset custodian.
Partnership with a major Asian bank to tokenize $500M in carbon credits.
CHEX token surged 40% in July, outpacing the broader market.
Deep Dive
RWA tokenization is crypto’s hottest narrative in 2024, and CHEX is positioning itself as a compliance-first player. The Singapore license is a big deal because it signals trust in strict jurisdictions. Meanwhile, carbon credit deals align with ESG trends, attracting institutional capital. However, competition is fierce (Polymath, Ondo), so execution is critical.
Latest Tech or Utility Update
Update Details
Chintai rolled out "Multi-Chain Settlement," allowing assets to move across Ethereum, Polygon, and XRPL. They also introduced dynamic compliance tools for issuers, automating KYC/AML checks.
Implications
Multi-chain support reduces friction for institutions using diverse networks. The compliance tools lower barriers for TradFi adoption, but centralized control over KYC might clash with DeFi purists. Still, this cements CHEX as a go-to for regulated entities.
Biggest Partner & How Much Was Invested
Partnership Spotlight
Standard Chartered Bank invested $10M in Chintai’s infrastructure development over 2 years.
Impact Analysis
Standard Chartered brings credibility and a massive client base. The investment likely funds RWA tokenization pipelines in Asia and Europe. If successful, this could make CHEX a default platform for banks dipping into blockchain.
Most Recent Added Partner & Details
New Collaboration
Chintai teamed up with ClimateTrade (carbon offset platform) to tokenize $200M in renewable energy credits. No direct investment, but revenue-sharing for 3 years.
Future Prospects
This taps into the booming ESG investment sector. Short-term, it boosts CHEX’s volume; long-term, it could anchor CHEX as a climate-focused RWA leader.
Tokenomics Update
Token Dynamics
Reduced max supply by 5% via buybacks funded by platform fees.
Staking APY increased to 12% (up from 8%) to incentivize holding.
New burn mechanism: 0.5% of transaction fees destroyed quarterly.
Deep Analysis
Scarcity + staking rewards = bullish combo. The burn mechanism is modest but signals commitment to deflation. However, staking rewards depend on platform revenue growth. If adoption lags, APY could drop, triggering sell pressure.
Overall Sentiment Analysis
Market Behavior
Traders are accumulating CHEX, with exchange reserves dropping 15% this month. Social volume spiked 200% after the Singapore license news.
Driving Forces
Hype around RWA + regulatory wins. Fear of missing out (FOMO) is real, but some worry CHEX’s centralized compliance tools could limit DeFi appeal.
Deeper Insights
Sentiment is overly reliant on partnerships and regulation. A regulatory setback or failed institutional adoption could crater momentum.
Recent Popular Holders & Their Influence
Key Investors
Amber Group bought 2M CHEX tokens this month.
A crypto VC, HashKey Capital, increased its stake by 30%.
Why Follow Them?
Amber Group is known for front-running institutional trends. HashKey’s bet aligns with Asia’s pro-RWA regulatory shift. Their moves suggest confidence in CHEX’s regulatory edge.
Summary & Final Verdict
Recap
CHEX is riding the RWA wave with strong compliance tech, high-profile banking partners, and deflationary tokenomics. Its focus on carbon credits and Asia’s markets gives it a niche edge.
Final Judgment
CHEX has gem potential , but only if it maintains regulatory momentum and scales adoption. The tokenomics are solid, and partnerships are elite, but it’s still a "bet on institutions adopting crypto."
Considerations
Can CHEX stay ahead of RWA competitors?
Will institutions actually use the platform, or is this just partnership theater?
How sensitive is CHEX to crypto’s macro trends vs. its own fundamentals?
If you’re bullish on TradFi adoption, CHEX is a hold. If you think RWA is overhyped, tread carefully.

ALTCOIN BOOM FOR PEAQ NETWORK 2025-2026 PROPOSALWhy This Asset?
Core Info: Peaq Network is a blockchain built for DePIN (Decentralized Physical Infrastructure Networks), enabling machines, IoT devices, and users to collaborate in decentralized ecosystems. Think of it as the "backbone" for real-world infrastructure like energy grids, mobility networks, and connected devices.
Recent News:
Mainnet Launch: Peaq went live on mainnet in June 2024, marking its shift from testnet to full decentralization.
Partnership with Fetch.ai: Integrating AI-powered autonomous agents to optimize machine-to-machine (M2M) transactions.
Ecosystem Grants: $15M fund announced to onboard DePIN builders (e.g., solar energy grids, EV charging networks).
Deep Dive:
PEAQ is riding the DePIN megatrend, which analysts predict will be a $3.5T market by 2030. Its focus on real-world utility sets it apart from "pure DeFi" chains.
Latest Tech/Utility Update
Update: Mainnet launch + Machine ID feature, which assigns decentralized identities to IoT devices for secure interactions.
Implications:
For Users: Developers can build DePIN apps faster (e.g., decentralized Uber rivals, community-owned 5G networks).
For Investors: Mainnet reduces "vaporware" risk. Machine ID could become a industry standard for IoT security.
Biggest Partner & Investment
Partner Spotlight: Fetch.ai (AI/blockchain leader) merged its autonomous agents with Peaq’s DePIN infrastructure.
Deal: Strategic collaboration (no $$ disclosed), but Fetch’s tech stack adds AI-driven decision-making to Peaq’s IoT networks.
Impact: Fetch.ai’s 200+ enterprise partnerships give Peaq instant credibility in AI x IoT verticals. This is a long-term play for smart cities and Industry 4.0.
Most Recent Added Partner
New Collab: Silencio (noise pollution data network) migrated to Peaq to build a decentralized environmental monitoring system.
Deal: $2M investment over 18 months.
Future Prospects: Silencio’s 500k+ users bring real-world data flows to Peaq, but adoption depends on proving DePIN’s cost efficiency vs. traditional models.
Tokenomics Update
Changes:
Staking: 12-15% APY for securing the network, with rewards locked for 30 days to prevent dumping.
Supply: Fixed at 4.2B tokens, with 60% allocated to ecosystem growth (grants, staking rewards).
Analysis: High staking APY attracts early holders, but long-term sustainability hinges on DePIN adoption. Only 10% of tokens are circulating, so watch for unlocks from team/advisor wallets.
Overall Sentiment Analysis
Market Behavior: Neutral. PEAQ is up 25% since mainnet, but trading volume remains low ($2M daily). Whales are accumulating quietly.
Driving Forces:
Bullish: DePIN narrative gaining steam, Fetch.ai partnership, real-world use cases.
Bearish: Niche focus (IoT/DePIN) limits hype compared to AI/meme coins. Competitors like Helium and IOTA have bigger communities.
Insight: Sentiment is cautiously optimistic. PEAQ isn’t a "moonbag" play, but its fundamentals could shine in a bear market where utility matters.
Recent Popular Holders & Their Influence
Key Investors:
Borderless Capital (DePIN-focused VC) added PEAQ to its portfolio, signaling institutional confidence.
MEXC Exchange accumulated 5M tokens, likely for future liquidity provision.
Why Follow Them: Borderless Capital’s bets often align with long-term infrastructure trends, not short-term pumps.
Summary & Final Verdict
Recap: PEAQ is a high-conviction DePIN bet with a working mainnet, strong partners (Fetch.ai), and real-world use cases. Its success depends on onboarding builders who can prove DePIN’s economic advantages.
Verdict: PEAQ is a patient investor’s play. It won’t pump 10x overnight, but it’s one of the few projects bridging crypto with trillion-dollar physical industries. High risk (low adoption so far), but asymmetric upside if DePIN explodes.
Final Thought: If you believe blockchain will underpin future infrastructure, PEAQ deserves a portfolio slot. If you need instant gains, skip it.

XRP is so BACK!Hello TradingView Family / Fellow Traders. This is Richard, also known as theSignalyst.
As per our last XRP idea, attached on the chart, it rejected the lower green structure and surged by over 25%.
📈XRP is now bullish long-term trading within the rising channel marked in blue.
Moreover, the upper green zone is a strong structure!
🏹 Thus, the highlighted blue circle is a strong area to look for buy setups as it is the intersection of structure and lower blue trendline acting as a non-horizontal support.
📚 As per my trading style:
As #XRP retests the blue circle zone, I will be looking for bullish reversal setups (like a double bottom pattern, trendline break , and so on...)
📚 Always follow your trading plan regarding entry, risk management, and trade management.
Good luck!
All Strategies Are Good; If Managed Properly!
~Rich

ETH is still Bullish!!Hello TradingView Family / Fellow Traders. This is Richard, also known as theSignalyst.
📈This week, ETH has been in a correction phase. However it is still overall bullish long-term trading within the rising channel marked in blue.
Moreover, the green zone is a strong demand and structure.
🏹 Thus, the highlighted blue circle is a strong area to look for buy setups as it is the intersection of structure and lower blue trendline acting non-horizontal support.
📚 As per my trading style:
As #ETH retests the blue circle zone, I will be looking for bullish reversal setups (like a double bottom pattern, trendline break , and so on...)
📚 Always follow your trading plan regarding entry, risk management, and trade management.
Good luck!
All Strategies Are Good; If Managed Properly!
~Rich

LINK/USDT is Nearing The UptrendHey Traders, in today's trading session we are monitoring LINK/USDT for a buying opportunity around 15.20 zone, LINK/USDT is trading in an uptrend and currently is in a correction phase in which it is approaching the trend at 15.20 support and resistance area.
Trade safe, Joe.

AVAX Potential UpsidesAVAX/USDT is currently trading within a broader uptrend and is in a corrective phase. The price is approaching the 24.60 level, a key support and resistance area that aligns with the prevailing trend structure. This zone may offer insight into potential market reaction and the strength of the ongoing trend.

ETH => Shift In Momentum Almost Done!Hello TradingView Family / Fellow Traders. This is Richard, also known as theSignalyst.
📉 Since breaking below its last major low in December 2024, Ethereum (ETH) has been stuck in a bearish trend.
But don’t lose hope, bulls! 🐂
⚠️It’s evident from the last correction phase, marked in blue, that it's larger than the previous ones — a clear sign that the bulls are stronger than ever.
A growing correction phase is often the first signal of an upcoming momentum shift.
This shift will be confirmed once ETH breaks above the last major high marked in red at $2,100.
📈A break above $2,100 would flip ETH’s trend from bearish to bullish, signaling the potential start of the Altcoin season!
Until then, patience is key. 🧘♂️
📚 Always follow your trading plan regarding entry, risk management, and trade management.
Good luck!
All Strategies Are Good; If Managed Properly!
~Rich

Solana Potential UpsidesHey Traders, in today's trading session we are monitoring SOL/USDT for a buying opportunity around 157 zone, Solana is trading in an uptrend and currently is in a correction phase in which it is approaching the trend at 157 support and resistance area.
Trade safe, Joe.

Ripple Potential UpsidesHey Traders, in today's trading session we are monitoring XRP/USDT for a buying opportunity around 2.50 zone, XRP/USDT is trading in an uptrend and currently is in a correction phase in which it is approaching the trend at 2.50 support and resistance area.
Trade safe, Joe.

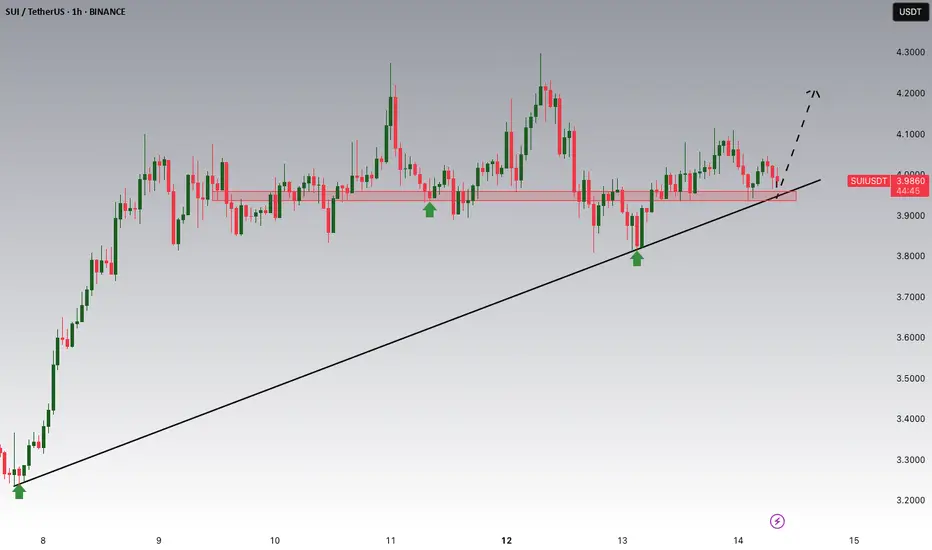
SUI/USDT Potential UpsidesHey Traders, in today's trading session we are monitoring SUI/USDT for a buying opportunity around 3.94 zone, SUI/USDT is trading in an uptrend and currently is in a correction phase in which it is approaching the trend at 3.94 support and resistance area.
Trade safe, Joe.
INJUSDT Potential UpsidesINJUSDT is currently trading within a broader uptrend and is in a corrective phase. The price is approaching the 13.20 level, a significant support and resistance area that aligns with the prevailing trend structure. This zone may offer useful context for observing market behavior and assessing the strength of the ongoing trend.
Trade safe, Joe.

IOTA Could Be On The Way Back To December 2024 HighsIOTA with ticker IOTUSD made sharp and impulsive rally at the end of 2024, which we see it as a first leg (A)(1) of a bigger recovery in minimum three waves (A)(1)-(B)(2)-(C)(3). Since the beginning of 2025, Crypto market slowed down and IOTA made a deep retracement, but in three legs ABC with an ending diagonal/wedge pattern into wave C, which indicates for a correction in wave (B)(2).
Well, it nicely bounced recently, making a clean five-wave impulse away from projected 78,6% Fibonacci support and back above channel resistance line, so it can be wave 1 of a new five-wave bullish cycle within higher degree wave (C) or (3). That said, after current pullback in wave 2, be aware of more gains for wave 3 of a five-wave bullish cycle that can send the price back to December 2024 highs this year.

BNB/USDT Potential UpsidesHey Traders, in today's trading session we are monitoring BNBUSDT for a buying opportunity around 630 zone, BNBUSDT is trading in an uptrend and currently is in a correction phase in which it is approaching the trend at 630 support and resistance area.
Trade safe, Joe.

Kaspa on Its Path to Glory (TA + Trading Plan) + UPDATETechnical Analysis for KASPA (KAS)
Current Price: 0.11268 USD
Timeframe: 4-Hour Chart
Indicators and Key Observations:
Price Action: Kaspa is currently in an ascending triangle pattern, with price action approaching the resistance line, which has been tested multiple times without a clear break. This pattern indicates the possibility of a breakout if the price moves above the resistance line.
Support Zone: The support level has been consistent, forming a base near 0.1070 USD. This is a crucial area where buying interest has been observed.
Resistance Line: The price is approaching the resistance at around 0.1130 USD. A breakout above this level could signal bullish continuation towards higher targets (potentially 0.1900 USD as indicated by the chart’s blue arrow).
Technical Indicators:
VWC Cipher B Divergences: The indicator shows bullish signals, suggesting that price might continue to rise, especially if it successfully breaks the resistance line.
RSI (Relative Strength Index): The RSI is sitting at around 52.96, indicating that the asset is neither overbought nor oversold. This gives space for potential bullish momentum.
MFI (Money Flow Index): The MFI is relatively neutral, indicating that there is no immediate imbalance between buying and selling pressure.
Stochastic Oscillator: The oscillator shows a potential bullish crossover, with the signal line moving towards the overbought zone.
Trading Plan for KASPA (KAS)
Entry Strategy:
Long Entry: Consider entering a long position once the price breaks and closes above the resistance line around 0.1130 USD. Look for confirmation through a strong green candle to ensure momentum continuation.
Target: The primary target for this trade is 0.18 USD, as indicated by the blue arrow in the chart. A second target can be placed near the psychological level of 0.20 USD, depending on market conditions and price action.
Stop-Loss Strategy:
Place the stop-loss slightly below the support zone, ideally around 0.1060-0.1070 USD, to protect against a false breakout. The stop-loss should be adjusted as the price moves in your favor to lock in profits.
Risk-Reward Ratio:
The risk-reward ratio for this trade is favorable, as the potential upside (0.18-0.20 USD) significantly outweighs the downside risk (stop-loss below 0.1070 USD). A risk-reward ratio of 2:1 or higher is ideal for entering the trade.
Volume Confirmation:
Ensure that the breakout above resistance is accompanied by an increase in volume. Low-volume breakouts can lead to false signals, so confirming the move with higher-than-average volume is crucial for a successful trade.
Risk Management:
As always, never risk more than 2% of your trading account on any single trade. Use proper position sizing and adjust your stop-loss accordingly to maintain a controlled risk profile.
Recent News - Crescendo Upgrade 🚀
Today, Kaspa has rolled out its Crescendo upgrade, which boosts the network speed to 10 blocks per second. This is a major leap in scalability, enhancing transaction speed and efficiency. The upgrade is expected to drive greater adoption and increase investor interest, potentially providing additional support for the upward momentum in the KAS market.
Kaspa (KAS) is showing signs of bullish momentum, with key technical indicators pointing to a potential breakout above resistance. The recent Crescendo upgrade adds further optimism for the coin's future prospects, making this an exciting trade to consider. Be sure to monitor price action closely and implement strict risk management strategies for optimal results.

DOTUSDT Potential UpsidesHey Traders, in today's trading session we are monitoring DOTUSDT for a buying opportunity around 5.030 zone, DOTUSDT is trading in an uptrend and currenty is in a correction phase in which it is approaching the trend at 5.030 support and resistance area.
Trade safe, Joe.

COQ Looks Like It's Making a Retracement – Waiting for Price Dr🚨 COQ Looks Like It's Making a Retracement – Waiting for Price Drop 📉
COQ looks like it’s currently making a retracement. I’m waiting for the price to drop to the green line levels and will be looking for confirmation before entering long! 📊
Let’s watch this move together and catch the next opportunity! 💼💸

SUSHI - History Repeating Itself!Dear TradingView community and fellow traders,
I am Richard, also known as theSignalyst.
I find the SUSHI 🍣 daily chart intriguing , as it seems to be following the classic Wyckoff Cycle 📈.
If history repeats itself, we’ve just broken out of the accumulation phase ✅, highlighted in green 🟩.
As long as the bulls 🐂 remain in control, the markup phase may have just begun—potentially pushing SUSHI as high as $2.5 🚀.
❓ What's next?
Will SUSHI continue to trade higher from here, or will this cycle play out differently?
I hope you find this post useful, and I would appreciate your likes and support.
Which scenario do you think is more likely to happen first? and why?
📚 Always follow your trading plan regarding entry, risk management, and trade management.
Good luck!
All Strategies Are Good; If Managed Properly!
~Richard

S/USDT Potential UpsidesHey Traders, in today's trading session we are monitoring S/USDT for a buying opportunity around 0.5850 zone, S/USDT is trading in an uptrend and currently is in a correction phase in which it is approaching the trend at 0.5850 support and resistance area.
Trade safe, Joe.

SPELLUSDT | Buyers Are Stepping In, Green Box Marks Key SupportVolume and order-flow data show genuine buying interest in SPELLUSDT right now. The green box on our chart highlights a zone where buyers have consistently defended price, making it a reliable area for potential entries.
🟢 Support Zone to Watch
The green box aligns with previous demand levels. When price revisits this area, it often pauses or rebounds as buyers step back in.
A clean bounce off this zone coupled with a higher-low on a 5‑ or 15‑minute chart gives us the confirmation we need.
🔍 Confirmation Criteria
Lower-Time-Frame Structure
Wait for price to form a solid base inside the green box before getting involved.
CDV and Volume
Look for a shift in cumulative delta volume and an uptick in buying volume to validate the move.
🎯 Trade Plan
• Long Entry when the green box holds and confirmation appears on lower time frames.
• Stop Placement just below the green box to keep risk defined.
• Adapt if Price Breaks Down: I will not insist on a long if support fails without a retest. In that case, I’ll step aside and look for the next setup.
This approach helps you trade with confidence rather than guesswork. By waiting for clear signs of buyer strength in the green box, you align yourself with the market’s true intent. Stay patient, watch the signals, and let’s capture the next move together.
📌I keep my charts clean and simple because I believe clarity leads to better decisions.
📌My approach is built on years of experience and a solid track record. I don’t claim to know it all but I’m confident in my ability to spot high-probability setups.
📌If you would like to learn how to use the heatmap, cumulative volume delta and volume footprint techniques that I use below to determine very accurate demand regions, you can send me a private message. I help anyone who wants it completely free of charge.
🔑I have a long list of my proven technique below:
🎯 ZENUSDT.P: Patience & Profitability | %230 Reaction from the Sniper Entry
🐶 DOGEUSDT.P: Next Move
🎨 RENDERUSDT.P: Opportunity of the Month
💎 ETHUSDT.P: Where to Retrace
🟢 BNBUSDT.P: Potential Surge
📊 BTC Dominance: Reaction Zone
🌊 WAVESUSDT.P: Demand Zone Potential
🟣 UNIUSDT.P: Long-Term Trade
🔵 XRPUSDT.P: Entry Zones
🔗 LINKUSDT.P: Follow The River
📈 BTCUSDT.P: Two Key Demand Zones
🟩 POLUSDT: Bullish Momentum
🌟 PENDLEUSDT.P: Where Opportunity Meets Precision
🔥 BTCUSDT.P: Liquidation of Highly Leveraged Longs
🌊 SOLUSDT.P: SOL's Dip - Your Opportunity
🐸 1000PEPEUSDT.P: Prime Bounce Zone Unlocked
🚀 ETHUSDT.P: Set to Explode - Don't Miss This Game Changer
🤖 IQUSDT: Smart Plan
⚡️ PONDUSDT: A Trade Not Taken Is Better Than a Losing One
💼 STMXUSDT: 2 Buying Areas
🐢 TURBOUSDT: Buy Zones and Buyer Presence
🌍 ICPUSDT.P: Massive Upside Potential | Check the Trade Update For Seeing Results
🟠 IDEXUSDT: Spot Buy Area | %26 Profit if You Trade with MSB
📌 USUALUSDT: Buyers Are Active + %70 Profit in Total
🌟 FORTHUSDT: Sniper Entry +%26 Reaction
🐳 QKCUSDT: Sniper Entry +%57 Reaction
📊 BTC.D: Retest of Key Area Highly Likely
📊 XNOUSDT %80 Reaction with a Simple Blue Box!
📊 BELUSDT Amazing %120 Reaction!
I stopped adding to the list because it's kinda tiring to add 5-10 charts in every move but you can check my profile and see that it goes on..

12/05/25 Weekly OutlookLast weeks high: $104,972.46
Last weeks low: $93,385.49
Midpoint: $99,178.97
Bitcoin climbs over 12% from weekly low to weekly high, an incredible achievement despite a mixed performance in Tradfi. A pattern we've seen since the $74,500 double bottom following Liberation day goes; A strong rally for a week, consolidation in a tight trading range for a week, then repeat. Should this pattern continue we should see consolidation between weekly high and $102,075 (0.75 line).
CPI & PPI take place this week on Tuesday and Thursday respectively, inflation is still a big talking point but baring a crazy print I would be surprised if these events move BTC. In the last few hours at time of writing The US has reduced tariffs on China to 30% for 90 days, China has reduced tariffs on the US down to 10%. To me this signifies the worst of the trade war narrative is behind us.
This week I will be tracking altcoins with strong fundamentals as BTC.D rolls over from its highest point since January '21, ETH has already had a strong breakout from the downtrend and with BTC at ATH levels with strong resistance this should be the time to see altcoin strength and play catch-up.
Good luck this week!

Wyckoff Cycle - Practical Example (SUI)Dear TradingView community and fellow traders,
I am Richard, also known as theSignalyst.
I find the SUI daily chart to be intriguing as it appears to be following the famous Wyckoff Cycle.
I would like to apply Richard Wyckoff's four market stages/phases to this chart for analysis as a practical example.
1️⃣ Accumulation
SUI rejected the $0.50 round number and entered an accumulation phase, consolidating for several months.
2️⃣ MarkUp
After breaking above the accumulation range at $1, SUI kicked off the markup phase.
3️⃣ Distribution
SUI found resistance at the $5.50 round number, with the lower bound of its range near $4—forming a wide distribution phase.
4️⃣ MarkDown
Once SUI broke below the $4 major low and exited the distribution zone, it transitioned into the markdown phase.
🔄🔄🔄🔄🔄⬇️
1️⃣ Accumulation
After finding support around the $2 round number, SUI hovered within a range, forming another accumulation phase.
2️⃣ MarkUp
We're here 🙂 This week, SUI broke above the $2.80 major high and the accumulation range—signaling the beginning of a new markup phase.
❓ What's next?
Will SUI continue to trade higher from here, or will this cycle play out differently?
I hope you find this post useful, and I would appreciate your likes and support.
Which scenario do you think is more likely to happen first? and why?
📚 Always follow your trading plan regarding entry, risk management, and trade management.
Good luck!
All Strategies Are Good; If Managed Properly!
~Richard

WIF/USDT - Fresh meme coin. Trading setup in chanal. Popular fresh meme coin – Dogwifhat
📊 CoinMarketCap Rank: #102
🐦 Twitter (X) : 152K followers
💬 Telegram : 50K members
✅ Highly liquid meme coin – traded on many major exchanges, including Binance.
After the hype phase , the coin is now declining along with the overall crypto market —no exceptions. Essentially, it broke below multiple channel supports , and the price is now sitting at the support of the outer channel.
I also notice a non-textbook Head & Shoulders pattern, which suggests a potential -64% breakdown . The last squeeze happened around this level.
Currently, we are seeing consolidation with increased volume , along with high-wick price action in this zone.
I've marked potential downside support zones as well as upside resistance targets on the chart. Consider this in your trading strategy!
