PENGU = ETF Catalyst + Whale Accumulation = +30% More Upside?Today, on the weekend, I want to analyze the Pudgy Penguins project with the PENGU ( BINANCE:PENGUUSDT ) token from a fundamental and technical perspective .
Please stay with me.
Why did PENGU surge nearly 40% in just 48 hours? Here’s what’s driving it:
------------------------------------------
Fundamental Analysis:
1. ETF Momentum via Cboe:
On June 26, Cboe officially filed a 19b-4 form for a new ETF that includes Pudgy Penguins and PENGU as major components.
Although not yet approved, this single move has fueled strong institutional anticipation, similar to what happened with Bitcoin ETFs in early 2023.
The market often prices in future narratives — and this ETF storyline has been a powerful one.
2.Whale Accumulation Signals
According to Nansen data, large holders have increased their balances by 11.37%, and notable wallets linked to public figures by 7% over the last 30 days.
Such coordinated accumulation often precedes major price moves, and that pattern seems to be repeating here.
3.NFT Ecosystem Boost
The Pudgy Penguins NFT collection saw a 400%+ surge in sales volume.
This sharp increase in NFT activity has reignited attention toward the broader Pudgy ecosystem, which naturally benefits its native token, PENGU.
Risk Note:
The ETF is not yet approved — we're still in the hype phase.
Volatility remains high, and strong pullbacks are common in low-liquidity tokens like PENGU.
If whale activity continues and institutional narratives grow, the upside potential remains — but so does the downside risk.
------------------------------------------
PENGU token started to rise from the Support zone($0.01-$0.0076) . One of the signs of a continuation of the uptrend was the break of the upper line of the descending channel .
Educational Note: One of the price targets after a channel break can be as wide as the width of the broken channel.
In terms of Elliott Wave theory , it seems that the PENGU token has completed the Double Three Correction(WXY) , and we can wait for the next impulsive waves .
I expect the PENGU token to attack the Resistance zone($0.0128-$0.0118) again, and if this zone is broken , it can increase to at least $0.0137(+30%) .
What is your idea about the Pudgy Penguins project?
Note: If the PENGU token drops below $0.01, we can expect a break of the Support zone($0.01-$0.0076).
Please respect each other's ideas and express them politely if you agree or disagree.
Pudgy Penguins Analyze (PENGUUSDT), 4-hour time frame.
Be sure to follow the updated ideas.
Do not forget to put a Stop loss for your positions (For every position you want to open).
Please follow your strategy and updates; this is just my Idea, and I will gladly see your ideas in this post.
Please do not forget the ✅' like '✅ button 🙏😊 & Share it with your friends; thanks, and Trade safe.
Altcoins

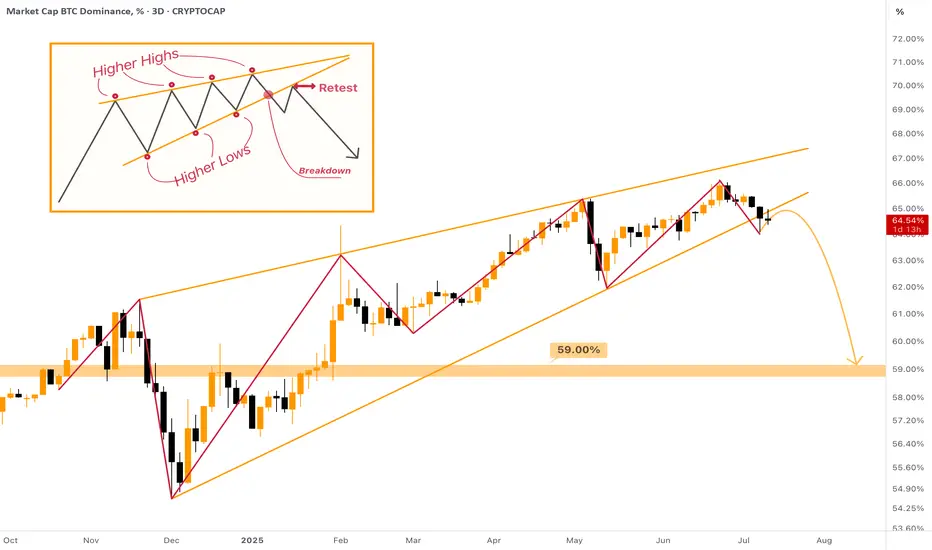
Rising Wedge on Bitcoin Dominance - [BROKEN DOWNWARDS] The MASSIVE Rising Wedge on Bitcoin Dominance was broken downwards during the past week, most likely the 1W candle will also close below the support of the wedge.
What does it mean? The dominance will dump from 64% to at least 59%. This move can already provide us with the huge Altcoin Season! After this there more likely be a small correction towards 60%, and then we can freely dump further towards 54% zone.
I expect not only small cap, but major altcoins to be sent to new highs as well. Mark my words & be prepared for the last opportunity of this bull cycle!
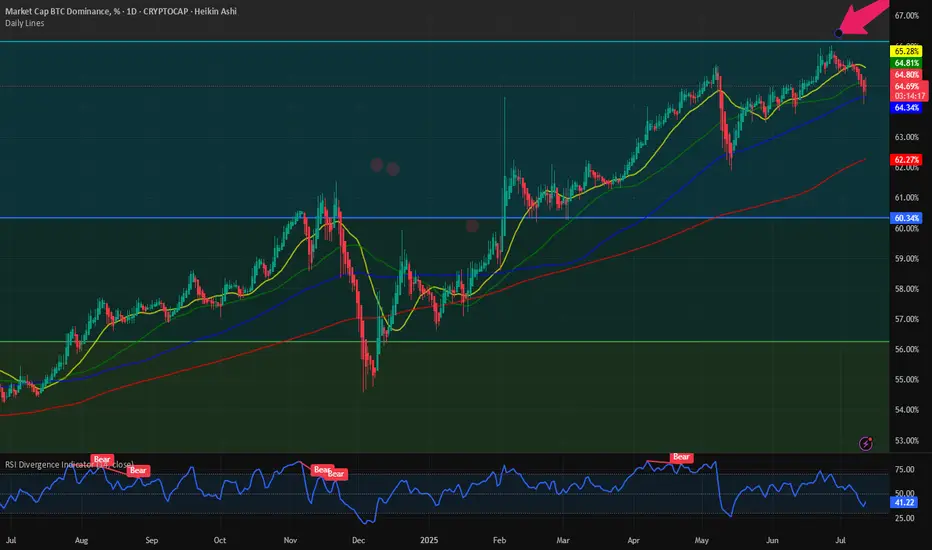
BTC.D Slipping ! ALTSEASON Loading ? This is BTC.D on the daily chart.
It has shown a strong relationship with the 50MA (blue/cyan line), often using it as support. While there were a couple of daily closes below it in the past, they lasted only 1 or 2 candles.
Now we’ve seen 4 consecutive daily closes below the 50MA (including today), which increases the likelihood of a deeper move to search for support.
The next key support zone (green rectangle) is defined by the 200MA (red line) and the 62.25% level (black line) — both of which acted as support before.
If BTC.D drops into that zone, ETH and altcoins could experience a strong bounce.
Always take profits and manage risk.
Interaction is welcome.

XLMBTC To Enter Its Biggest Bull Market Ever · 4,855% In 2017Stellar. No bull market vs Bitcoin in 2021. You know what this means? We are due an ultra-strong bull market for XLMBTC in 2025 (and beyond).
The 2017 bull market lasted 308 days. Total growth reached 4,855% within this period. The bear market that followed was brutal. From January 2018 until November 2024. A total of 2,499 days of bearish action.
A bottom was hit 4-November 2024 and the proceeding week we saw a major advance. This was a 400% bullish wave. Now this wave is over with a correction and the correction ended in a classic higher low. This week we have a new bullish breakout and this is the continuation of the uptrend, the first time XLMBTC goes bullish since 2017. It seems this pair will continue bullish even after Bitcoin peaks. Who knows, maybe even years going up.
The chart is solid and supports additional growth. We are due a strong rise, the biggest ever for this pair.
Thank you for reading.
Namaste.

VeChain Low Prices Accumulation Opportunity Reaching Its EndVeChain. We have higher lows since June 2023 and yet, VETUSDT is still trading at bottom prices. Don't get me wrong, this is great. This only means that the pair is strong and yet there is still time to buy within a rising accumulation zone.
I am using the linear chart so we can get the full picture. After June 2022, the candles become very small. This is the consolidation period. Even when the market starts to produce higher lows and higher highs after June 2023 this is still bottom prices action. What do I mean? Just compare the size of the 2021 bull market bullish wave with the past 3 years. That is what I mean.
What will happen now is the 2025 bull market bullish wave. A wave similar in size to what we saw in 2021 but with the end result being much higher prices, very likely a new all-time high.
First the action is very slow, almost neutral as you are seeing now. The small jump from April-May, less than 80%. Then watch... Out of nowhere, Boom!, 200-300% just to start. The 200-300% bullish breakout is never the end, this would be just the start of the major 2025 bull market wave. Then it goes on and on and on... Sustained long-term growth. The end result can be 15X, 20X, 30X or more. Too early to say, but prices won't remain low for too long. This is your last chance to accumulate VeChain before a major bullish run.
Namaste.

Toncion Update: Never Again Below $3.00 · New All-Time High NextToncoin already closed five consecutive days green as it prepares for a major advance. The last time this happened was in early April and this produced a nice jump. The difference now is that in April the market was coming out of a downtrend and the low was a major low. In June the market was in a retrace and the low is a higher low. Much difference. The next advance is very close, already here, and will produce the highest prices in more than a year, since June 2024 and of course, it will go beyond for sure, a new all-time high.
This is the last time you will see Toncoin trading at low prices before the major 2025 bull market cycle and wave. There is no limit to the upside, it is possible that in just a few days from now Toncoin will move away from $3 and never trade at this price again. That is, you will never be able to buy TON for $3.00, the price will be much higher. Do you remember Litecoin when it traded at 3 cents? What about Bitcoin at $3,000? What about Ethereum at $100? Well, Toncoin is no different. It will grow so much and so strong that we will be happy that we decided to be 100% Crypto. Risk vs reward. We accept the risk and for this reason we can enjoy an amazing reward.
Namaste.

Trading Altcoins for Maximum Profits · StrategyIt is a tricky market. How are you going to trade the altcoins to maximize profits? What's your plan?
Everyday there is always some odd pair that grows 100%+, and we feel attracted to this kind of action. We want to be in and we want to hold those pairs. But, there are hundreds of choices on each exchange and only 1-2 pairs breakup this strongly every few days. Quietly, behind the scenes, everything grows but slowly.
Three months down the road the entire market will be 2-3 levels up, minimum. Some pairs will be up five levels and some even more.
If we fall for the trap of trying to catch the next big move, we can miss the real bullish action that is happening every day. I mean, it is better to buy and hold 5-10 strong good pairs rather than chasing around the dream of big wins. A dream that most often than not never comes.
If you look at 22-June or 7-April, it takes months for a bullish wave to develop. All across, marketwide, it happens step by step. Every day altcoins are growing 2-3%, 5-10%, over and over, again and again.
When we jump around trying to catch the next sudden jump, we miss the safe and secure sustained daily growth. When we finally make the right move and buy the pair that is breaking up strong, there is a 50% bullish breakout but somehow this isn't enough, we want more, more, more. 50%, 70% up and yet, we do not sell, we wait for more. But the entire bullish wave, regardless of how you slice it, takes a minimum of 3 months. Then comes a retrace, fast, or a strong correction, and we sell when prices are low. A strong rise at first and we might end up with just 20-30% gains. And in this way we end up wasting months and months.
Three months later, we do have some gains; it is a bull market after all, but total growth is nothing compared to holding a strong pair long-term. The strong pairs, most of them, end up growing 700%, 800%, 1,000%. When you look at your capital and you are moving around, you see only 100 or 200% total growth. What is happening here?
If you have 2-3 years of spot trading experience, then you can definitely choose 20 good pairs and sell the few that breakup weekly, hold the rest. Each time several pairs breakup strong, collect profits and find the ones trading low. But, if you have less than 2 years experience trading spot, you are better off buying low and holding long-term. You will end up with bigger profits in the end.
There are many ways to approach the market, make no mistake, but a plan is needed to maximize profits. I will continue to share my experience so you can avoid making the same mistake I made back in the days.
I've been trading Bitcoin since 2013, altcoins starting 2015; full time Cryptocurrency since 2017 through present day.
The market is a school and will you give tons of lessons, experience is needed for success. If experience is lacking, planing ahead of time will produce the best results.
To plan, just ask yourself the following questions:
1) How long am I willing to wait after buying a pair?
2) If prices rise, will I sell? If yes, when and by how much?
3) If prices drop, will I close the position at a loss? If no, how long are you willing to wait with a losing pair? If yes, when will you close? At -10%, -20%, -50%?
Answering these questions ahead of time can help you avoid anxiety and stress. The more you prepare, the more you read; higher profits.
Namaste.

Kava: 5 Strong Bullish Signals, Cup & Handle, High Volume & MoreThe cup & handle pattern doesn't work at resistance. You cannot use this pattern in any meaningful way at the top of a rising trend. For the C&H to be valid, it needs to happen at the end of a downtrend, near the market bottom because this is a bullish reversal pattern.
Here we have KAVAUSDT weekly up-close. August 2024 marks the lowest prices since March 2020, in more than 3.5 years. Including this strong multiple years low, we have the cup pattern forming followed by the handle. See the chart:
This is the classic cup and handle (C&H) pattern and here it is valid and can work as a reversal signal.
One signal in isolation is never enough, it needs to be coupled with 3-4 additional signals to have a strong setup. The next signal comes from the trading volume. As KAVAUSDT reached the lowest in almost 4 years, trading volume goes through the roof; the highest buy-volume ever. This is another strong signal.
We have the reversal pattern, long-term double-bottom, increasing volume, local higher low (the handle low vs the cup low) and marketwide action (the rest of the altcoins market going bullish).
There you have five signals total all supporting a change of trend. This means that soon Kava will start to grow and you know this for certain because you have the supporting data coming from the chart.
Namaste.

ETH Hits $3K — Next Stop: Moon or Pause?ETH just tagged the psychological $3 000 barrier after a sharp impulse, printing a fresh higher high inside its rising channel.
🧠 Game plan:
1️⃣Pullback zone: The orange structure area at $2 550 – $2 700 aligns with the channel’s lower trend-line — a prime spot for bulls to reload.
2️⃣Continuation trigger: A clean 4H close back above $3 000 turns the level into support, unlocking the path toward $3 100 (first target) and potentially higher into the summer.
3️⃣Invalidation: A decisive break below the channel would neutralise the setup and shift focus back to the macro support near $2 400.
Until then, every dip toward the orange demand is a gift in this bullish structure. Trade the plan, not the noise.
📚 Always follow your trading plan regarding entry, risk management, and trade management.
Good luck!
All Strategies Are Good; If Managed Properly!
~Richard Nasr

ATH Mode On => Request Your Altcoin Analysis NowThe bulls are back in action, and momentum is building fast! ⚡
To celebrate this major milestone, I’m opening the floor to YOU 👇
Request any altcoin in the comments, and I’ll personally share my technical analysis on it! 📊✅
Let’s make the most of this market together — it’s altcoin season waiting to happen! 🚀
📚 Always follow your trading plan regarding entry, risk management, and trade management.
Good luck!
All Strategies Are Good; If Managed Properly!
~Richard Nasr

ETH Building Blocks - Keep it Simple🧱 Building Block - ETH Weekly Analysis 🧱
Ethereum has been trading within a well-defined structure, respecting key horizontal zones — each acting as a crucial building block in ETH’s macro journey.
🔹 Zone 1 ($1,700 - $2,100)
A strong demand and accumulation zone. ETH bounced from here multiple times, proving itself as the foundation of the current bullish attempt.
🔹 Zone 2 ($2,400 - $2,600)
We're currently hovering around this key mid-range resistance. A successful break above it would pave the way for the next major leg up.
🔹 Zone 3 ($2,900 - $3,400)
A major historical resistance turned supply area. ETH needs strong momentum and volume to break through this ceiling.
🔹 Zone 4 ($3,800 - $4,200)
The final building block before retesting ATH territory. A retest here could signal full bullish control in the coming months.
📍 As long as Zone 1 holds, ETH remains structurally bullish. Watch for breaks and rejections at each building block to gauge the next move.
Which block will ETH break next? 🔮
📚 Always follow your trading plan regarding entry, risk management, and trade management.
Good luck!
All Strategies Are Good; If Managed Properly!
~Rich

$BTC.D: Failed breakout above 66%. Was that it? Time and again we investigate the CRYPTOCAP:BTC dominance chart. In my opinion it is the most important chart in the Crypto markets. I have supported the idea that we will see CRYPTOCAP:BTC.D touch 66% in this market cycle. In my first blog on this topic on April 14th I published the idea here in Trading view.
CRYPTOCAP:BTC.D to 66%, CRYPTOCAP:TOTAL2 / BTC down to 0.43 for CRYPTOCAP:BTC.D by RabishankarBiswal — TradingView
Since April time and again we looked at this chart and since I first preached the idea of CRYPTOCAP:BTC.D to 66.2% from 63% in April we had some hiccups in the way where the Altcoins tried to claim leadership. On May 20th I indicated that the short-term blip is not consequential.
CRYPTOCAP:BTC.D : Have we seen the top or a local top in the CRYPTOCAP:BTC.D ? for CRYPTOCAP:BTC.D by RabishankarBiswal — TradingView
We reaffirmed our view on June 22nd, and we confirmed our commitment to CRYPTOCAP:BTC.D to 66%.
CRYPTOCAP:BTC weathering the storm: CRYPTOCAP:BTC.D close to 66%. CRYPTOCAP:BTC to 160K. for BITSTAMP:BTCUSD by RabishankarBiswal — TradingView
We briefly touched 66% and failed to breakout on June 27th. Now we have hit an air pocket. In my opinion this should also pass. Confirming my view of CRYPTOCAP:BTC.D to 66.2% and 160K $BTC.
Verdict: CRYPTOCAP:BTC.D will cross 66.2% before all set and done. Price performance of Altcoin can be good going from here.
Verdict: CRYPTOCAP:BTC.D will cross 66.2% before all set and done. Price performance of Altcoin can be good going from here.
Layer3 Can Grow 600% Easily (1,000%+ Possible) · Weekly & DailyWe are going to start by looking at the weekly timeframe. After we do a deep analysis on this scale we will move to the daily.
Layer3 (L3USDT) produced its main low in September 2024 after it started trading. We can consider this the market bottom. After this low a bullish wave develops and totals +330%. The peak happened in November 2024. After a bullish wave, there is always a correction and that's exactly what happened for L3USDT.
The correction produced a low that ended 10-March 2025. This is the first low after September 2024 and ended up as a higher low, which means bullish. Buyers were present on the drop and bought before sellers were able to compromise the previous support, our market bottom.
The reaction to this support zone holding produced 300% growth within 3 weeks. Then the same dynamic plays out again. A bullish move is followed by a correction.
The new correction, starting after the late March high, ended the 16-June week. This low moves lower compared to 10-March but the candle/session ends up closing higher. Above the 10-March week wick low, a signal of strength.
When comparing June 2025 vs September 2024 we have a long-term higher low and this supports a bullish bias and a new bullish wave. Just like March but this time stronger.
Now L3USDT has been green three consecutive weeks, this is good. A local downtrend has been broken and seeing how the overall market is doing, the rest of the altcoins, we can expect strong growth. Layer3 is set to move and is already moving, bullish momentum will only build-up.
The targets on the chart are all high probability. The first two are very easy targets. So 600% can happen easily mid-term, which is within 3 months (90 days). The remaining target should be considered long-term.
Daily Timeframe:
The daily timeframe is basically the same. The bullish bias is early but very strong based on multiple reversal bottom patterns and the break of a local downtrend.
This is a good choice.
Thanks a lot for your amazing support, it is truly appreciated.
Namaste.


Avalanche, Why with Leverage? Exponential Moving AveragesOn the 10th of July AVAXUSDT finally managed to break above EMA55 and EMA89 on a very strong, full green candle. This is the day the market bias turns bullish and is fully confirmed. Bullish of course happens soon with the higher low, 22-June, but confirmation only comes after certain resistance levels are cleared, after the pair in question trades at a certain price.
Notice yesterday's candle, there was a rejection but prices remained above EMA89—blue dotted line on the chart. Today, we have a small candle with the same dynamics: A little lower then higher but still, above EMA89. The action is happening above 0.148 Fib.
These levels, EMA55, EMA89 and 0.148 Fib. extension all expose a strong support zone. As long as AVAXUSDT trades above them, we can expect maximum growth. That's why leverage is possible. With a well defined support range we can set the stop-loss right below and let the market take care of the rest.
Since both days failed to move prices lower, yesterday and today, and we know where the market is headed thanks to Bitcoin and the other altcoins that moved ahead, we can bet that Avalanche will grow and will do so strong. This is a safe bet.
Remember to do your own research and planning. Leveraged trading should be approached by experienced traders only. The same chart setup can be approached spot with minimum risk. Below 5X is also very low risk but higher is possible on this setup. Buy and hold, the market takes care of the rest. Great prices and entry timing.
Your support is appreciated.
Namaste.

Core DAO Bullish Impulse, Elliott WaveI am giving two targets for the end of the fifth wave, the first wave is already in.
Good morning my fellow Cryptocurrency trader, I hope you are having a wonderful day.
Here we have a classic chart setup, COREUSDT bearish since April 2024. The drop from April 2024 through March 2025 can be considered a big ABC. Once the correction ends, we can look for signs of a newly developing bullish wave. The signs are in.
Between March & May 2025 we have wave 1, ending clearly in a higher low. The first wave lasted 70 days, the third wave can easily last 90 days. Can be more or less, this is only a projection but we know the market is set to move higher.
Wave 2 was really short, it only lasted 28 days. So wave 4, the second correction within a bullish impulse, can last between 40 and 60 days. After wave 4 we get the fifth and final wave and this is the speculative wave.
These are very conservative projections on the chart, the market can move much higher. For example, wave 3 can end up going as high as wave 5. Then wave 4 would correct into what is now the wave 3 high. Then the final fifth wave would go off the chart and peak at $18. This is another version and it wouldn't surprise me, Crypto tend to go beyond all expectations when the bulls are on.
Regardless of how high the market goes, right now we have great entry timing and prices while at the same time knowing Crypto is going up.
Namaste.

$OMNI/USDT – Wait Before You ChaseSEED_DONKEYDAN_MARKET_CAP:OMNI has already exploded with a parabolic breakout, rallying massively after breaking above the falling wedge resistance around $1.63.
Current Situation:
Massive impulse candle from $1.6 to over $4.5
Price retracing after the overextended move
Strong rejection near $3.35
Ideal Entry Zone (wait-for-pullback):
Between $1.47 – $1.63
Aligns with previous resistance and breakout zone
Could act as retest support
Setup After Retest:
Entry: $1.50 – $1.63 range
SL: Below $1.36
Targets: $2.37 → $3.15 → $4.50
Risk-Reward: High if patience wins over FOMO
Patience is key. Don’t chase pumps. Wait for the price to cool off.
DYOR | Not financial advice
#OMNI #Altcoins

THORChain 1,784% Profits Potential & Technical AnalysisHere we can see THORChain sandwiched in-between EMA89 and EMA55. The action is not happening above EMA89 but this shouldn't be considered bearish, more like "we are not there yet." Or, "still consolidating but with a bullish bias."
The bias is bullish because the low came in early February 2025. So that is more than 5 months ago. A bearish trend or bearish continuation would require lower lows in those 5 months. The fact that after the low in February there was a small recovery and this recovery ended as a higher low on the retrace, means the downtrend reached its end. Since the downtrend is over, we are seeing consolidation, accumulation before the market turns. The turning is the bullish cycle, the uptrend. And we are in the process of seeing this change materialize into the market, price and chart.
The minimum target is the "baseline level" between $7.44 and $6.20. The target to aim for should be $18 and if you are feeling optimistic then $28. I've seen this project grow incredibly strong in the past so I wouldn't be surprised if it ends up moving even higher.
This is a simple chart. What goes down, must come back up; specially when we are talking about Crypto. The best financial market in the whole world. Young, but highly profitable. Risky? I don't know... It is risky to be young. But the potential rewards make up for any risk the market carries. We can take risk when we are young. We should. You play it safe because you are old. No risk, no fun. Plan ahead, success is yours.
Namaste.

Peanut the Squirrel 1315% Profits Potential · Technical AnalysisI noticed that most of the memecoins have a strong growth potential. Here we have PNUTUSDT and the potential goes easily beyond 1,300%. An easy target is set to 467% so you can imagine. The chart looks strong and you know we focus only on TA.
Good evening my fellow Cryptocurrency trader, I hope you are having a wonderful day.
Peanut the Squirrel. Who am I to judge? RWA, Layer 1, POW, Gaming, DeFi, Infrastructure, NFT, AI... The choice is yours.
Here we have the classic and more than classic higher low. The bottom low and the bullish breakout ending its retrace higher is as easy and simple as it goes. The beauty of TA. You can know where the market is headed based on how the candles behave.
And then, we are back to the EMAs. Notice the blue one because it is the main one I'll be using on the daily timeframe. The huge big candle happens to break above this level. Once this level is conquered as resistance we know the bulls are on. Now the market can rest but it can also move ahead. We have a higher low, PNUTUSDT, and the action happening above EMA89, EMA55 and EMA13; in short, the bulls win.
The next higher high and first target is $1.03. This is followed by $1.59, 467% potential for growth and then the market can continue higher, easily, because we are entering the strongest ever Cryptocurrency bull market.
Namaste.

ADA Daily Update · Moving Averages · 262% Target ExposedGood morning my fellow Cryptocurrency trader, I know you are having a wonderful day because the market is doing great. We looked at Cardano together on the weekly timeframe and this is a big picture but what about short-term? Where are prices headed next? The next target, resistance/support and the moving averages of course.
I've been looking at the moving averages lately and this is a theme that I will continue for a few days, or weeks, once we exhaust it we use other indicators. You know we also like the RSI and MACD, candlestick reading, volume, chart structure, chart patterns, market cycle, etc. Marketwide action, subtle signals, market sentiment, on and on.
Cardano is already trading above many major moving averages but this is a recent event. First consider the fact that in late 2024 ADAUSDT grew 320% right after breaking above the same EMAs that I am showing you now.
ADA closed just recently above EMA89, EMA233, EMA55, etc. Only MA200 is missing and this is an important one but will soon break. I am not showing it here because the action is still happening below.
There is a rounded bottom. This alone is a reversal signal already confirmed because the action is happening above the base of the pattern. In April we had a triangular bottom and here we can see an alternation. In February it was a straight line. A straight line, a triangle and then a circle; interesting.
The bullish bias is confirmed and we are seeing straight up, the next target is 0.8194. Cardano has been green four days straight. Go back to November 2024... The possibility exist for continued growth. Day after day after day. At some point there will be a stop, can be a retrace or correction. Know that when this stop happens it is not the end. There will be several stops along the way but we are set for a strong new all-time high. You will need to be patient while holding but just make sure to aim high. Don't get greedy of course. If at some point you start to feel anxious, read on the topic, go out into nature or simple sell a small portion until you feel better. The best choice is to be prepared and this can be done by studying the charts and the market. If you have a good plan and a nice map you will do fine. If you are an advanced trader, I am sorry, let's get back to the chart.
$1.01, $1.30, $1.15. These are all resistance. So there will be some challenge around this price zone. Once it is conquered though the advance should be swift until 1.83. Another stop and then 2.65 which is the main target for 262%. Depending on how this level is handled we will update the chart and the targets. For higher targets look at earlier analyses or those on the weekly timeframe.
Thank you for reading.
Namaste.

Dogecoin Prepares 2025 Bullish Wave · New All-Time HighThe last time that Dogecoin produced strong bullish action was November 2024, more than 217 days ago. Before this wave, there was a small period of growth in early 2024 and that's about it, the market was bearish for a long-time after the 2021 all-time high. There is good news though. Dogecoin is preparing for a new major bullish cycle and this cycle is already in place.
Since mid-March 2025 the action has been weak. No growth but no decline either. Between May and June, there were more than 8 weeks of bearish action but Dogecoin's price remains strong within a mid-term higher low. The last three weeks have been green with this week being full green trading at the top of the candle, the market is about to produce a major advance.
If you look back to October 2024, late, you will see small candles then several huge big candles, maximum growth. That's how Crypto tends to operate. One day the market is silent, the next day we are witnessing the strongest ever bullish wave. This is what Dogecoin is getting into right now.
If you look back to early 2021 it is the same. Late March and early April 2021 we have very small candles and then everything changes suddenly and the market produced astonishing growth. We are on the verge of such an event, the 2025 bull market phase and bull run. Get ready and prepare for a new all-time high.
Namaste.

Dogecoin Daily, A Closer View · Next Target, How To Trade & MoreYesterday Dogecoin moved above EMA89, a major long-term moving average. Definitely bullish confirmed. We are giving Dogecoin a closer look because the other chart was based on the long long-term, the weekly timeframe. With this one, we will know exactly what happens next.
Today, DOGEUSDT is moving above EMA233 and this one is super long-term. Immediate resistance is found at 0.21300 but this is likely to break right away, always allowing for a few days of fluctuation because the market never moves straight down nor straight up. It fluctuates creating waves.
The next target after this one is 0.26500 followed by 0.34900. These can be hit short-term. In the coming weeks and days. After this one, we will aim at the last high which happened December 2024, now already a long-time ago.
The altcoins market is bullish but this bullishness is very early, it is only getting started. The market will be bullish for such a prolonged period of time that you will get used to seeing bullish action and at one point will become comfortable seeing your profits grow. When this happens, stay alert and make sure to secure some wins on the way up.
Do not chase rising pairs, buy those trading near support. Buy and hold.
This is the best strategy for maximum profits. Also, if you catch a winner, let it ride long-term. This also produces bigger profits in the end vs selling and trying to catch the retrace to buy again. It is better to buy big when prices are low and hold long-term. Only secure some profits when you are really high up, after 2-3 months. And of course, when the time for the new all-time highs is close, that's the time to close all positions.
Thanks a lot for your continued support.
Namaste.

dYdX Hyper Bullish Market Conditions, $11.1 Next Target (1,671%)"Once we hit bottom, there is no other place left to go but up." dYdX hit bottom, a new all-time low last month and is turning ultra-hyper bullish this week. The action is already moving above EMA8 and EMA13 while breaking a local downtrend coming off the December 2024 peak price.
We have a full green candle and this candle signals a recovery and the start of the 2025 bull market cycle. This cycle can last 6-12 months for this specific pair or longer. Remember that each project, each trading pair, each altcoin can produce different price patterns and dynamics. This is easy to see because here we have a new all-time low, other pairs hit their all-time low in April this same year while others did so in August 2024, others in 2023, some others in 2022, etc. Each pair/project should be considered individually.
Good strong projects trading at bottom prices have higher potential for growth. For example, you can certainly make more money buying and holding dYdX tokens vs Solana or Ethereum. Because the latter two are trading much higher compared to their all-time high and because these projects are much bigger. Smaller projects have higher potential for growth.
So all is good in Crypto-world the market is going up. dYdX is turning bullish just now but the bias is confirmed based on marketwide action. Seeing how the other projects are performing predicts what comes next. When the week closes above EMA8 and EMA13, you have a full blown bullish confirmation. The action already recovered from the ATL range and is happening above the 10-March and 7-April lows. This is enough to secure/confirm growth.
We buy low to sell high. We buy when the market is red and hold.
We sell when prices are high. We sell when the market is green and there is lots of hype all around. Lots of profits to be made. At this point in time, all that is needed is to choose wisely and practice patience, patience will be the biggest earner; patience pays.
Thank you for reading.
Namaste.
