GRT | Altcoins | MASSIVE UPSIDE Potential on The GraphAnother altcoin that has great upside potential is the Graph BINANCE:GRTUSDT
The Graph from a weekly perspective may seem like there's not much action, but if you zoon in to the daily timeframe we see a different picture.
WEEKLY:
VS DAILY:
We can see anything from a +40% increase to a -30% dip in just a few days; a picture that is lost when we look at the weekly. This is IDEAL for swing trading.
Once you've established the general direction from the MACRO, swing trades become very viable (spot). If your patient enough to wait for a few days, a +30% could easily be achieved within a two week timespan.
______________________
BINANCE:GRTUSDT
Altcoins

ALTCOINS made a 1D Golden Cross. First since U.S. elections.Crypto Total Market Cap just formed the first 1D Golden Cross ince November 6th 2024, which was right after the U.S. elections. The rally that followed made new highs. Since the Bear Cycle bottom, that is the 4th 1D Golden Cross and the minimum the market surged around such formation was +73.10%. This means that we can expected a 4.03T market cap at least.
## If you like our free content follow our profile to get more daily ideas. ##
## Comments and likes are greatly appreciated. ##

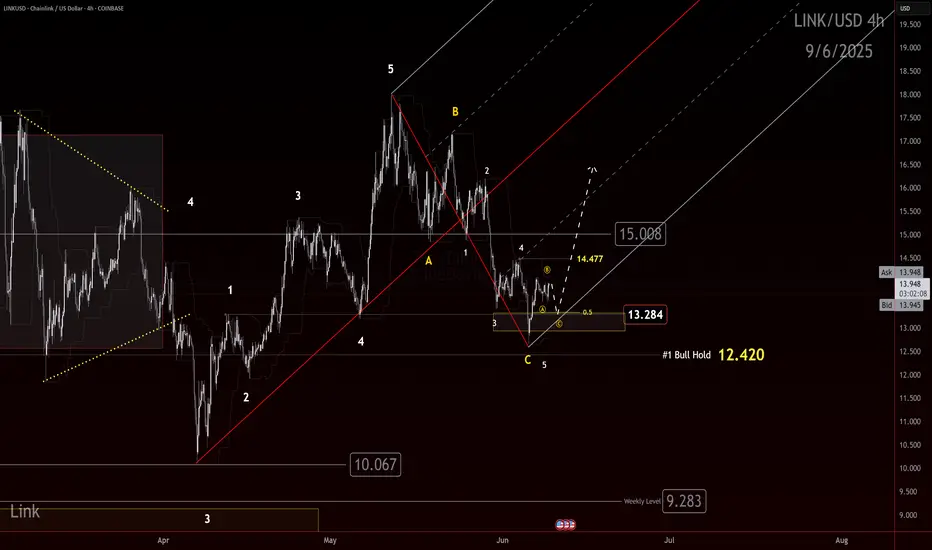
LINK Bulls Building Toward a Chain ReactionIf you find this information inspiring/helpful, please consider a boost and follow! Any questions or comments, please leave a comment!
LINK just gave us a clean reaction out of an identified box. Bulls may finally be gaining control and a trend shift up is on the table.
We had eyes on this box for a potential reaction. The market delivered. Now bulls need to prove they can build on it. The first key is to defend 13.284. As long as this level holds, the case for a higher trend remains alive.
Next, bulls need to clear 14.47. That is the first smaller degree LH that must be taken out to confirm that buyers are pushing through the structure.
The big step remains 15.00. This has acted as a major flipping level. A true test for the bulls will be whether they can reclaim and hold above it. If they do, the door opens for stronger upside follow through.
The path is clear:
💥 Hold 13.284
💥 Break 14.47
💥 Reclaim 15.00
We will continue to track this closely with the Elliott Scanner mindset. If momentum picks up through these levels, this could become an attractive higher-degree setup.
Watch these levels carefully. Bulls have work to do, but the ingredients for a shift are building.
Trade Safe!
Trade Clarity!
Bitcoin B-Wave Trap? Major C-Wave Down Correction Incoming!Bitcoin’s recent bounce has all the signs of a classic B-wave in an ABC corrective structure. After the impulsive A-wave down from the highs, this current rally appears more like a corrective relief move rather than the start of a new bullish impulse. Volume remains weak and the structure looks choppy — not the kind of strength you’d expect from a sustainable uptrend.
I believe we are now completing the B-wave, luring in late bulls before the real drop — the C-wave — begins. This next leg down could be sharp and painful, targeting key support zones and possibly wiping out the complacency that’s built up in the market.
🧠 Watch for signs of exhaustion in this rally.
📉 Potential C-wave targets: 98k 97k
⏳ Timing and structure suggest we’re close to the turning point.
Stay cautious. This could be the calm before the real storm.
---

Notcoin Updated Targets, Now 3,150%+ Potential Profits & Higher Notcoin's higher low is being confirmed right now; a second chance, a new entry zone.
This is a double higher low. The first one came in vs 10-March, the second one vs 7-April.
5-June 2025, Notcoin ended its small retrace which only lasted 22 days. Now that the retrace is over, we can aim up, aim high while updating our targets. See the difference:
» The first target, a very strong one now gives 725% potential for profits, from this point forward (current price).
» The second target is an amazing 20X+ or 1946%, wow. It gets better.
» The third target on this chart peaks at 3167%, this is huge and only time will tell if Notcoin (NOTUSDT) will go that high but I get the feeling it can go even higher.
The market always offers a second chance, but I don't think there will be a third. You can buy now or be left out. This is the start of the 2025 bull market. The last chance you will get.
Thank you for reading.
Your support is appreciated.
Namaste.

Pepe Support Confirmed, Bullish Continuation Next (Trade & Win)Support is now confirmed with four green days after EMA55 and EMA89 hold as support. PEPEUSDT is bullish now and set to grow.
The peak happened 24-May. The low 5-June.
This retrace lasted 13 days with a total drop of 36%. For future reference.
After each bullish wave, there is always a retrace or correction. In this case only a retrace because the bullish cycle is just getting started, the previous wave of growth was very small.
The next advance will be very, very strong so we can expect a correction after it. The difference between the retrace and a correction is about size. The correction lasts longer and goes deeper, that's all there is.
Expect maximum growth now but this won't be the end. It will grow super strong in the coming weeks and months, then we get a correction and then even more growth. But the fifth wave is the last one, after this we get a bear market so pay attention.
Pepe's support has been confirmed. This bullish continuation will turn the market full green.
Follow me to trade with me and win.
Namaste.

Pudgy Penguins PENGU Gearing Up for a +100% Move! 🐧 BINANCE:PENGUUSDT has completed its 5-wave advance from the April low (wave 1) and corrected with a 3-wave Zigzag structure in wave (2), reaching the buying area at equal legs $0.009 - $0.008.
🚀 Now, it's setting up for wave (3) higher, with an initial target at $0.022.
🌊 Are you positioned to catch the next wave higher?

Exploring Bullish Targets for Hyperliquid HYPE🚀 BINANCEUS:HYPEUSD has surged into a new ATH and the most bullish scenario suggests a nest structure forming.
🎯 This setup could lead to an extension beyond the 1.618 Fib level at $66, opening the door for +$100 range in the coming months.
Are you positioned for this breakout? What’s your personal target for this cycle?

Uma Update: How To Use Moving Averages For Trading SuccessThe moving averages can be an excellent tool for trading, you can use them to confirm where the market is headed next. I no longer use them as often as before but you can use them all the time to know which pair is weak and which one is strong.
When the action is happening daily above EMA55/EMA89, the bullish bias is confirmed mid-term. When the action is happening daily above MA200, long-term growth is possible. And it keeps on going with the shorter and longer EMAs.
I just mentioned EMA89 looking at Compound (COMPUSDT), the same signal is present here.
UMAUSDT produced three days green with really high volume. It was removing EMA89 as resistance, now it trades above this level which signals that the mid-term bullish bias is fully confirmed.
Without the EMAs plotted on the chart, we have this:
The last three days look like nothing special, just a small advance. But, when the moving averages are on, you know the bulls have taken control and it makes it easy to go LONG.
See the chart:
Now you know, we are set for long-term growth. It is not me saying it, this is the message coming from the chart. I am translating the chart. The chart is saying up.
Everything I share is data supported, it is all based on the actual market, that is why we produce such a high success rate. 100% data supported analysis. Simply the best. Don't you agree?
Thank you for reading.
Namaste.

Compound Gets Even Better —Bull Market ConfirmedThe trading pair COMPUSDT seems to be struggling short-term, daily timeframe, but what is actually happening? Why all the daily candles continue to close so small even while volume is high? Let me explain.
Resistance was present on the form of EMAs. Recently, COMPUSDT managed to break above EMA21 and EMA34, then EMA55. But one major level still needed to be taken out, EMA89. This is the blue line on the chart.
Two days ago COMPUSDT moved and close above this level. Yesterday, there was a Doji but no retrace. And today the action is green above $45.27 (EMA89). This is bullish confirmed.
See what happened back in November 2024, it is all the same. When COMPUSDT managed to close daily above EMA89, we have a massive bullish wave. It will be the same but different. The difference is that this time around the bullish wave will be many times bigger, prices will go much more higher.
Thank you for reading.
Namaste.

0X New Bullish Impulse, New All-Time High Late 2025I see bullish market conditions with a long-term growing base. Each time there is a correction, or bear market, the end price of the move is higher compared to the previous cycle.
The all-time high remains in 2021. This never breaks. There has been some bullish waves but not enough to break the 2021 ath. This time it will be different.
In 2025 we get a new all-time high. Or in early 2026 we get a new all-time high. No, for this one, in 2025.
So late 2025 ZRXUSDT will produce a new all-time high and this will be the highest price ever and it will be something truly awesome.
Right now the chart is great for buyers. If you are a bear (down-red) the chart is no good. The chart isn't good for a bear because it isn't going any lower. In fact, if you were to place a SHORT here, selling with a loan, then you would end up losing everything as prices move up. You would be certain to a receive a nice liquidation, all money gone.
On the other hand, buy spot hold strong or go LONG, and you are in a great place. While the downside is limited at best, there is no limit to how high prices can go in this upcoming bullish wave.
We are seeing the end of the retrace, the higher low after the initial bullish breakout after the end of a major correction.
Here the correction started in March 2024. The first low happened in August 2024 and the lower high December 2024. At the bottom 7-April 2025 the correction ends. The small bounce is the start of the next bullish wave.
So, March 2024 = 0
August 2024 = A
December 2024 = B
April 2025 = C
That's ABC. A classic correction. After a correction we get a bullish impulse and this simply means new heights for this pair. This new high will come in a set of 3 bullish waves with two bearish waves.
1 = bullish up.
2 = bearish down.
3 = bullish up.
4 = bearish down.
5 = bullish up.
1,2,3,4,5. That's the bullish impulse.
Namaste.

Altcoins Market Bull Market Confirmed, RavencoinI have something very, very interesting here, and it has two parts.
1) Ravencoin is breaking out with three digits green, +150% within today's candle.
2) This is very interesting because this is the exact same chart as all the other major and minor altcoins —What one does, the rest follows. It confirms the altcoins market bull market is here.
First, let me ask you something; Would an altcoin breakup by 150% in a single day in a correction or bear market? This only happens preceding a major bullish phase.
Ravencoin hit bottom early April, the low first happened on the 7th followed by double-bottom on the 9th. This led to a small recovery and now a massive bullish breakout.
All the altcoins we've been seeing, most of them, bottomed early April as well. All of these produced some growth between April and May. All of these went into a retrace late May to early June, and all those will start to break up soon.
The altcoins market bull market is already confirmed, this is proof.
Prepare for massive growth.
Thanks a lot for your continued support.
Namaste.

Cardano Bull Market, Bear Market & Price Action Dynamics Expl...The question right now relates to the short-term because we all know what is happening long-term.
There is a sequence of higher lows starting June 2023. The next one comes August 2024 followed by a strong bullish breakout. So the market is bullish.
The bullish wave enters a correction with a major low in February retested in April. Now we are looking at a short-term retrace and local higher low (2025).
The 7-April low leads to a bullish breakout and this breakout gets corrected, four weeks red. This is the fourth red week and the end of the retrace. From this point on, we will see growth.
The left side of the chart is always the past. The right side the present.
The bear market wave is hard to miss (left-red), it was straight down. The bull market period is different, it has been going in sequence. Strong jump followed by a strong correction. What we are about to experience is something different.
Instead of the action we saw in 2022, 2023 and 2024, we will see something more like the bear market but inverted, straight up. Something like 2021, bull market action. We miss it and we cannot remember the truth of it because it happened so long ago.
Let's summarize: Cardano is going up.
Namaste.

Bitcoin, Fast & Easy. $100,000 Support Holds +AltcoinsThe main support is not $100,000 but $102,000, so we make this a range. Yesterday, for the first time this range was tested and it holds easily... We are strongly bullish above $102,000 and Bitcoin is already trading above 103K.
This is really good news but we are not fully in the green yet. Bitcoin can continue sideways, consolidation, and only after closing above $106,000 we are looking for higher prices. Once $110,000 gets conquered, we can start talking about new all-time highs and sustained bullish growth. Meanwhile, the altcoins grow.
So we are not there yet but this is the best ever. For Cryptocurrency to thrive we need a strong Bitcoin and Bitcoin right now is very strong. Are you trading any altcoin? If you are, feel free to accumulate, load-up, buy and hold.
As for Bitcoin, here is a very easy trading approach:
While above $100,000, ALL-IN bullish confirmed.
If it goes below $100,000, stay out and wait to see what the market does. As soon as there is a support level created, we go LONG. If it goes below $100,000 just to recover the next day, we are again ALL-IN as soon as Bitcoin starts trading above 100K.
This process can be repeated many times but once Bitcoin takes off, buying below $110,000 is a major win because soon Bitcoin will be trading above $150,000. We have targets around $180,000 and even beyond $200,000 is possible this same year. Never forget the bigger picture.
The bigger picture is bullish for Bitcoin and the altcoins, the short-term can create confusion because the chart, market conditions, can change within hours.
But there can be a drop, a retrace or a market flush, but knowing that Bitcoin will be trading above $150,000 soon turns such an event into a non-event, it makes it into a simple hold.
The action on the side of the altcoins confirms that Bitcoin will continue to grow. Short, mid and long-term.
There is no retrace, there is no correction, only a small consolidation phase in anticipation of the next bullish wave. You already know this. If you didn't, now you know.
In 2025, Bitcoin will continue to grow. Just as it grew in 2023 and 2024.
We are entering bull market season. Bullish momentum will only start to gain force.
Namaste.

XRP Moves Forward—How To Maximize Profits, Aim At $4.5 Or Higher5-June gave us the confirmation for a higher low.
8-June is telling us the continuation of the bullish move is true. XRP moves forward.
How are you doing my friend in this beautiful Sunday?
I hope you are doing great.
The bottom happened 7-April, the peak happened 12-May.
24 Days for the retrace to be completed, between 12-May and 5-June.
It's been 27 days since we last saw some bullish action, almost an entire month.
I fully understand how people become bored, it is just too long, the market never moves straight up. But this can be taken in different ways. If the market were to move straight up, there is no chance to adapt, to recover, to plan and to learn. Now that the market made a full pause, we are ready for a new wave of growth and this time we can maximize profits on the way up.
How to maximize profits?
Hold strong. Hold long. Wait for higher targets.
Let's revisit the targets and how to approach them.
The "selling for profits" strategy where we sell a portion at each target is for blind traders. This method is used when we are trading with a high level of uncertainty about the next wave top. This method we can ignore here because we know where prices are headed next. To maximize profits with XRPUSDT, ignore $2.71, ignore $3.02, ignore the new ATH and aim straight at $4.51 with your full position with high lev. That's how to maximize profits.
Take some profits at this level only to buy more when the next retrace shows up. We are going higher, so you can keep on holding and wait for $6 or more. While we ignore the lower targets, when prices are higher we do not ignore them anymore. It doesn't matter how far up it goes, but we have to be careful after reaching $4.4.
Aim high because we are going high. The market is preparing for several months of sustained growth. Some of the older projects, mid-size and small size based on market cap., are showing signals of an entire year of bullish action ahead. It is not yet confirmed, but if it happens, this will be the biggest and best bull market in the altcoins history. A very big one.
For example, XRP peaks early because it started early and we get maximum profits from this pair. When the correction starts for XRP, the rest of the market continues growing. We can move capital from this pair to smaller pairs. And there will be thousands of those.
While XRP can grow 50% in a matter of weeks or months, a small pair can grow 150% in a single day. We have to take advantage of the big and the small ones. Diversification.
If you enjoy the content, consider follow.
Thanks for the continued support.
I'll see you at the top.
Namaste.

QNT Accumulating Under Resistance — Big Move Ahead?QNT is showing strength, but a key test lies ahead.
After breaking out of its previous downtrend (red line), QNT has formed a strong rising structure supported by the blue trendline.
The price is currently consolidating just below the key resistance zone, attempting to gather momentum. This is a classic sign of healthy price action — retesting higher levels while maintaining support.
As long as QNT holds the strong rising support line and the lower support zone, the bullish structure remains intact. A clear breakout above the resistance zone could trigger the next leg higher.
However, if price breaks below the rising support, we could see a pullback toward the lower zone for re-accumulation.
For now — it’s a wait and watch at the resistance. Bulls need to prove their strength.
DYOR, NFA

Altseason Index Proxy (TOTAL3 / BTC.D) Weekly TF
Symbol & Timeframe:
* **Symbol**: CRYPTOCAP\:TOTAL3 / CRYPTOCAP\:BTC.D
* **Timeframe**: Weekly (1W),
* **Purpose**: A clean, data-driven proxy for detecting altseason momentum
Technical Structure:
✅ Key Support Zones
* **13.47B (61.8% Fib)**: Critical golden zone; current price consolidation area
* **12.45B (50.0% Fib)**: Lower bound of golden zone
* **11.00B**: Historical support zone
* **8.15B (0.0%)**: Absolute bottom of retracement range
🔹 Hidden Bullish Divergence
* **MACD Histogram & Signal Lines** show hidden bullish divergence
* Price action forming **higher lows** while MACD makes **lower lows**
* Indicates trend continuation potential
🔢 Fibonacci Targets
TP1: 16.8B (100.0%)
TP2: 22.2B (161.8%)
TP3: 30.7B (261.8%)
🔄 Expected Path
* Potential short-term correction toward 12.4B followed by a breakout
* Bullish continuation path sketched with progressive Fib targets
📈 Macro & Fundamental Confluence
📉 Liquidity and Monetary Easing
* Global monetary policy is easing (e.g., Fed pivot expected mid-2025)
* Increased liquidity historically precedes strong altcoin rallies
BTC Dominance Decline
* BTC.D rolling down from long-term highs
* Signals beginning of capital rotation into altcoins
🚀 Emerging Narratives
* Rise of L2s (e.g., Base, zkSync), AI tokens, real-world asset protocols
* Fresh narratives tend to amplify altseason rotations
💼 Institutional Tailwinds
* Spot ETH ETF approvals pave way for alt ETF flows
* Regulatory clarity expected to reduce uncertainty in late 2025
Related Reference Charts:
🌐 TOTAL3 (Altcoin Market Cap Excluding BTC & ETH)
📊 BTC Dominance (BTC.D)
These charts offer standalone confirmation of:
Altcoin strength forming on TOTAL3
BTC dominance facing structural resistance
Composite Altseason Thesis:
1. Liquidity injections + halving = BTC rally
2. BTC.D breakdown + TOTAL3 support = altcoin strength
3. Technical confirmations: hidden divergence, fib confluence
4. Narrative and regulatory catalysts = widespread rotation
**Conclusion**:
We are entering a prime zone for altseason acceleration. Price reclaim above 13.47B and continued BTC.D drop will validate bullish thesis. Monitor closely for breakouts past TP1 and momentum into TP2/TP3.
📌 Current status:
- Price rebounding in the 12.45–13.47B Fibonacci zone (50–61.8%)
- Hidden bullish divergence on MACD + ascending price structure
- BTC.D has rolled off 65% resistance — suggesting capital rotation
📊 Altseason Thesis:
1. Post-halving BTC rally → profit dispersion into altcoins
2. Macro conditions (Fed pivot, record liquidity) enabling risk-on environment
3. Technical confirmation via index momentum and fib structure
4. Narrative tailwinds: Layer-2 adoption, AI-crypto, altcoin ETF catalysts
📈 Targets:
- TP1 @ 16.8B (100% Fib)
- TP2 @ 22.2B (161.8% Fib)
- TP3 @ 30.7B (261.8% Fib)
🟢 Key support: 12.45–13.47B zone; breakout + BTC.D collapse = altseason trigger.

Everything Bitcoin Cash Points To a New ATH; $2,600 or $4,150?Bitcoin Cash is bullish, ready to grow within the bullish zone. There is zero doubt. I think it will be hard to know if the peak will happen around $2,600 or $4,150. There is a huge difference.
Knowing how erratic BCH has been in the past, we have to go with the second higher target; what do you think?
It is hard to say but we have two targets mainly for late 2025. There is no doubt that we will get a new all-time high we just don't know how high.
I will go with the second one just in case. Say this bull market top for Bitcoin Cash will reach somewhere around $4,000. Can be more or less.
You can leave a comment with your number.
How far up do you think Bitcoin Cash will go?
And remember, the bullish bias is already confirmed. Everything points up. The chart, the indicators, the patterns, the signals, the overall market, everything... Thank you for your continued support.
If you enjoy the content make sure to follow.
Namaste.

Litecoin —It's All In Your Mind, Time To DecideTruly the longest consolidation phase has been experienced, since June 2022 until June 2025. This consolidation produced a broad channel for Litecoin but, make no mistake, this is a trading range.
The difference between a rising channel where consolidation is happening and a very strong bull market is the slope of the rise. The bull market price action produces a much stronger rise, as shown by the bars pattern.
The action becomes more erratic to the upside rather than stable and sideways. The market becomes euphoric because people cannot handle all the money they hold. Your account balance grows and grows and grows, so much that you lose all control. So much that you forget it, so much that you don't take action and then everything is gone.
It is incredible but still, many people do take advantage and those are mainly the ones with experience.
The first time we get it wrong. That's ok, we've all been there, nobody to blame rookie mistake.
The second time we do better but we still feel we could have done even better. If only we had more organization, more time to prepare; more experience...
The third time... This is the third time.
Thousands of millionaires are created in each bull market, tends of thousands, are you going to be one of those?
There is no competition. For you to make money nobody else has to lose money it doesn't work that way. It is different; the market gives, the market takes.
If you are ready to accept a lot the market will give you a lot.
If you are here to lose money the market will take everything away.
It is not about the whales, the bots or the exchange... It is all about you, it is all in your mind.
Some people join the last few days and make millions by buying big and selling right away, over and over. Some people lose millions by going LONG going SHORT when the market is neither going down or up. Some people are playing games.
You just need to decide, consciously and unconsciously what is your true goal. If you want financial independence, financial abundance, financial freedom, just make your choice. Say it, write it, see it, feel it... Believe it, and everything you want will be yours.
There is no limit other than your own mind.
The market will give you whatever you are ready to accept.
If you work for 10 millions dollars, that's exactly what you will get. But, if you work for 100 millions, hundreds you will get. There is no limit. It is all in your mind.
Namaste.

Internet Computer Protocol $81 Easy Target Yields 1,450% ProfitsIf you saw the Injective chart you know what happens after a correction, a classic ABC correction. What follows a correction is a bullish impulse.
A target of $81 gives us more than 1,450% profits potential for this pair, ICPUSDT (Internet Computer Protocol).
This is a project that was damaged by the SEC's decision to label it a security, remember? The SEC today is no longer the same as back in those days. It is different now. The SEC is crypto-bullish, the SEC is friendly and whatever damage was caused will be reversed, make no mistake.
Right now ICP is moving within it's long-term accumulation zone. As the name implies, a zone that is good to buy for those focused on long-term hold. Even if you are looking at the short-term or mid-term, this right now is a great entry, great timing, the best possible prices preceding the 2025 bull market phase.
It was a while back when I first saw the possibility of the bull market extending beyond late 2025. This scenario/possibility is now becoming stronger with many projects supporting this view. The chart of many stable, long-term projects are pointing to growth leading into the first half of 2026. Q1 and Q2 2026. This would definitely be the best ever.
Will the next bull market peak in late 2025 or early 2026? Make your guess. What cannot be doubted is that we are going up next. Up, up, up. Are you prepared?
Preparation comes in the form of a plan, and lots of money injected into the market. Buy like the world is about to end. Start buying and continued buying, everything you can. You will be very happy with the results, I promise.
Thank you for reading.
Namaste.

Vechain, Pick Your Own All-Time HighA mirror image from 2020-2021 would put a new all-time high for VETUSDT (Vechain) around mid-May 2026. Starts late ends late, right?
This is a great chart. Vechain hit bottom June 2023 and has been consolidating within a rising channel. A rising channel as in higher highs and higher lows. Now, this is bullish but still not a bull market but bullish consolidation.
Consolidation can happens in three different ways:
1) Purely sideways. When the action happens within a range.
2) Bearish consolidation. When consolidation produces lower highs and lower lows.
3) Bullish consolidation. As we see here, with higher highs and higher lows.
Now, this is bullish but still only part of the transition period. Bull market action is what you see on the left between March 2020 and April 2021. Notice the huge difference.
Some other projects have been producing lower lows but this isn't a bear market more like bearish consolidation. We are about to enter the bull market phase. And this phase tends to end in a bull run.
If the same pattern from 2020-2021 repeats, we can see a new all-time high in May 2026. I have four new ATH projections on this chart, pick your own.
Thank you for reading.
Namaste.

IOST: New All-Time High May 2026? Interesting... Must Read!The lowest price ever for IOST happened March 2020. The second lowest happened April 2025. We shouldn't expect for IOSTUSDT to go as low as March 2020, we can easily say/predict/assume that the bottom is already in.
Let me show you something really interesting.
IOST entered a bull market after the March 2020 bottom, supported by easy money. The bull market from bottom to top lasted 399 days.
If we do a time-fractal and project 399 days into the future counting from the April 2025 low, this would give us a date of May 2026. Interesting. We are set to have easy money this year as well, same conditions as in 2021.
I've been saying late 2025 or early 2026 for the full bull market to unravel, but this is an interesting date. I don't know how long the bull market will last, I don't know how far up prices will go. There is only one thing I know 1,000% certain, safe, Crypto is going up.
IOST already hit bottom and is printing a higher low. This higher low marks the start of the next leg-up, the continuation of the bullish impulse. This impulse should last a long time, long-term growth.
It would be awesome if we have a bull market until mid-2026, but be prepared for anything to happen. The most important action right now is to accumulate, buy while prices are low and hold. Hold strong. You will be happy with the results.
It will take a while but it is something certain. The bull market can end later this year or in 2026, that's ok. As long as everything grows, we can produce financial success. Financial freedom. Financial independence. Financial abundance. It is all yours to take.
Namaste.

Injective & Elliott WavesAn impulse leads to a correction. A correction leads to an impulse.
The chart here starts with a bullish impulse. 1,2,3,4,5—blue-left. This impulse leads to a correction. ABC—orange.
The first ABC correction, the bear market, ends June 2022.
A correction leads to an impulse so a new bullish impulse starts right after and we have a new 5-up waves. 1,2,3,4,5—blue-center.
The bullish impulse ends March 2024 and this leads to a new ABC correction. Orange-right. The correction hits bottom 7-April 2025. The end of the correction signals the start of a new bullish impulse, 1,2,3,4,5 blue-right. The 2025 bull market.
This is Elliott Wave Theory simplified.
Namaste.
