$SUI: $2.95 must hold!CRYPTOCAP:SUI is following the broader altcoin market and entering a correction phase. As shown in the chart, CRYPTOCAP:SUI has already broken through two key support levels and is now hovering just above a critical support at $2.95.
If this level fails to hold, the next major support lies within my green box at $2.20 — which could present a strong buying opportunity.
However, proper risk management is essential — make sure to place your stop losses accordingly.
DYOR (Do Your Own Research).
#SUI #Altcoins #CryptoCorrection #SupportLevels #BuyTheDip #CryptoTrading #TechnicalAnalysis #DYOR
DYOR
Altcoins

XRP Looking Better But... Mixed. Comment, Support Me!XRP is looking much better now. It closed four days green after a higher low but something is off.
I mean, it is good you can see the chart the rising channel but I am sensing some weakness. There is zero volume.
Normally, when the retrace ends and produces a higher low there is always at least a small spike in volume. But, it can happen that there is no volume because it is early and there will be long-term growth and so volume only shows up when resistance is being removed.
Since doubt can creep upon us we focus on the price and the chart.
Higher low the bears showed no strength with several days green we can see prices continue to increase. Let's keep it easy.
Set at stop below $2.07 and go all-in. Do what you think is right already LONG on XRPUSDT since 30-May. We have to wait and see for the market to produce the results.
I mean, what is your take?
You are an expert too give me something, give me something in the comments because it is not an easy chart but it is clearly pointing higher. The problem is that sometimes the chart signals are fake.
Leave a comment with your view.
Thank you for reading.
Namaste.

TOTAL2 – Altcoin Market Cap (Weekly TF) 2025
**Summary:**
The TOTAL2 chart (crypto market cap excluding BTC) is showing a structurally bullish formation after a deep retracement and a higher low confirmation. This setup suggests a potential multi-phase rally toward 2.98T and beyond, with defined support zones and Fibonacci targets aligned with liquidity cycles. This analysis visualizes the expected roadmap based on trend-based Fibonacci extensions, retracement levels, and psychological market phases. Notably, the outlook includes the possibility of an initial correction to retest strong support zones before the market begins its ascent.
**Chart Context:**
TOTAL2 represents the aggregated market capitalization of all crypto assets excluding Bitcoin. Historically, it reflects capital rotation into altcoins, especially following BTC dominance peaks. The current chart shows strong reaccumulation above the 1T support zone, with Fibonacci confluences hinting at a sustained recovery pattern. Dotted arrows illustrate a wave-like projection of accumulation, rally, retracement, and expansion. The possibility of a near-term correction to lower support zones is also embedded in the path structure.
**Key Technical Observations: and Levels**
TP1 = 1.78T
TP2 = 2.05T
TP3 = 2.4T
TP4 = 2.85T
* **Secondary Fib Retracement :** 0% = 1.23T, 100% = 425.89B
* Key zones: 23.6% = 1.04T, 38.2% = \~840.42B, 61.8% = \~569.41B
Possible Support Levels: 1.04T, 930B, 840B, 766B, 735B,
* **Trend-Based Fib (A-B-C):** A = \~420B, B = \~1.23T, C = \~735B
* This projection aligns with TP1 at 1.78T
* **Support Area:** Around 1T psychological zone (930B)
* **Strong Support Zone:** 735 Bto775B
* **First Target Zone:** Between 1.73T and 1.89T (early resistance + Fib cluster)
**Indicators:**
* Weekly structure forming higher lows
* Long-term Fib retracements respected
* Trend-Based Extension projecting 1.618 move
* No divergence, confirming strength
**Fundamental Context:**
* Liquidity conditions are improving globally with rate cuts expected into late 2025.
* ETH and ecosystem tokens are likely to lead altcoin recovery.
* Regulatory clarity and ETF flows add legitimacy to broader crypto allocations.
* Historical alt-seasons emerge from BTC profit rotation—TOTAL2 leads that shift.
* However, several macro risks may trigger a correction before rallying:
* The Crypto Fear & Greed Index is currently high, suggesting overbought conditions.
* Macroeconomic uncertainties (e.g., inflation, rate hike fears) can suppress short-term risk appetite.
* Regulatory tightening across major jurisdictions introduces hesitation in capital deployment.
* Technical signs of a five-wave drop in BTC hint at a larger ABC correction scenario.
* DAT (Digital Asset Treasury) exposure among public firms may lead to forced liquidations during downturns.
**Philosophical or Narrative View:**
This is not just a market cycle—it's a reflection of decentralized innovation reclaiming narrative dominance. After fear-induced lows, TOTAL2's rise echoes the resilience of builders, protocols, and investor conviction. Each Fibonacci level acts like a checkpoint in the unfolding story of crypto's evolution beyond Bitcoin.
**Related Reference Charts:**
*
**Bias & Strategy Implication:**
* **Bias:** Bullish with short-term corrective risk
* **Accumulation Zone:** 1.0T–1.23T
* **Initial Risk:** Price may revisit the **Support Area (1T)** or even the **Strong Support Zone (775B–725B)** before a sustained move higher.
* **Partial TP:** 1.78T–2.05T
* **Extended TP:** 2.4T–2.98T
* Caution near TP4–Bonus zones as distribution risk increases
* Invalidated if closes below 725B (structure break)
**Notes & Disclaimers:**
This is a structural macro outlook and not financial advice. Markets are dynamic and subject to rapid shifts in sentiment, liquidity, and regulation. Always use risk management.

Polygon, Higher Low? Easy 1,000% Profits PotentialFour weeks red! Do you really believe the market will continue moving lower? If the answer is yes; think twice, stop! Think again.
Four weeks red is all that you will get you bearish bastard.
Your time is over. We are taking over, the bulls are entering the game.
You had your fun, you had it for a few days.
You can't have it anymore, I am calling my friends.
Friends, look at Polygon (POLUSDT), the chart looks great.
Whenever there is a retrace within a bull market, this is an opportunity to enter again.
Great timing, great prices; the start of a new bullish wave.
Prices are about to grow... Everything is about to grow... Crypto is going up. Are you in or are you out? Did you miss the initial bullish breakout? That's ok. The next bullish wave will 4-6 times bigger than the previous one for this pair. Sometimes even more. Here we have 1,000% profits potential as an easy target.
Get ready and be sure to be prepared.
Start buying like the world is about to end. Why?
Because there will be so much growth in the coming days, that you want to profit all the way. To profit you need to be in, you have to buy when prices are low.
You cannot wait for the green candle, the best time is now.
Thanks a lot for your continued support.
Namaste.

Sui Turning Green ($6.65 Target = 100%+ PP)Just like that Sui was red for 24 days. 24 days might not be that long but when you consider that the rise lasted 35 days, then yes, within this context it is a very long retrace... And look at the levels on the chart.
Support found at 0.5 Fib. retracement. This level was pierced followed by a recovery the next day. Double-bullish signal; the recovery and the fact that 0.618 wasn't tested.
I can honestly say that it is still early, but I can also say that this zone where the bounce just happened is a very strong classic support zone. This support zone can lead to the next leg-up, a strong rise with targets reaching $5.19 and $6.65.
The chart looks good for a new bullish wave. The $6.65 target means more than 100%. Taken from the 7-April low, we are talking about a 285% total growth, profits of course. And this wouldn't be the end, only the start.
SUIUSDT has much more to give. We can expect the market to turn and remained green.
Namaste.

Ethereum: No Sellers, No Bears, No Pressure; Bullish ConfirmedTo put it simple, there is absolutely no selling pressure on ETHUSDT. And this is reasonable, Ethereum is now so cheap that not many people are looking to sell.
Let's dive into this chart and see what we can find.
Spoiler alert: I am no longer bearish on ETHUSDT. "The retrace" simply isn't a thing on this pair. There is no bearish action. Let's read the chart and see what it has to say.
The low 7-April... Ok.
8-May ETHUSDT produced a very strong green candle to break above EMA55 and EMA89. Volume was also high on this date. These levels tend to work as strong resistance and the fact they broke decisively, means that the bullish bias is confirmed and Ethereum isn't likely to move back below again. Whenever there is a drop, these lines will work as support.
The peak soon happened and Ethereum went sideways, it has been sideways in a small phase of consolidation. The lowest point came 18-May. There was a failed attempt by the bears to push prices lower but this ended as a big fail. Ethereum continues strong.
Here we have again EMA55 and EMA89, magenta and blue lines on the chart. These levels remain untested as support which is a signal of strength. While some pairs went down 20%, 30%, 50%, Ethereum's maximum drop has been 14%, now, that's strength.
As seen from the diagram on the chart, we are about to enter the third wave of a bullish impulse. There can be a correction after the third wave ends followed by additional growth.
The break of EMA55/89 as resistance confirms that Ethereum is bullish mid- to long-term. This means 3-6 months of growth.
Once MA200 is broken as resistance, we have at least six months of bullish growth confirmed, this will happen later this month.
No bears means the bulls are in control.
A very small retrace means buyers are strong.
It all makes sense, who would be willing to sell their Ether when there is so much room left for prices to grow?
No one, that is why prices remain strong.
Adapt to market conditions fast and live.
Some pairs are going down while others are going up.
Some pairs are sideways; some are growing strong.
This is the early stage of the 2025 bull-market, just wait and watch... Just watch! It will get wild faster than you think and it will become so wild that you won't be able to handle the market at all. Everything will become so good, so fast, that you will feel blessed for deciding to enter the Cryptocurrency market during April's low.
It is still early though, remember, $7,000 is the minimum price for Ethereum in late 2025. $11,000 is also possible.
Thanks a lot for your continued support.
Namaste.

XRP Bullish, The Retrace is Over! Aim HighWhat we need to consider here is the size and duration of each move.
The rise from 7-April through 12-May amounts to 64%.
The retrace from 12-May to present week amounts to 24%.
» So the retrace is more than a third part the size of the advance.
The rise lasted 6 weeks.
The retrace so far has 3 weeks.
» So the retrace is half the length of the rise.
Both these readings are super standard for a bull market. A retrace can easily end this week or early next week followed by 2-3 months of growth. Within this new wave of growth, there will be other retraces but a correction only comes at the end of the main wave. After the correction comes another advance and then a bear market.
Ok. We have a higher low and the chart is pointing up.
After three weeks of bearish action there is no sellers pressure, trading volume is really low.
The bears have no steam, no force, no momentum; the bears are gone.
Knowing this, we can aim high...
The retrace is over!
Thanks a lot for your continued support.
Namaste.

Solana Bullish, Retrace Over! Aim For $620 or $1,020 In this 2025 Cryptocurrency bull market, you should be aiming for $620 or $1,020 for Solana, $420 is the minimum.
How are you feeling today my dear friend?
I hope you are having a wonderful day.
Retraces and corrections, they can only last so long.
Solana dropped from $188 to $141 and I believe this is enough, a 24% drop (-24%).
As the retrace ends, the chart will produce a higher low and, as the higher low becomes confirmed, SOLUSDT starts a new wave of growth.
$420 is the minimum target for this bullish wave and should hit first but, you should aim higher, much higher. Crypto is showing to be many times stronger than what most people think.
Remember, the mistake we always make is not aiming too high but aiming too low. In each bull market, we tend to underestimate the market. Aim high, because we are going up.
Retraces and corrections are an opportunity to buy-in, 2nd entries, rebuy and reload.
Don't try to SHORT within a bull market, it is dangerous and not worth the risk. It is better to wait for support and go LONG. Always trade with the trend, specially if you are using leverage. Crypto is going up. Solana will now turn green.
Thank you for reading.
Namaste.

Aave Bearish, Be Aware (Do Not Buy Now, Sell or Wait)Aave grew almost 150% in 50 days. Now the market is entering a correction phase. Not a true correction only a retrace but it is almost the same.
The rising wedge is a bearish pattern. It is coupled with very low volume.
The action moved out of the rising wedge; bearish confirmed.
There is a local lower high and this points to lower before the market turns bullish again.
We keep it simple. We either wait or SHORT, but we do not buy here.
» If you are a bull, you can wait for prices to move lower to buy again or you can sell.
» If you are a bear, you can SHORT; this is an easy trade.
The market will confirm my analysis in a matter of days.
This is very easy of course.
Thank you for reading.
Stay (protect your money) safe.
Namaste.

Solana Short-Term, Already Bearish After 97% UpWhat will happen in the long-term? Before we get there, let's focus on the short-term real quick because we want to know what is happening with the market now.
The market offers endless opportunities. We need to take advantage of those, our edge. We have an edge and this edge is being able to read the chart. With this edge, we can time the market and increase our trading success.
Solana grew by 97%. This is good. Of course, some pairs grew way more while others grew less. I did mentioned that when Bitcoin grows 50%, some Altcoins can grow 300%. This is exactly what happened, this is because of the size of the projects.
Some pairs grew more but these were smaller pairs. Some pairs grew less but these were bigger. That's just the nature of things.
This 97% bu-wave can be correlated to a 300-400% bullish-wave on other pairs. This means that after a growth wave comes a correction.
SOLUSDT—two main interesting levels. Won't mention them as they are shown on the chart.
Both are likely to hit but the first high is really high probability.
This is easy. Wait for support before buying again. I say "again" because you are supposed to sell at resistance, we are assuming you sold at resistance and are ready to buy at support.
Good? We are good.
The market will continue to move down and up while long-term it produces sustained growth.
We need to adapt fast and be smart, everything can change in a day.
Keep an eye on the news, we might be in front of some major event.
Political events can change everything and cannot be predicted.
Thank you for reading.
Namaste.

Ethereum Danger Zone —Protection, Correction or Continuation?Ethereum can be seen trading below EMA55 on the 4H timeframe. The biggest volume session happened 9-May and it was red. This tells us that there is correction potential after a very strong 101.1% bullish growth wave.
There are mainly three levels to consider for the correction potential after ~100% growth. 0.382, 0.618 & 0.786 Fib. retracement levels. After the test of these levels, whichever one comes last, we can read the chart again and see if Ethereum will continue lower or produce a bullish wave.
One thing is very certain though, after strong growth, there is always a correction/retrace. This is what you are seeing now in this chart. The start of the drop. Taking action is best.
The market moves in waves and will never stop this pattern, it fluctuates. To trade, one buy lows near support; sells high when resistance hit. 100% growth is very strong for the second biggest Cryptocurrency project, the #1 Altcoin.
After a strong bullish wave there is always a correction. After the correction there can be more correction but at some point the market turns. Each chart/pair needs to be considered individually on multiple timeframes to have a better understanding as to what will happen next.
In a single day, based on the news, market conditions can always change. Stay alert!
Namaste.

Will Solana Go Lower? Yes! Only To Recover HigherI've been asked: Will Solana continue lower?
I think it is a fair question but it is also pretty hard right now to say based on the chart, there are just too many mixed signals.
For example, if we take Solana in relation to Bitcoin, it is trading daily below EMA55 and MA200, while Bitcoin is trading daily above these levels. Bitcoin hit recently a new all-time high while Solana only produced a small recovery in May.
When it comes to the chart signals, SOLUSDT produced a volume breakout on the bearish side and the support zone was completely challenged on a single candle. What's more, Solana will grow really strong later this year, so it would be normal to see as much bearish action as possible now because later we will have sustained long-term growth.
It is a coin flip, but if you ask me, it can go a bit lower before moving up. It can go lower to end up producing a higher low.
I will wait for clear reversal signals before going LONG.
I closed all my LONGs a while back, when it became clear that the market was going into correction. Now we can just wait easily and patiently until the correction unravels, after the correction comes a new wave of growth. Down and up, down and up... The market continues to cycle. Never straight down, never straight up. It moves in waves.
Namaste.

Ethereum, Guessing The Next Move ($1,500 or $2,000?)The million dollars question; What about Ethereum, lower or recovery?
And this is truly a million dollars question because knowing the answer can make you millions. It can either safe you lots of money or it can make you lots of money.
👉 Ethereum is going lower.
The 18-May low happened at $2,323, and this low wasn't challenged, the drop yesterday ended as a higher low. But, there is something... We lost some important support levels.
ETHUSDT lost the 0.236 Fib. retracement, when this happens, the action tends to move to the next lower-level which is below the 18-May low.
Looking at the 4H TF, ETHUSDT lost EMA55 and MA200, so these are also pointing lower.
Just a few days back I mentioned $2,000 entry LONG opportunity for Ethereum, this price might be possible but it is still really early.
The market has been sideways and this breakdown is new. It would be good to wait for the weekly session close to see what prices we will get, without this information, I can say that it is still too early to say, but I can still make my guess. My guess is that it is going lower.
Thank you for reading.
Namaste.

Chainlink Support Remains Intact, Short-Term Noise (10X)Notice here Chainlink on the weekly timeframe. This week wicked below our strong support on the chart marked by a blue dashed line, this level is the 0.618 Fib. retracement ratio. The baseline of the v shaped bottom and also the bottom formation of 2024.
The retrace, bearish action, so far has been going for four straight weeks. The entire rise was five weeks longs. I mentioned this previously. This means you can easily go ALL-IN on this type of chart setup, buy and hold.
The retrace can never be longer than the drop. The fact that support is holding means that Chainlink will continue growing, will resume its bullish wave. A bullish continuation.
This is a friendly reminder. I know it is hard, but this type of setup is where experts open LONG with 10X. I am not saying that you should, I just want to show you how we are attracted to and tempted to buy when the market is red. That's the time to go LONG. We sell (SHORT) when the market is green.
Thank you for reading.
Namaste.

Mask Network, High Volume & Back To Baseline (More Up Yes!)This is not the only altcoin that has been growing strongly since early April. MASKUSDT hit bottom 9-April and has been growing since, producing a total of 210% growth. There are many, many pairs in this same situation. We've been looking at those.
The crash was really strong in early April producing a huge rounded bottom. You know what I say, when there is a crash, fast down, there is a strong recovery, fast up. The baseline becomes the range before the major move; orange on this chart.
Mask Network moved above the baseline level with really high volume and even broke above the 1-April high, hitting today the highest level since mid-January 2025. That is more than five months of bearish action fully recovered.
This is not the end, truly just the beginning.
For trading purposes, growth potential, you could remove the breakdown portion and start counting as if the market was sideways. Meaning, there is plenty of room available for growth for this pair.
What one does, the rest follows.
The fact that Mask Network is bullish confirms that the rest of the market will also grow.
Everything had a crash in April, everything had a recovery in May, everything will be super bullish in the remaining half of 2025.
Thank you for reading.
Your support is truly appreciated.
I'll you see at the top. That is where you belong.
Namaste.

The Trading Rookie, How I Don't Make Money Fast & Waste TimeThe bottom is set and once the bottom is in bullish momentum builds up and grows. Bullish momentum is now present on this chart coupled with really high volume. The high volume is what confirms the current move being real and strong. ICXUSDT daily.
When they are not moving nothing can move them. But when they move they move.
We have the bottom and this is good so we only need a continuation and the continuation will come. Notice that this is the same chart as other altcoins, most altcoins.
This is very simple. I just wait.
If you jump in without a plan and prices retrace tomorrow, you will desperate and fold, sell at a loss. Then just three days later ICXUSDT continues to grow. You see how that works? Three days is not a long time.
It happens that the wait can take weeks but some people are ready to earn today, today alone and today only. Here is how that mentality works.
Let's say the unexperienced trader (me) do manage to buy before prices start to grow. "Awesome, finally I got one." Chasing after the next breakout everyday. The pair goes up 10%, 20%, 30%. Then stops and retraces for a few days. The rookie manages to hold and then boom, a nice 50% jump. Total growth some 70% from entry point considering the small retrace.
At this point, the rookie finds out everything about the pair he holds and prepares to "hold long-term." The pairs keep on growing and profits now reach 100%. Instead of securing a trade, a very nice double-up, 100% profits, the rookie becomes greedy and continues to hold.
The action peaks at 120% profits. From the bottom total growth reached 320% but he didn't get the bottom of course he bought when the action was already underway. Next comes the correction and selling is still not even a possibility because remember, I will hold long-term.
Long story short, when the correction hits bottom, the rookie is ready to give up. He sells everything beat down and depressed. "Crap, I missed another bullish wave." The next day, as soon as he sells the bottom prices start to grow... And the cycle repeats.
This time, instead of buying crazy or being crazy, just trust my call.
Buy those trading at the bottom. Those that everybody ignores. I share these in my profile. Wait patiently and then the market will grow. You cannot earn 500% on a pair if it is already moving, it is impossible. The only way to earn big is by buying when prices are low. Hold strong, hold long and as the bullish cycle develops, your money grows.
Short-term trading is also do-able but requires more experience and planning. When the pair is up 20-30%, you can collect profits. This can also be done at 80-100%, it depends. It depends on your trading style, your capital, your goals... It all depends on you. How are you going to profit from this 2025 bull market bull-run?
Namaste.

3️⃣ Altseason and the US "Crypto-Reserve"3️⃣ Altseason and the US "Crypto-Reserve"
❗️ Disclaimer: This idea is only a part of an article with a forecast for Bitcoin and the cryptocurrency market for 2025-2028. To fully and completely understand what is being discussed here, please refer to the root idea via the link:
1️⃣ Main Idea: Analysis of US Treasury Documents
TradingView recently added an interesting new ticker: $CRYPTOCAP:OTHERSBTC. It represents the ratio of the total market capitalization of the top-125 cryptocurrencies, excluding the top-10 by capitalization (OTHERS), to the market capitalization of Bitcoin (BTC).
What does it measure?
OTHERS (Total capitalization of other altcoins): This is the aggregated market capitalization of cryptocurrencies that are not in the top-10 by capitalization. In other words, it's a metric that allows tracking the dynamics of "small" and "medium" altcoins, excluding the influence of the largest players (such as Bitcoin, Ethereum, and other large altcoins in the top-10).
BTC (Bitcoin Market Capitalization): This is a standard metric showing the total value of all circulating Bitcoins.
Thus, OTHERSBTC shows how "small" and "medium" altcoins generally relate to Bitcoin in terms of market capitalization. Why is this needed? This ticker is an important indicator for assessing the "altcoin season" and the overall sentiment in the cryptocurrency market:
⬆️ Growth in OTHERSBTC: Means that the market capitalization of "other" altcoins is growing faster than Bitcoin's market capitalization (or falling slower). This often indicates the beginning or continuation of an "altcoin season," when investors start shifting funds from Bitcoin to riskier but potentially more profitable altcoins. This can be a sign that the market is becoming more risk-on.
⬇️ Decline in OTHERSBTC: Indicates that Bitcoin is growing faster (or falling slower) than "other" altcoins. This may suggest that investors prefer safer assets, or that Bitcoin's dominance is strengthening. This often happens during market corrections or when investors seek refuge in Bitcoin.
📈 Analysis of the main chart: OTHERSBTC
The fact that the OTHERSBTC index has been in a downtrend since the beginning of 2022, I think, is not difficult to understand:
A decline in OTHERSBTC directly means that the "altcoin season" has not fully arrived or has been absent since the beginning of 2022.
For a full-fledged "altseason," OTHERSBTC should show sustained growth, meaning that "small" and "medium" altcoins are outperforming Bitcoin in terms of capitalization growth. This is not happening yet.
Current market state: The decline in OTHERSBTC since 2022 confirms that the market has been in a bear phase, and after that – in a recovery phase where Bitcoin leads, and altcoins (especially those not in the top-10) are recovering slower or not at all.
Thus, the decline in OTHERSBTC since the beginning of 2022 is a direct reflection of the bear market, decreased risk appetite, and increased Bitcoin dominance during a sideways period for the rest of the crypto market. For a potential "altseason," we will need to observe a change in this trend, when CRYPTOCAP:OTHERSBTC begins to show sustained growth.
✴️ The Concept of a US "Crypto-Reserve": Not Exclusion, but Absorption
In the face of an impending economic storm and the inevitable "cleansing" of the crypto market, it becomes clear that the US government does not intend to completely destroy digital assets. Instead, a multi-step strategy is being developed for their integration and subordination under its control. This involves not just a set of rules, but the formation of a full-fledged "National Crypto-Reserve."
This concept is not new. The history of finance shows that "private currencies" that do not meet reliability requirements always lead to instability and ultimately are either absorbed or replaced by regulated government equivalents. (As TBAC notes, "history shows that 'private money' that does not meet the requirements of NQA leads to financial instability and, as such, is highly undesirable" – DA&TM, p. 3). When Bitcoin collapses under the pressure of a global economic crisis and massive liquidations in 2025, and "high-beta" altcoins bleed out, the US government and its affiliated institutions will begin to buy them up at a discount. The goal is not to destroy digital assets, but to accumulate them in this "National Crypto-Reserve" .
And here lies another, deeper meaning: this process is not just about buying assets; it's about testing and mastering new technologies on "live hamsters," meaning the current participants of the crypto market. This entire "Wild West" of decentralized finance, DeFi, NFTs, and rapidly changing altcoins serves as a giant laboratory. It is here, under real market conditions and the pressure of huge capital, that the system studies how blockchains, smart contracts, consensus mechanisms work, how quickly "digital" infections spread, and how effectively to manage liquidity in decentralized environments. All these experiments are, in essence, paid for by the crypto- hamsters -enthusiasts themselves, while the state and the global establishment receive invaluable data for building their future digital economy.
This "soup-kit" of digital assets for the US Crypto-Reserve will include, first and foremost, Bitcoin as the primary "digital gold" – an asset that TBAC itself already calls a "store of value." This will allow the government not only to control a significant portion of Bitcoin but also to use it in future "tokenized" financial products. In addition to BTC, the reserve will include carefully selected altcoins under US jurisdiction or of strategic importance for the new, controlled digital landscape. Theoretically, these could be assets that have clear issuers or are centralized enough for easy "absorption" and regulation. This list may include: ETH, XRP, SOL, HBAR, XCH, LINK, UNI, DOGE, OP, AVAX, MATIC, AAVE, LDO, BAT, NEAR, SUI, ALGO, ADA, and others that may be deemed "best of the best" in their understanding.
Thus, the "crypto-reserve" will become the foundation for a new digital financial system , where control and stability will first be ensured by the "nationalization" of key digital assets. This will allow the state not only to manage significant volumes of digital funds but also to use them for future "tokenized" financial products that will be issued on "private, permissioned blockchains managed by central banks" (see DA&TM pp. 7 and 14). This is how "wild" crypto will be tamed and integrated into the traditional system, losing its decentralized essence but gaining "legitimacy" under state supervision.
📈 Analysis of the chart: OTHERS
In this capitalization index, the value of the top-10 coins was removed from the top-125. It is also quite informative and convincing, showing that the capitalization is -50% below its 2021 highs.
I will also add a few altcoin charts here, namely: DOT, NEAR, ETH. For all charts, a further decline of another -70% from current levels is expected, approximately by early 2026.
📈 ETH Chart. Forecast 2025-2028
📈 NEAR Chart. Forecast 2025-2028
📈 DOT Chart. Forecast 2025-2028
📊 General chart description
Ethereum and NEAR behave very similarly, only CRYPTO:NEARUSD is more volatile and does not hold up as well as ETH. INDEX:ETHUSD today is -47% below its ATH, while NEAR is -88%. Nevertheless, they are at least roughly in the middle of the trading range since 2021, whereas CRYPTO:DOTUSD look much weaker than the top coins, and have been languishing at the bottom for about two years.
Moreover, after a thorough analysis of current prices and historical highs of 2021-2022 for coins from the top-100 that existed during that period, very few of them are trading today above or near their 2021-2022 peaks. List of coins from the top-100 that existed in 2021-2022 and whose current price has updated the ATH of that period:
XRP (Ripple): Its current price of $2.2 exceeds its 2021 ATH (~$1.96).
UNUS SED LEO (LEO): Price $8.65 exceeds its 2022 ATH (~$8.14 in Feb. 2022).
TRON (TRX): Price $0.266 exceeds its 2021 ATH (~$0.18).
BNB (Binance Coin): Price $660 is very close to its 2021 ATH (~$690).
SOL (Solana): Because the list is so small, I had to partially count Solana, as it indeed updated its 2021 high at $260, but today trades at -45% lower, around $160.
Thus, if we strictly adhere to the criterion of "trading above 2021-2022 highs," then out of the top-100 that existed during that period, it's only five, again, FIVE alts! The bottom line is that Bitcoin, two native exchange tokens (BNB, LEO), the "Ethereum killer" TRON, the Trojan horse XRP, and let's include SOL, have updated their 2021-2022 ATHs and are trading above or near their historical highs out of ALL TOP-100 coins. Only some alts from the top-100 are somewhere in the middle of the three-year trading range, and the rest have been looking for the bottom for two years.
While influencers have been talking about some altcoin season for the third year, ATOM today is -90% below its 2022 ATH! And NEAR is -88%, DOT is -92%, and CHIA is -99% from its ATH, and this list can go on and on. That's all you need to know about the so-called "alt season" and "bull market" in crypto over the last three years.
❗️ Disclaimer: This idea is only a part of an article with a forecast for Bitcoin and the cryptocurrency market for 2025-2028. To learn more, refer to the root idea via the link:
1️⃣ Main Idea: Analysis of US Treasury Documents

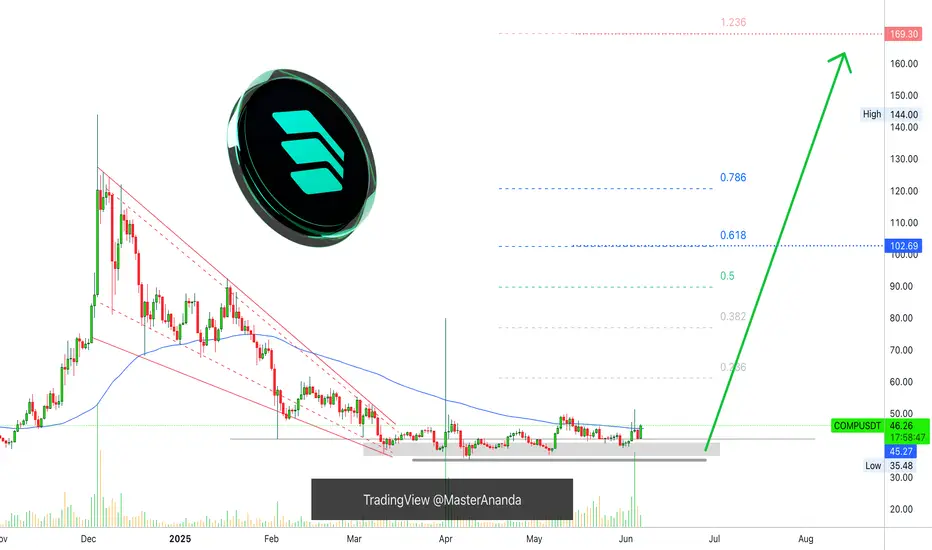
Compound Turns Bullish: Buy & Hold, Trade & WinCOMPUSDT challenged EMA89 June-4 but was rejected. June-5 ended as a red day. Today, the action is green again and back above EMA89. A close above this level and a wave above $100 is confirmed.
Good evening my fellow Cryptocurrency trader—it is still early for Compound—I hope you are having a wonderful day.
April-1 again, COMPUSDT tried to move above EMA55 and EMA89 but was rejected. The difference today is that the action is happening slowly, after several failed attempts, with high volume and two months of higher lows. In short, there won't be a rejection this time. And once the action moves above this level, blue on the chart, bullish confirmed.
This is just a friendly reminder, I posted about this one recently; this is one that you can't miss.
Whatever you do » Buy and hold, trade and win.
Namaste.
Bitcoin Crashes To $81,346.77? Good News & Bad NewsBitcoin is crashing... ? Not really, Bitcoin continues really strong above $100K.
We have good news and bad news.
Bad news. The very ultra-strong, long-term unbreakable support zone is being challenged. This is the $100,000 - $102,000 price range.
God news. It holds. This support zone is being challenged but so far it holds.
So far there is nothing unexpected here we know the market can shake, the market is bound to produce swings. If 100K breaks though this would be a completely different story. If it breaks, Bitcoin continues bullish producing a retrace only to end as a higher low followed by additional growth.
Will support break or hold, is there a way to know?
Bitcoin's retrace after the all-time high so far amounts to -10%. A standard retrace can easily push prices between 0.382 and 0.5 Fib. retracement. Anything lower and this would be a correction rather than a retrace.
Will it break?
It is possible but so far 100K is a very strong support. We have EMA55 here as well as several Fib. levels but if Bitcoin remains below $102,000 then it can definitely break.
The next major support below 100K sits at MA200 or $95,000. This is in-between 0.382-0.5 Fib. retracement. This can be used as the higher low zone and re-entry zone. But, Bitcoin is really strong and demand is big, so we have to wait for the weekly close.
Remember, Bitcoin will continue slightly bearish, consolidating, until the Fed decision. After the event, it is very likely to go full blown bullish. The altcoins will grow as well.
Watch the market shake just to recover the next day.
Are you a weak hand or a strong hand?
Do you have a trading plan?
If you do, nothing changes, simply short-term noise.
If you don't have a plan, right now you might be thinking that the world is close to its end. It isn't, Bitcoin will continue to grow, it takes time for the bulls to recharge before the next wave of growth.
Focus on the long-term.
Thanks a lot for your continued support.
Namaste.

Tesla Still Slightly Bearish Until FED Cuts RatesOne of my followers asked, "how about now?"
The question comes because he is bullish and I am sharing bearish charts.
Here is the thing, the chart is still bearish of course because of the red candles and the double-top. This can't change unless the last high is broken with significant rising volume.
I'll make it easy. This stock is likely to continue bearish until after the Federal Reserve cuts interest rates. When they lower the stuff, they do their magic their numbers then the market will turn bullish. So bearish before, bullish after. And this is a classic dynamic.
The market goes through a retrace or correction preceding a major bullish development. Since the bullish development will definitely push prices up, the market must express its bearish tendencies before the event shows up.
So bearish now. When the Fed announces that they are reducing interest rates later this month, then 100% bullish I agree of course.
Thanks a lot for your continued support.
This same analysis applies to Bitcoin and all related markets.
The altcoins though are a different thing because these are smaller and already trading at bottom prices. They will recover sooner and will start moving ahead of the pack revealing what is coming to the bigger ones.
All is good.
Thank you for reading.
Namaste.

TOP10 Altcoins Ready To Move, Strong Growth Potential —CommentWe already went through part 1, session 1, of the TOP10 altcoins that were yet to move and this time we are going to go deeper. We will go deeper and we will do it better. We are going to be looking at altcoins that are ready to move but it all depends on you.
Are you in?
If you are then leave a comment now!
That's all you need to do.
Bitcoin is ready and bullish and ready to grow.
Bitcoin is hyper-bullish, as bullish as it gets because our strongest support ever wasn't even tested in the recent retrace which was a weak retrace because it only lasted a few days.
The altcoins are super good right now with a higher low and ready to grow, but, with tens of thousands of options, which ones will you go for?
In the first wave trading pairs in the cryptocurrency market grew between 100 and 300%. Check. Perfect prediction, but things are about to get better.
The next wave instead of being capped at 300% can go much higher, the lower end will also be higher and pairs will grow some 200-500%. Some will grow more of course and others will grow less but this is the average.
I will look at the pairs from the TOP65 altcoins by marketcap, and do some bonuses as well. Are you interested?
»»» If you are interested, leave a comment with "Share the TOP10 Altcoins READY Move" and if there is enough interactions I will do this post for you.
So, which one is your favorite altcoin right now, the one that you think is ready to grow?
I'll see you in the comments section...
Thanks a lot for your continued support.
The altcoins market is starting to heat up.
Namaste.

Toncoin Major Advance Now! New All-Time High Incoming (PP: 200%)Toncoin entered its current price range in February, four months ago. After some shaking, this project has been sideways and four months sideways is a very long time when it comes to Crypto, there is good news of course.
When the drop happened in March a bottom pattern was confirmed. A bottom means the bearish trend ends and the market prepares to change.
Just a few days ago, TONUSDT produced really high volume, signaling the start of a new uptrend, higher highs and higher lows.
This post is a friendly reminder just to let you know that Toncoin is about to go up and it will de so really strong.
The signals are in. Consolidation has been strong. The action is happening above support.
An advance now will be strong first, then fast, then slow followed by additional growth. I mean, the bullish action won't stop at $5.51 nor $10 ($9.92), it will continue growing, growth long-term. We are set to experience a new all-time high, the strongest bullish action in the history of Toncoin, it is starting now.
Thank you for reading.
Namaste.

ALTseason May Show Up In 2025We found an interesting chart, which is showing us the ratio of TOTAL3(ALTcoins) market cap against Bitcoin with ticker TOTAL3ESBTC. Well, even this chart is showing that ALTcoins may start outperforming BTC soon. It can be finishing final subwave C of (Y) of a correction in blue wave B that can cause a new strong rally into wave C, which can bring the ALTseason similar as in the beginning 2021.
