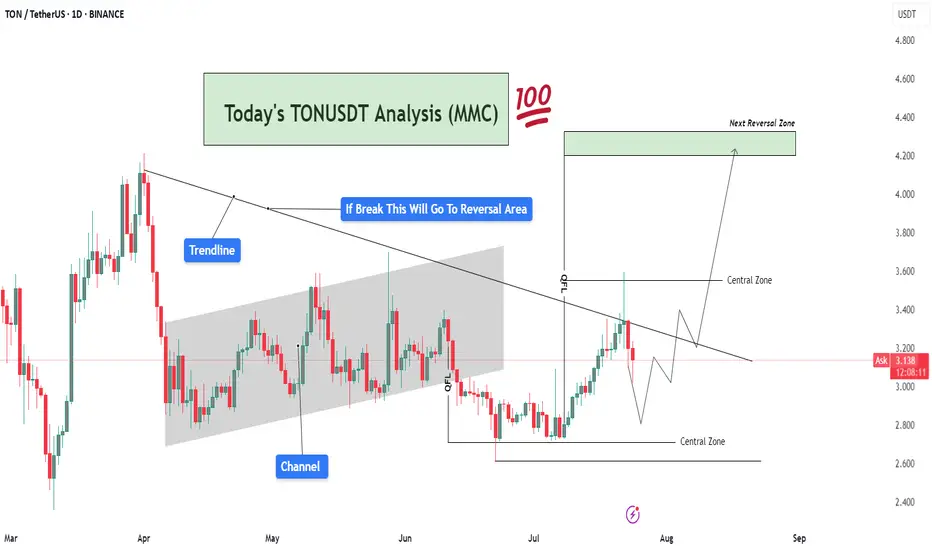
TONUSDT Analysis – Trendline Breakout Target To Reversal Area🧠 Market Sentiment & Context:
TONUSDT (Toncoin vs USDT) is currently trading at $3.13, showing signs of compression within a well-defined MMC structure. After forming a clear QFL (Quick Flip Level) base, the market is approaching a decisive breakout level, with a strong rejection or breakout likely in the coming days.
This chart displays confluence from trendlines, channel breaks, central zones, and QFL demand zones, providing multiple layers of structure-based decision-making. Here's a deeper dive 👇
🔍 Technical Breakdown – What the Chart Is Telling Us:
🔸 1. Major Trendline Resistance – Bearish Control Zone
The descending trendline drawn from prior highs is acting as dynamic resistance.
Price tested this line recently and faced rejection, showing that sellers are still active.
However, the consolidation below the trendline suggests accumulation, not panic selling — a classic sign of smart money positioning before a breakout.
🔸 2. Previous Channel Structure – Broken & Retested
The price previously moved inside a slightly rising parallel channel, reflecting a slow and steady bullish phase.
The channel has now been broken, but TON quickly reclaimed structure via a strong bullish engulfing candle from the QFL base, hinting that this was a liquidity grab (stop hunt) before the real move.
🔸 3. QFL (Quantity Following Line) – Institutional Demand Zone
The QFL base at around $2.85–$3.00 was created after a swift sell-off followed by immediate bullish response.
This is a high-probability MMC reversal structure, where large buyers typically enter.
Since this QFL held firm, it has created a solid foundation for bullish momentum, provided the trendline is eventually broken.
🧭 What's Happening Now – Price Action Update:
Price is caught between two major Central Zones:
Lower Zone: $2.85 – $3.15 (Support)
Upper Zone: $3.50 – $3.70 (Resistance)
The current movement shows price creating higher lows, indicating bullish pressure building beneath the trendline.
Volume remains low, which means the market is waiting for a catalyst (news or breakout) before a directional push.
📌 Key Reversal Zone Ahead – Eyes on $4.20 to $4.40
If price breaks and closes above the descending trendline and crosses the upper central zone, we can anticipate a strong bullish move toward the Next Reversal Zone marked around $4.20–$4.40.
This zone has historical confluence as:
Previous strong supply zone
Psychological round number
Fibonacci extension alignment
This will likely be the profit-booking area for swing traders and early buyers from the QFL zone.
📈 Trade Scenarios Based on MMC:
✅ Bullish Scenario (High Probability If Breakout)
Price breaks the trendline → Pullback → Retest of $3.50–$3.60 zone
Bullish continuation to $4.20–$4.40 Reversal Zone
Ideal entry on retest after breakout
Stop-loss below $3.00
❌ Bearish Scenario (If Rejected Again)
Rejection from trendline leads to re-test of lower Central Zone
Breakdown of QFL level (~$2.85) would invalidate bullish setup
Potential drop toward $2.60 zone for liquidity sweep
🧠 MMC-Based Observations:
🔹 MMC Element 📍 Explanation
🔺 Trendline Key resistance from macro downtrend
🟩 Central Zones Neutral battleground for buyers/sellers
🔻 Channel Break Confirmed bearish momentum earlier, now tested
✅ QFL Strong base, showing early smart money entries
🎯 Reversal Zone High-risk area, expect volatility and profit-taking
📌 Strategic Summary:
Bias: Bullish (as long as price holds above $3.00)
Confirmation Needed: Daily candle close above trendline & $3.50 zone
Target 1: $3.85
Target 2: $4.20–$4.40 (main reversal)
Invalidation: Close below $2.85 (QFL loss)
🚨 Final Thoughts:
TONUSDT is showing clear smart money footprints via the QFL formation and trendline pressure. The setup is ideal for MMC-based breakout traders waiting for confirmation before entering. Volume spike + trendline break will likely spark the next impulsive rally.
Stay patient, and trade the reaction, not the prediction.
Altcoins
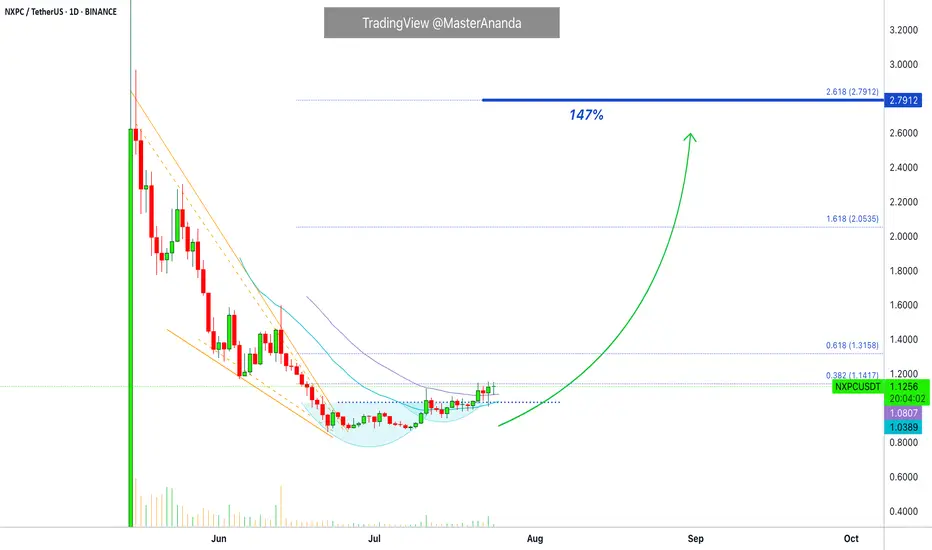
Nexpace Trades At Bottom Prices but Bullish · Easy 147%Here is another trading pair that is trading low and will produce nice growth (profits) in the coming weeks and days. Nexpace (NXPCUSDT).
This one is better than some of the others because it has lower risk. The risk is lower because the action is happening out of the bottom range but prices are still very low. Low prices but with an early bullish bias developing.
NXPC is trading daily above EMA21 and 34 but not EMA55, which means that it is still early. It confirms what I just said above.
Since the entire altcoins market is bullish and rising, Nexpace will also grow. This is an easy short-term trade setup. You can expect to double-up within 15-30 days. Can happen sooner but it can also take a while longer. Be prepared to wait.
Namaste.
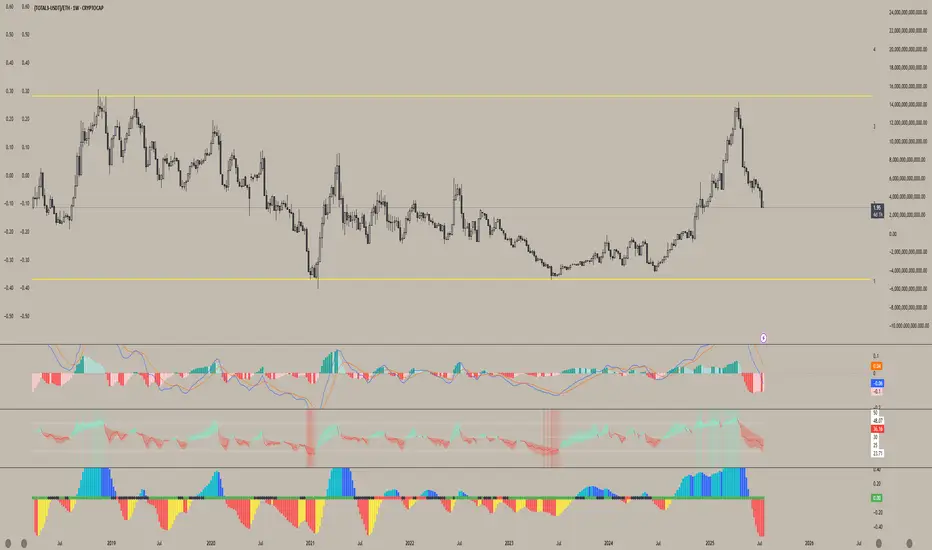
Altcoins are getting absolutely decimated relative to ETHWhile Ethereum has been on a massive run from its lows this year — pulling altcoins up with it — most alts are still lagging far behind.
This chart clearly shows how poorly altcoins are performing against ETH, reinforcing why, at least for now, ETH remains the better hold.
It also fits the classic money flow rotation: BTC → ETH → Large Caps → Small Caps — and right now, we're still in the ETH phase. Until we see strength return in these ETH pairs, chasing altcoins may just lead to more underperformance.
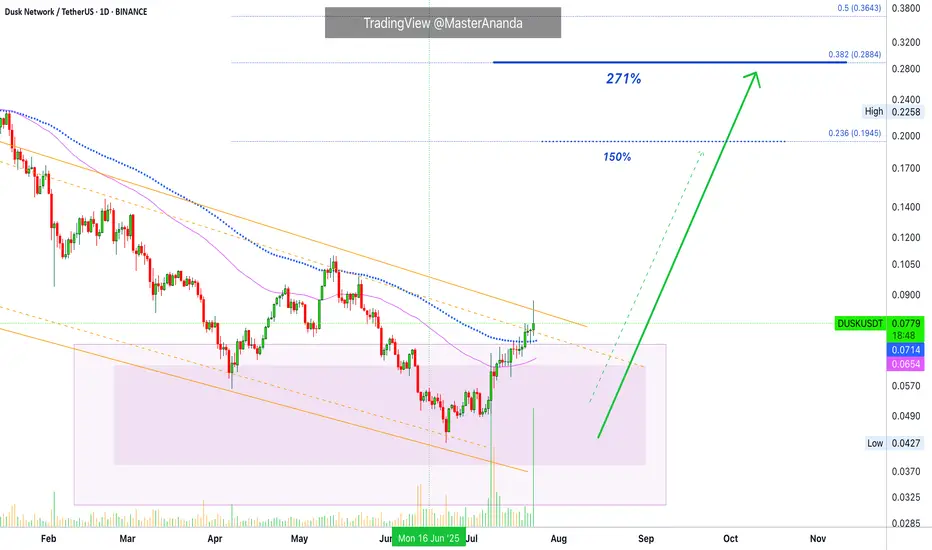
Dusk Network Instant 150% · More Possible · Trading ExplainedThis is a complete setup, I shall explain. Trading long-term vs trading short-term and technical analysis.
We are looking at Dusk Network (DUSKUSDT) on the daily timeframe. You know how I always look for the bottom and trend reversal for all major pairs for long-term trade-numbers; but, when focusing on the short-term you want a fully confirmed setup rather than the perfect bottom. Why?
The perfect bottom can lead to months and months of consolidation before a bullish breakout. A fully confirmed chart setup leads to instant growth.
Here DUSKUSDT has really high volume above EMA89. Full green candles and pushing higher. Already rising, you can see how the bullish bias is only intensifying. This type of setup can produce the much sought after sudden 100% jump. Once this happens, collect profits and move on.
So, long-term, buy and hold. Keep waiting until the cycle top.
Short-term, get in and get out.
Namaste.
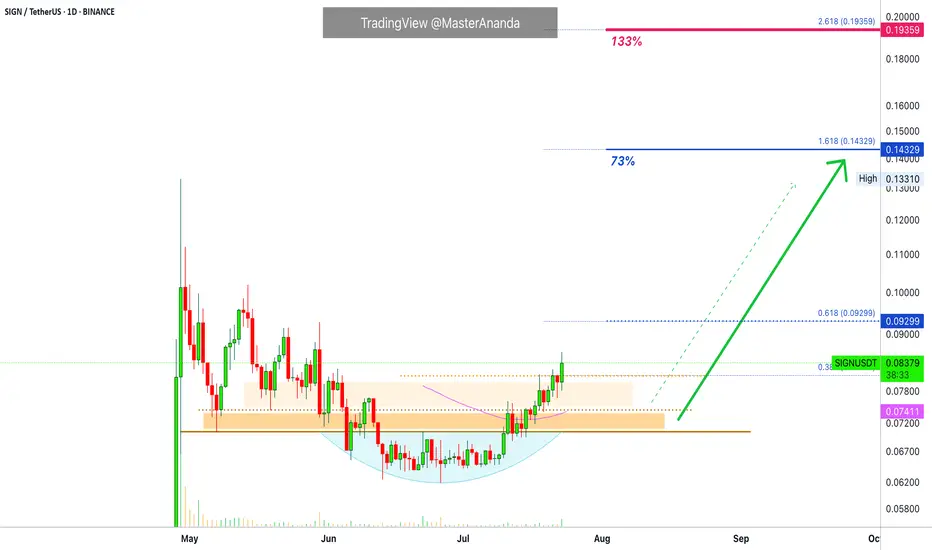
Sign · Same Chart, Same Pattern, Easy Profits · 133% PotentialThe same chart, the same dynamics and the same highly profitable easy to win trading opportunity.
The main low happens 7-May. There are lower prices after this but this is the stop-loss hunt event. We know this based on the rounded bottom pattern.
SIGNUSDT is back above its 7-May low and also trading above EMA55 on a daily basis. Above EMA55 after hitting a major low is as bullish as it gets. On top of that, we can see slow and steady growth; remember, the build-up process that leads to a strong bullish wave.
Notice how each candle, each day, prices are climbing higher and higher. The strongest signal of all is price action. When prices are rising, that is all you need. Supported by a volume breakout and we have another chart setup that will produce profits short-term.
The exchange I am looking at allows up to 5X, but you can do spot; less risk and no stress. If something goes wrong, the worst case scenario is a long wait or a small loss. On the other hand, a mistake with leverage can mean losing your entire position. Which one do you prefer?
There is no right or wrong answer. Higher risk will translate into a higher potential for reward. A lower reward potential translates into less stress and less risk. Whatever you choose is up to you. It all depends on your personality, your capital, your trading style, the available tools and your goals.
I say, start small. If you can secure many small wins, eventually you will be able to handle the big ones. Only go big when you have experience securing the small trades.
If you are in a hurry to win big, then you might end up losing everything; over and over, again and again.
Avoid repeating the same mistakes. Learn from the Master.
Thanks a lot for your continued support.
Namaste.
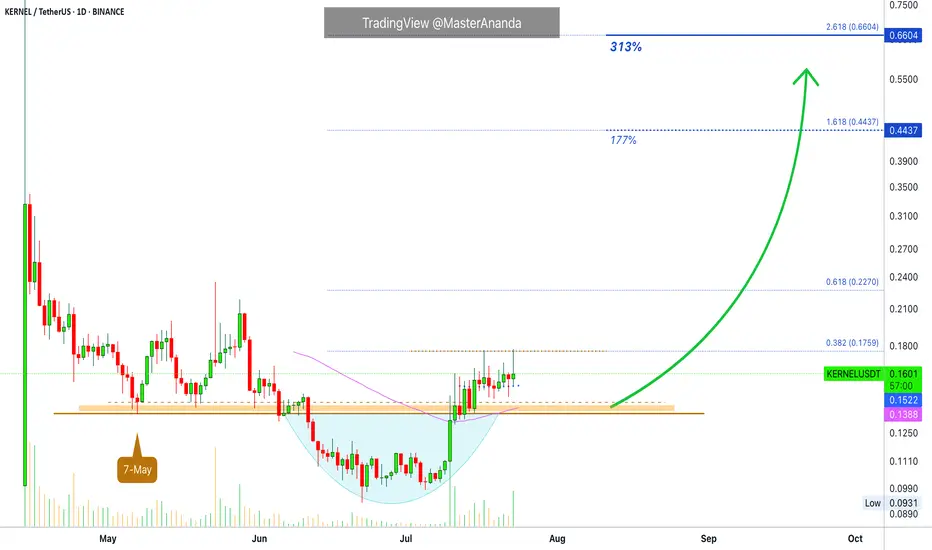
KernelDAO Short-Term Trade Setup · 300% Profits PotentialThis is another strong chart setup. I am looking at the short-term because that is the request I am getting from many of my followers. People are interested now in growing their capital so this can be used to accumulate strong reputable projects later on. Something like double-up, triple-up then grow some more. When enough cash is available; sit back, relax and hold.
The main low here is 7-May. The break below support is the liquidity-hunt event.
After the action recovers above support, bullish confirmed.
Notice KERNELUSDT trading above EMA55 and EMA89 daily.
Trading volume also favors the bullish side. Notice how red days have very low volume. On green days we have the higher numbers of volume spikes. High volume when buying, low volume when selling.
The first target is good and strong for 177%. The second target goes to 300%. This can be achieved easily within 1 month (short-term), or it can extend to two months but not much longer. The trick is to be ready to wait.
If you expect the market to move within hours or days, you might be disappointed. Yes, sometimes it moves fast but this is the exception and not the norm. Better to be prepared to wait a long time and if it moves faster, that's a bonus but we have to be realistic to produce consistent wins. If you want to be in the action, diversification is a good strategy. If you just want to win, patience is key.
Namaste.
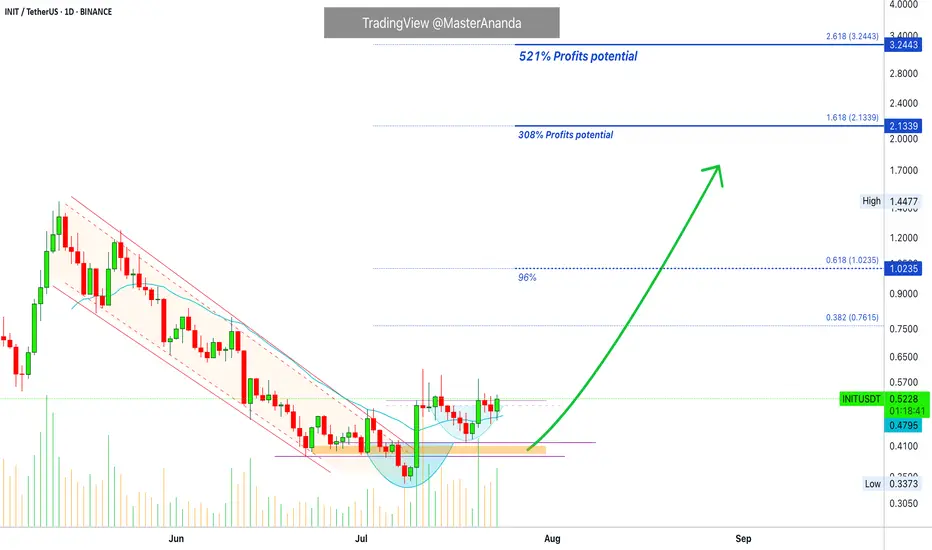
Initia Breaks Downtrend · 300% Profits Potential Chart SetupHere we have a nice chart setup and we are aiming for 144% short-term followed by 300%+ potential profits. Initia—INITUSDT—broke out of a downtrend 10-July with a full green candle and is already trading above EMA21. This is a solid, easy and simple chart setup.
Notice how the new projects continue moving forward while some of the big projects are stalling or retracing. This simply shows that the overall market continues bullish. If the market were to go on a correction, which develops marketwide, everything turns red.
When some pairs remain green in whatever section of the market, it means that money is simply moving from one sector to the next. After just a few hours, the market continues growing. We will see additional growth in the coming days. All is green, all is good, continue to hold strong. This is only the start.
Namaste.
HYPE Swing Long Opportunity - Altcoin Season📌 Fundamental Sentiment:
The crypto market — alongside broader risk assets — continues to gain traction. This momentum is largely fueled by rising expectations of policy shifts in the U.S., with Trump intensifying pressure on Jerome Powell and advocating for aggressive rate cuts from the Fed.
📌 Technical Analysis:
HYPE is approaching a key HTF bullish trendline, and confluences are stacking up in the same region:
✅ HTF Demand Zone
✅ Equilibrium (EQ) of the HTF bullish trend
✅ Bullish Trendline Support
These three HTF confluences overlapping at the same price zone indicate a high-probability setup for a significant bounce and a possible swing long opportunity.
📌 Gameplan:
Price hits HTF bullish trendline
HTF demand zone gets tested
EQ level tapped → discount offered to buyers
📌 LTF Confirmation Criteria:
I’ll wait for:
A 1H swing break
A strong 4H rejection candle
These will confirm momentum shift. If confirmed, I’ll enter a swing long.
🎯 Target: $60
💰 Potential gain: ~+50%
❗ Stop-loss: Below the swing low that triggers the LTF confirmation
—
🔔 Follow for daily setups and weekly macro recaps
💬 Drop your chart or questions below!

XRP/USD – Bearish Shift After Momentum Exhaustion🧠 Summary:
XRP/USD has shown clear signs of exhaustion after sweeping the previous high. Following a breakout from a daily bull flag, price struggled to hold momentum near the key level of 3.4194, forming an ascending channel that eventually broke down. Liquidity zones below current price are now in focus.
🔍 Technical Breakdown:
✅ Daily Bull Flag → Broke out with strength
⚠️ Rejection near Previous High (3.4194) → No follow-through
🔼 Ascending Channel → Formed post-impulse, now broken
📉 Momentum Shift → Structure flipped bearish
💧 Liquidity Zones (LQZ) below price acting as magnets
📌 Key Levels:
🔹 Last High: 3.4194 (Rejection Point)
🔹 Broken LQZ: 3.2868
🔹 Current Support: 3.1689 (LQZ - being tested)
🔹 Target 1: 2.9849 (4HR Liquidity Zone)
🔹 Target 2: 2.7667 (Daily Liquidity Zone)
🧩 Confluences:
Liquidity sweep of prior high
Momentum loss near key resistance
Break of ascending structure
Retesting broken zones with room below
⚠️ Final Thoughts:
This trade is playing out just as we described in the post before this on XRP. We discussed watching how price would react to this area before making any type of "Late Entries". XRP is still a huge and vital part of the Crypto Eco System so long term i am holding my Long position. The areas on the chart are still great areas to buy in at "Dollar Cost Average". This will be one of those positions that though it may be bearish on the lower time frame you need to zoom out and always keep an eye on the weekly and daily chart before making any drastic moves.

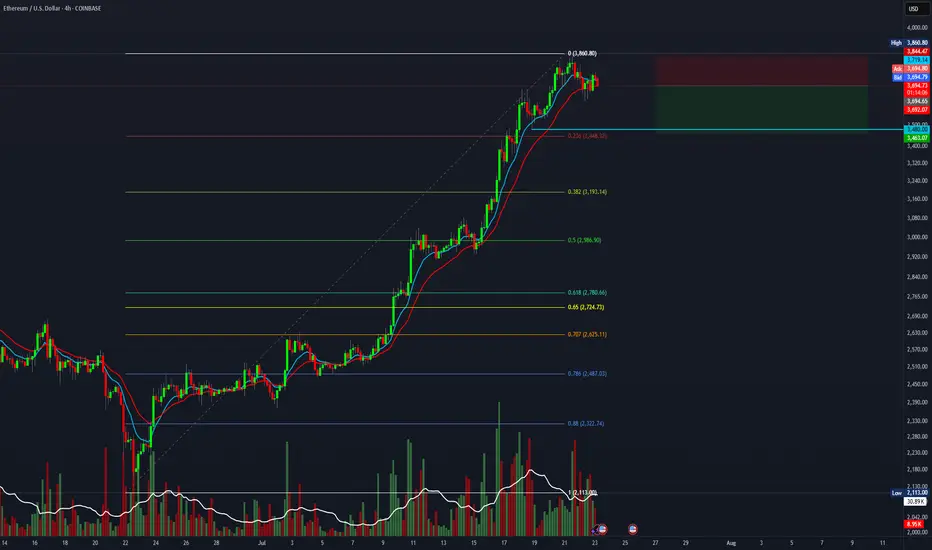
Short swing setup on ETH, targeting 1.5R.It's time for a healthy pullback on ETH. This short setup offers a 1.5:1 risk-to-reward ratio with a target of $3,500.
Entry at $3,725
Stop loss at $3,850
Target at $3,500.
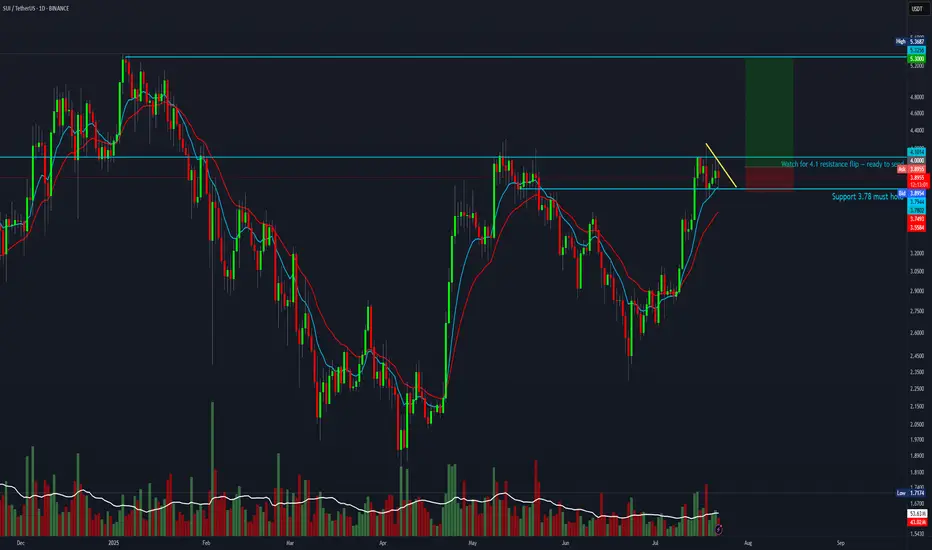
SUI 5R setup forming.SUI looks ready to move. Wait for a breakout above $4 — once it flips the $4.10 resistance, it could fully send toward ATH.
Entry: $4
Stop Loss: $3.70
Target: $5.30
Altcoin Correction Scenario: Where to Look for EntriesHi traders and investors!
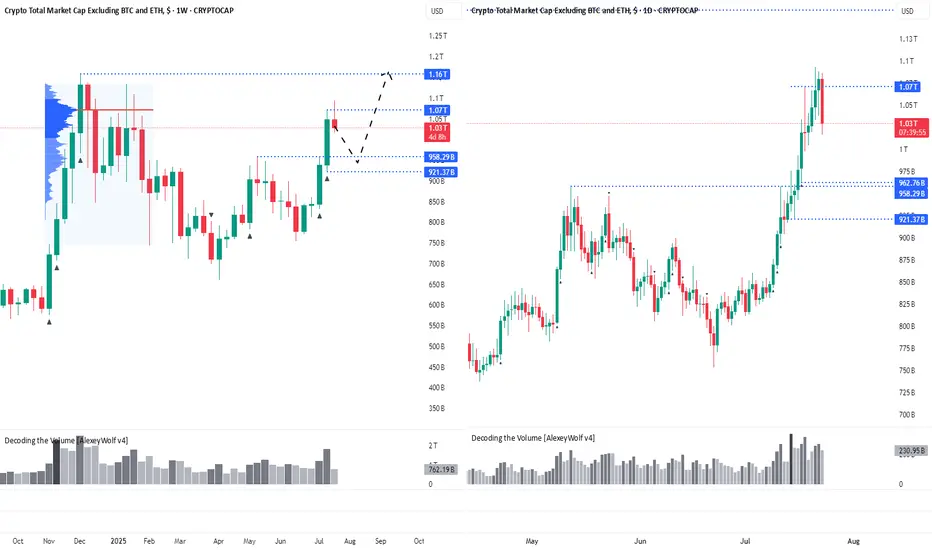
The market capitalization of Total3 has reached $1.07 trillion, marking the first major target for the altcoin market.
This level corresponds to the Point of Control (POC) from the previous bullish rally and the subsequent correction — a key area of traded volume and market interest.
Several factors now suggest the potential for a continued move higher. On the fundamental side, the recent signing of a pro-crypto bill by Donald Trump has boosted overall sentiment in the digital asset space, especially among altcoins. From a technical perspective, many leading altcoins are showing bullish continuation patterns.
Ideally, if the altcoin market corrects its capitalization (Total3) into the 963B–921B range, it would be a good zone to look for buying opportunities with the target of renewing the capitalization ATH.
Wishing you profitable trades!
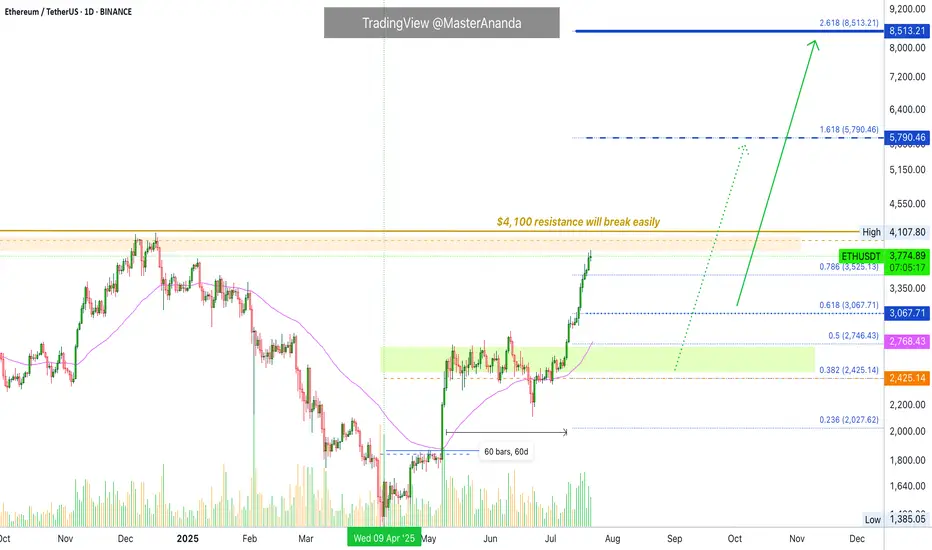
Ethereum Update · Minor Break Below $4,000, Nothing ChangesOk. Straight up has been confirmed but as you already know, the market never moves straight down neither straight up. It seems Ethereum is about to take a small break. This shouldn't alarm you nor be a concern, we are set for sustained long-term growth. When bullish momentum dies down, the market tends to take a break, a pause, before additional growth.
Please remember that these breaks are very tricky, they can last just a few days, say 3-6 days, just as they can go for weeks. It is very hard to predict. In fact, we don't try to predict the duration of those, we simply focus on the bigger picture and know that a new all-time high will be hit in the coming months. This new all-time high will be followed by additional growth.
The short-term can be tricky though. Ethereum will continue rising, but watch out, it can make a pause and this time can be used wisely to profit beautifully from smaller altcoins. Don't let your capital just sit around when it can grow.
Ethereum is awesome but it is also a giant. The smaller altcoins is where the true opportunities lie. The opportunity to quadruple in a matter of months. And this process can be repeated several times for the duration of the bullish cycle.
Namaste.
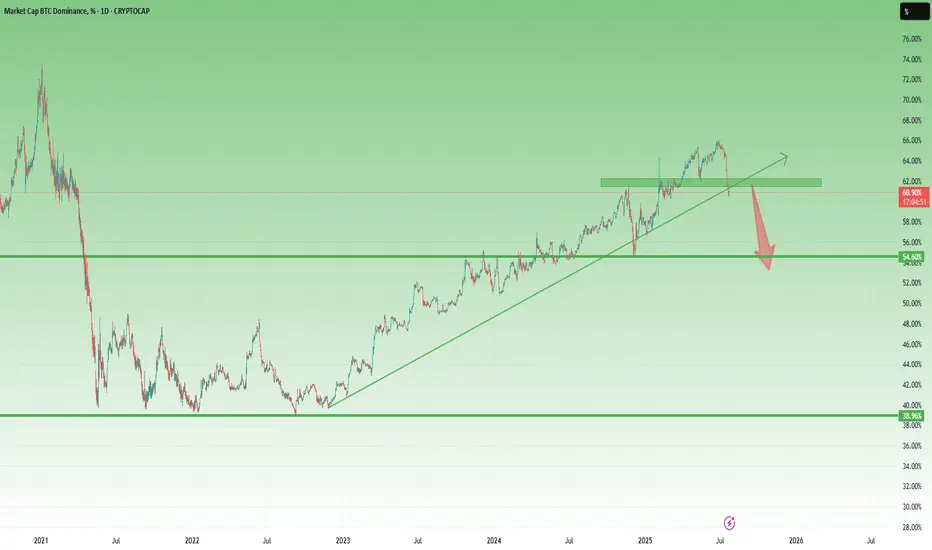
Bitcoin Dominance - No Altseason yetAs long as Bitcoin Dominance is moving in the channel, there will be no AltSeason unless it shows weakness and breaks the channel downwards.

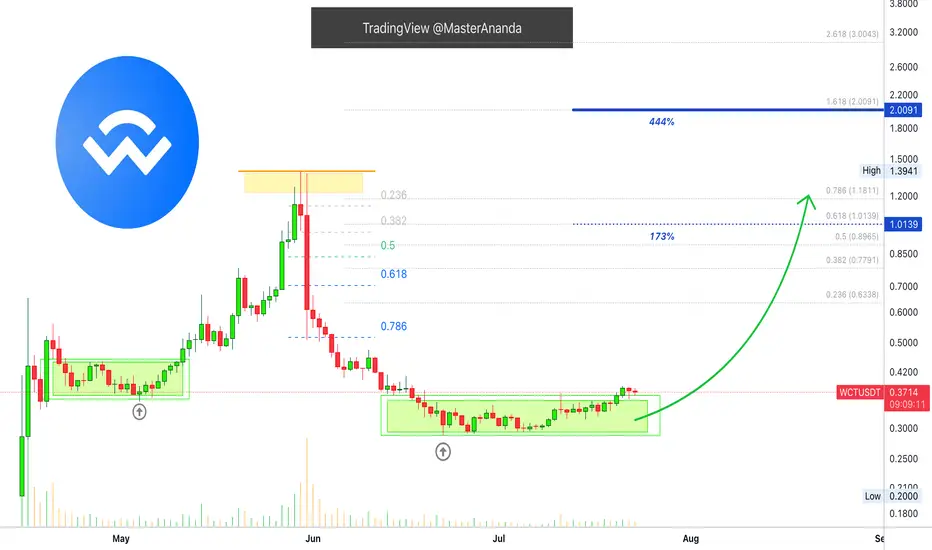
WalletConnect Reaches Support · Simple Signals · Simple StrategyI had to update this chart. It took longer than usual to move and this is always the case. Whenever we plan for 3 days we end up having to wait 10 days. If we plan to wait patiently for two weeks then the wait lasts six weeks and so on. Just be prepared to hold long-term and this can yield better results. No time, just get in when prices are low and hold. This works better.
WalletConnect finally bottomed 22-June and has been recovering slowly. This slow and steady recovery is always a signal of strength and tends to lead to a strong bullish breakout. When you see slowly rising prices for weeks or sometimes even months you know what the outcome will be, a major bullish breakout.
So we buy the support and wait, when the breakout comes, enjoy the profits.
Thank you for reading.
Namaste.
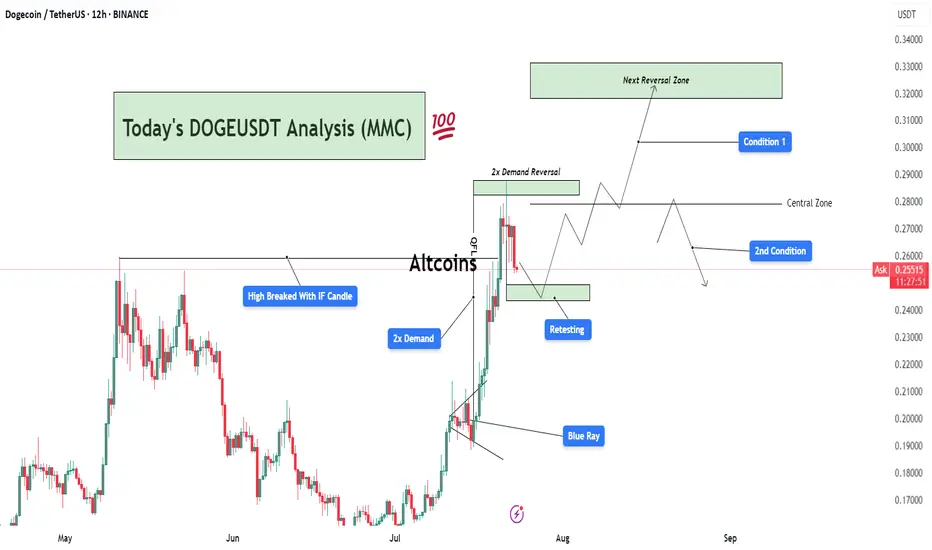
DOGEUSDT Analysis : Demand Zone Retest Before New Highs Target📊 Overview:
Today's DOGEUSDT analysis (12H chart) under the Mirror Market Concept (MMC) framework reveals a potential bullish continuation or corrective phase based on two major conditions. The market structure is transitioning after a strong impulsive move, triggered by a 2x Demand Zone breakout, and is now in the retesting phase.
🔍 Key Technical Breakdown:
High Broken with IF Candle:
A significant previous swing high was broken decisively by an Initiation Flow (IF) candle, indicating institutional activity or aggressive buying pressure.
This confirms a shift in market structure toward a bullish trend.
2x Demand Zone:
This zone has served as a strong base for price accumulation and an impulsive breakout.
The market responded well with a sharp rally post this demand, validating it as a critical support.
Blue Ray Zone (Support Zone):
The bullish breakout was partially driven by this inner trendline zone (referred to as Blue Ray), where price respected the rising support channel before breakout.
This shows smart money liquidity engineering prior to the breakout.
Retesting Zone:
Currently, the price is retracing toward a previously broken demand zone.
If this zone holds, it could provide an optimal entry for continuation.
📈 Two Scenarios (Conditions):
✅ Condition 1: Bullish Breakout to Next Reversal Zone
If the retest holds and price prints bullish confirmation (e.g., engulfing or pin bar), we can expect price to move up toward the next key reversal zone between $0.3100–$0.3300.
This zone is marked as a potential supply/reversal zone, where large sell-offs may occur.
This path follows the continuation structure under MMC, aligning with trend-following buyers.
⚠️ Condition 2: Failure to Hold Demand → Deeper Pullback
If the current demand zone fails to hold and price re-enters below the central zone (~$0.2700), we could expect a deeper correction.
Price may then revisit lower demand regions, potentially toward $0.2200 or lower, depending on rejection strength.
📌 Important Notes:
The central zone acts as a pivot level, defining whether bulls or bears gain short-term control.
Monitor the reaction from retesting area closely — candle confirmation is key before any trade execution.
This chart follows Mirror Market Concepts (MMC), combining smart money behavior, demand/supply reversal logic, and psychological market zones.
💬 Final Thoughts:
DOGEUSDT is currently in a critical phase. The market has shown strength, but now it's about confirmation. Patience is key — wait for a clean break or rejection around the retesting zone to determine the next direction. The analysis favors bullish continuation, but being flexible with both scenarios gives traders an edge.
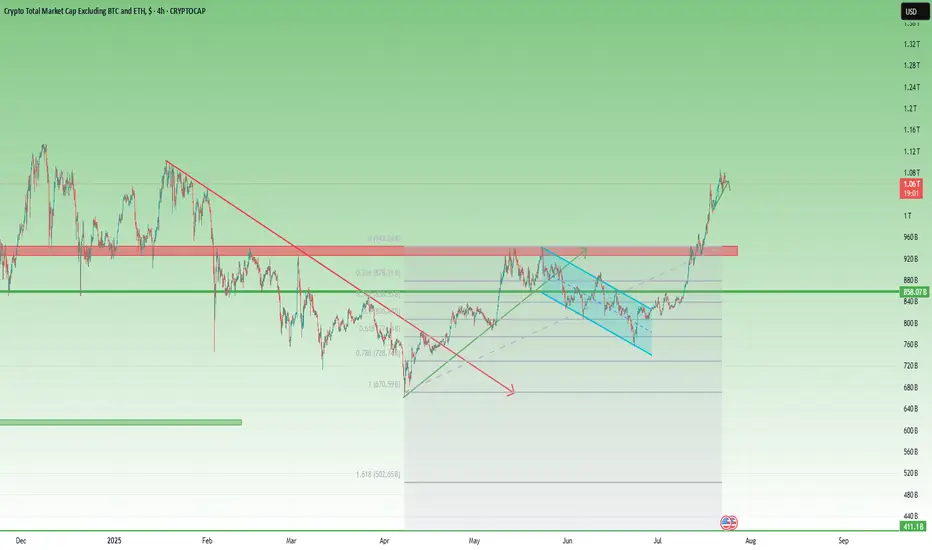
Total3 – Back Above 1T, but Will It Offer a Second Chance?📈 What happened since April?
After the sharp low in early April, Total3 began to recover steadily.
Toward the end of the month, it broke above the falling trendline that had been holding since January — a key technical shift.
This triggered a strong recovery rally, pushing total altcoin capitalization (excluding BTC & ETH) to the 930–940B resistance zone.
📉 Then came the pullback…
Price printed a double top near resistance, followed by a drop — but not a bearish one.
Instead, the correction was orderly, forming a bullish flag, with the low landing right on the 61.8% Fibonacci retracement. Classic healthy structure.
🚀 The latest breakout
Earlier this month, Total3 launched a very impulsive leg up, reclaiming the 1 trillion level with strength.
At the time of writing, we’re trading back above 1T, and momentum remains on the bulls’ side.
However, the chart does look a bit overextended in the short term, suggesting a correction could follow soon.
🧭 Trading Plan – Will We Get a Retest?
The textbook play would be to wait for a deep pullback toward previous support levels.
BUT – I don’t believe we’ll get a full retest of the breakout. Altcoins may stay elevated or correct only modestly.
Instead, I’ll be watching the 1T zone and slightly below — that’s where I’ll look to load up on interesting altcoins.
📌 Conclusion:
Total3 has broken structure, reclaimed key levels, and is showing classic bullish continuation behavior.
The market may not offer you the perfect entry — but small dips near 1T could be all we get before another move higher. 🚀
Be prepared. Don’t wait for perfection in a market because rarely gives it.
Altcoin Season May Be Real This TimeBitcoin Dominance Finally Breaks – Altcoin Season May Be Real This Time
Since late 2022, Bitcoin Dominance has been on a steady rise — and during this time, the vast majority of altcoins have bled heavily, losing value both in USD and BTC terms.
The long-awaited “altcoin season” became a meme more than a market event.
Every rally was short-lived, and rotation never truly materialized.
Until now...
________________________________________
📉 A Technical Break That Matters
Looking at the BTC.D chart, we finally see something meaningful:
➡️ A clear technical breakdown under confluence support given by the horizontal one and the rising trend line, which held for months and provided the structure for BTC outperformance.
At the same time, Bitcoin is stable around the 120k zone, and the price action suggests strength — not mania, not collapse — just solid consolidation at high levels, and most probably preparing for new ATHs.
This environment historically tends to be favorable for alts.
________________________________________
USDT Dominance (USDT.D) Also Pointing Lower
The USDT.D chart adds even more confluence to the idea:
• It's now pointing towards support
• The structure suggests there’s room for a further drop, which historically means more money flowing into risk assets — particularly altcoins
When stablecoins dominance drops, it usually reflects increased market participation and risk-on behavior — exactly what altcoins need to finally shine.
________________________________________
🔍 What Am I Doing?
I’ve already started buying selected altcoins and I'm looking to add more on dips.
This technical shift is meaningful. It’s not about catching hype, it’s about recognizing a real potential rotation.
In conclusion, I’ll be looking for strong altcoin setups to buy on pullbacks,
as I believe the next weeks and months could offer the kind of upside that can at least double my investment (yeah, yeah, I'm not "to the mooner, hoping for 100x ).
Ethereum Name Service Easy $131 Target · $208 Possible or HigherEthereum Name Service really took off in late 2023. March 2024 did nothing to this project. Here we can see an extended period of higher highs until December 2024. Many projects produced a major high in March 2024 to turn bearish until recently. In December, all of these produced a lower high. You can see how different this chart looks. This is a strong project the chart is saying.
There was a strong correction between December and April, this was a marketwide event. You can see how ENSUSDT moved below 0.786 Fib. retracement for several months just to recover. In June it remained below this level only briefly, for two weeks, and we are now full green.
Last week's candle closed above 0.618 Fib. retracement and we are back in the bullish zone. Full blown bullish as Ethereum Name Service is trading at the highest price since January 2025. Everything shows the market being ready for additional growth.
The recovery above support never supports a crash but instead a bullish continuation. For a crash, we would see a rejection or very weak action around resistance. Instead, we have full green candles with rising volume. Perfect conditions for higher prices. Just what we need and want to see.
The targets here are good, $131 and $208. I don't think this will be the end though and we have another wait and see. I think between $285 and $361 is a better prediction, these targets are also shown on the chart.
How far up do you think ENS will go?
Namaste.

Stacks · Major Flush Reveals End of Correction · New CycleStacks all-time high was hit April 2024. This ATH comes as a long-term double-top because it happened within the same November 2021 peak price range.
After a major wave there is always a correction. A correction can happen in any direction. If the trend is bearish, the correction is an up-move. If the trend is bullish, the correction is a down-move. Very simple.
The 2021 all-time high is the natural end of a major bullish cycle and thus a correction follows. The correction lasted from November 2021 until November 2022. Naturally, a major market bottom signals the start of a change of trend.
Here STXUSDT produced a bullish cycle from November 2022 until April 2024, 504 days. In April 2024 we have a new major high and this signals the start of a bearish wave. The bearish wave went from April 2024 through April 2025. The end of the down-move would signal the start of a new bullish cycle but, how do we know the down-move is over? Answer: A major market flush.
On the 12-May week there was a major market flush with a session reaching lower than the 7-April low. This is the bottom signal. It reveals itself as a bottom signal because instead of a new lower low close the week recovered and closed very high. After a higher low in June compared to April we now have four green weeks and we know what the rest of the market is doing so we can predict easily a bullish continuation; a price increase.
The size of the drop between April 2024 and May 2025 reached -92.49%. That's a huge drop. Almost all the gains from the previous 504 days bullish cycle was erased. The market has no reason nor need to move lower, for what? There is no need to dig for anything down there and that's the signal that reveals the bottom is in. Because the correction was so strong, we can expect a change of trend. We are aiming up.
Stacks major market flus in May 2025 reveals the correction is over. With the end of a strong bearish cycle confirmed, we can now expect a strong bullish cycle to develop next. If we go by past history, we can see sustained growth, it can happen for years or in the least many months.
How long will the bullish cycle last?
I don't know.
From March 2020 to November 2021 we have 630 days. The other cycle I just mentioned lasted 504 days. We can use these numbers to make some predictions but it is hard to say because market conditions are not the same.
504 days from May's low into the future gives us a date of September 2026. 630 days puts us at February 2027.
If we go by the law of alternation, we had a long cycle in 2020/2021 so this time we get a short one, say 38% or half the past bull market, this would give us 239 and 315 days. These two will give us dates between January and March 2026 for a new all-time high or cycle top.
Now, I cannot predict how long the bull market will last but I can predict that prices are going up. Since we know we will have a major rise lasting at least 6 months, the next logical step is to buy and hold. When Stacks starts trading 1,000% up, you won't care how the long bull market will last, you will just be very happy and grateful with the results.
The easy target is $6.19, but if we get an extended bull market we can go to $9.83 or even $13, or higher. It all depends on how it all develops, but we are going up. We are talking profits between 600% and 1,400% coming from current prices.
Thanks a lot for your continued support.
Namaste.

Artificial Superintelligence Alliance (FET) Enters Bullish PhaseThere is always really high volume on this chart. FETUSDT trading is very active and this is always a good signal regardless of the overall picture. It means there is interest in this trading pair. Some pairs you can see have absolutely no volume and you know only bots are trading it. When volume is high, you know there are some people buying and selling behind the scenes and when the market goes on a trend, it tends to produce wild moves. So high volume is always good.
The trend is the uptrend next. We already saw a major downtrend starting March 2024. After a low in August 2024, the classic dead-cat-bounce led to a lower high in December and then the final bottom, just two months ago. This is the correction end and bottom and from this bottom we grow. Market conditions are changing.
The bearish phase is over and it lasted more than a year. One year and one month. We are now entering a new phase and it will be a bullish cycle. How long will it last? Can the bullish cycle last just 3 months while the bearish cycle lasted 13 months? These are good eye opening questions. It shows that we might be setting ourselves up for an entire year of growth.
Actually, can be 4 months, 6 months, 8 months, 12 months or more... It doesn't matter, we are going up. Artificial Superintelligence Alliance —FET.
Namaste.

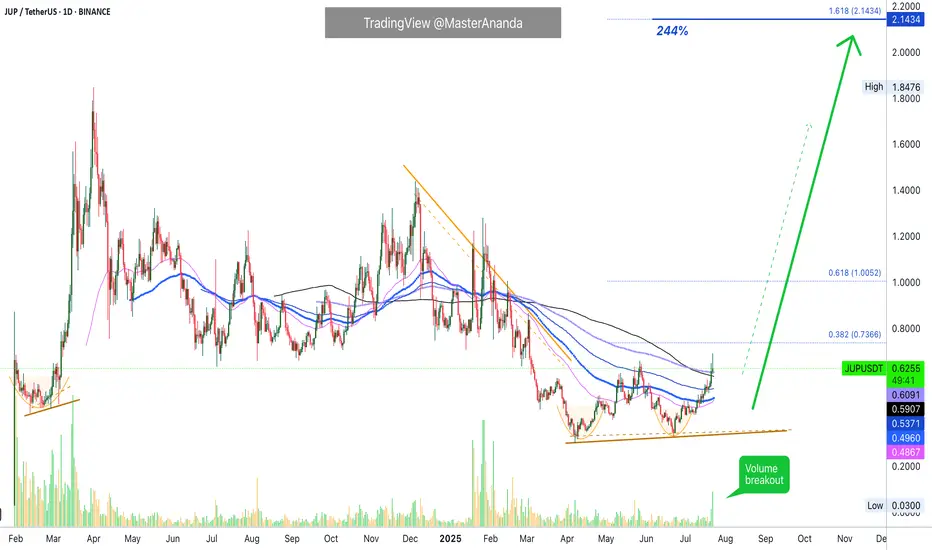
Jupiter & The Exponential Moving Averages · Volume BreakoutFirst I looked at a pair and it was struggling to move past certain long-term EMAs. Then I opened up Jupiter, JUPUSDT, and I can see it moving forward... This is a bullish development.
Just today a multiplicity of bullish signals came together. JUPUSDT broke above its May 2025 high. Hitting the highest price since March, almost 5 months ago.
After a higher low 22-June, JUPUSDT rallied and continued to gain strength. After 9-July, it started to break, one by one, all the moving averages on this chart. These levels were working as resistance.
First EMA55 was conquered after eleven days struggling below. Then EMA89 was conquered one day after, the blue dotted line on the char. Four days later the action moved above EMA144 followed by MA200 and EMA233 yesterday; today, JUPUSDT is trading above all those major levels, with the highest price in five months.
This is as good as it gets and it reveals the intensification of a newly developing bullish wave. This wave will transform into an uptrend and this uptrend will lead to a major bull-run. The bull-run will go hiiiiigh reaching a new all-time high, the end of the bullish cycle; the entire process can take anywhere between 4-6 months or 8-12 months or more. It really depends on the overall market condition, Bitcoin and how active is the project developers team. This can all work together to produce something great.
Volume is starting to rise now. This means that it is still very early in this game.
We are just entering the bullish zone. After a major high is confirm, we can see very strong exponential growth.
While at first it takes months for prices to grow 2-3 levels up, when the wave is advanced we can see several levels increase in a matter of weeks and then it keeps on intensifying until the market goes crazy and that's when you see euphoria and greed. It is still early, but it doesn't hurt to be prepared.
Keep a calm and sane mind, you will need it to maximize profits and close as many as possible successful trades.
Namaste.
Uniswap Exits Opportunity Buy Zone · $73 & $118 2025 ATH TargetUniswap is finally out of its long-term opportunity buy zone, a trading range that was activated first in 2022 and remained valid for a long time.
After October 2023, UNIUSDT produced two bullish moves but each time fell back into this zone. Orange/brown on the chart. Notice how this zone matches price action happening below EMA89, EMA55, MA200, EMA144 and EMA233. As Uniswap turned bullish and fully confirmed, it broke above all this major levels.
Last week, it managed to close above the really long EMA233 and this week the action is staying above. Currently $10.30.
Notice waves "1" and "2" these are relatively small waves. Something will happen with #3. The market evolves exponentially. Instead of another similar wave going a bit higher, it will be something like 2021. Not like 2021 in the sense that it will reach similar price levels, but in the sense that it will be completely out of proportion with what you saw in the last several years. Prices will go off-the chart.
We can think of resistance as a new all-time high being found around $73 and $118, but this time I only want to call your attention to this moment now. The fact that market conditions are changing and it is still early when we focus on the long-term.
I just realized that I might be seeing things differently and it is hard to visualize, for someone without the actual experience, what is about to happen. But despair not because that is the one reason why I am here and why you are reading this. I am here to alert you, remind you and prepare you for an event before it happens. In this way, you can profit and achieve your financial goals. I want to give you value in exchange for your trust. Will you trust? Uniswap is going up. Crypto is going up and it will be the best since 2021. Possibly the best bull market in the history of Crypto, the new regulatory framework and global adoption is saying so.
Thanks a lot for your continued support.
Namaste.
