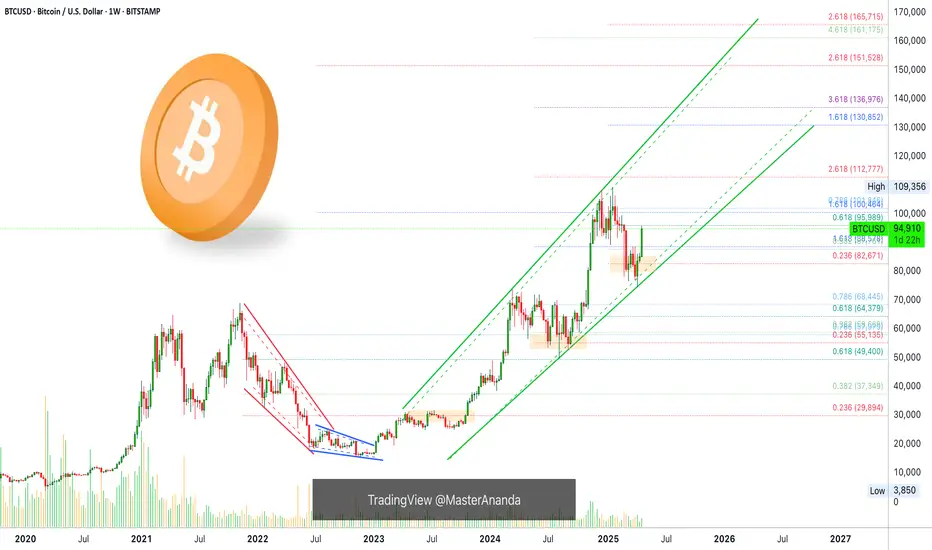
Bitcoin "Crash" 2025Bitcoin started a more significant correction recently, which is scaring many people, and there is already a lot of talk about the beginning of the Bear market.
In my view, the upward trend is still intact, and this could very well be a healthy correction to prepare for a more significant rise in the coming months.
We have an important support level at $75K which has confluence with the 3D SMMA which has already proven to be strong in the past, I think there will be some reaction and that could very well be the end of this correction, but as long as the price manages to stay above $70K I will remain bullish and looking for Longs.
It is important to note that the Fear and Greed indicator is at 21, with Bitcoin at $84K.
Altcoins

ETH Bottomed last week!This chart illustrates the ratio of the market capitalization of the top three stablecoins and that of Ethereum (ETH).
The correlation is quite evident, as anticipated.
We are likely approaching a phase where these stablecoins will be deployed, with Ethereum being a key beneficiary, signalling that we are entering a period of increased risk appetite and overall market buoyancy.
#ALTS
#USDT
#USDC
#DAI
#ETH

A wonderful ALTCOIN Bullrunis all set in motion.
If my chart resonates with you in any way.
The combined dominance charts of the big four.
#BTC.d
#ETH.d
#USDC.d
#USDT.d
We are on our way to my anticipated target zone.

MANTA/USDT – Bullish Structure Forming MANTA/USDT – Bullish Structure Forming
MANTA is showing early signs of a trend reversal, with multiple confluences indicating strength from the bulls. After a prolonged downtrend, the asset has not only broken key resistance levels but also flipped the 50 EMA, a major dynamic resistance, into support.
✅ Key Technical Highlights:
Double Bottom Formation:
The chart has clearly printed a double bottom, one of the most reliable reversal patterns.
This formation suggests that bears are losing control and buyers are starting to step in with conviction.
Breakout Above the 50 EMA:
Price has decisively broken above the 50 EMA (~0.2127), which had previously acted as dynamic resistance during the downtrend.
Notably, the price retested the 50 EMA and successfully bounced, confirming it now as support.
Resistance Flip to Support:
The previous horizontal resistance zone has been breached and retested, reinforcing its role as a demand zone.
Market Structure Shift:
Lower highs and lower lows have now transitioned into higher lows and higher highs, signaling a structural shift from bearish to bullish.
Momentum and Candle Structure:
The bullish candles post-retest show strong momentum with minimal upper wicks — a sign of buyer strength.

Bitcoin & The Cryptocurrency MarketWhat is the energy like? Are the energies rising or falling?
That's the question that you should ask yourself now in relation to Bitcoin and the Cryptocurrency market.
Falling energies lead to falling prices. What was happening just two months ago? The energy was low and the market dropped but, can you feel it? It has been heating up. Something is brewing behind the scenes and excitement is building up... It is coming, like a storm, a quiet storm.
The energies are rising and conditions are so much difference to just two months ago. Three months ago. Conditions are different now, the action on the chart will also be different now because the correction is over and once the correction is over we will always experience growth, no doubt for sure.
Mars will be in full force in May 2025 and Mars is the action planet. When Mars was retrograde the action died down, the action energy felt down and the market moved down. Mars goes full 1000% forward motion new territory high energies; fiery, impulse and barriers and blocks removed as Cryptocurrency grow.
That's the energy. It cannot be avoided it cannot be stoped, when it was going backward all the bullish action disappeared from the market, December 2024. As it goes back in full force the action is heating up and the proof will be seen clearly in the results. Bitcoin is already ultra bullish above $95,000. 80K is no more. No longer possible soon to be a dream long gone.
"Imagine buying Bitcoin when it was trading at 78,800, 80,000 or 90,000," that's exactly what people will be thinking in just a few short weeks when Bitcoin trades at $120,000 and then $150,000 with bullish momentum only growing and prices going higher.
What about the Altcoins?
You cannot have a bear market followed by a bear market supported by a bear market within a bear market. That's not how the market works. The market alternates between bearish and bullish periods between periods of corrections and growth.
Such a long correction we went through that we forget that Cryptocurrency is worth more than Gold. But we will remember soon because there is something cooking behind the scenes and the dish is almost ready to be served.
Your dish will be a desert, what you really deserve; huge profits.
The market will reward you for being a buyer when everybody was selling.
The market...
Thank you for reading.
Namaste.
Ontology, Simple 250% Bullish Wave MappedOntology is super bullish now recovering above three major support levels after a new All-Time Low. 7-April, the Cryptocurrency correction and market bottom.
The lows in question are 3-February 2025, August and July 2024. All these were major levels with ONTUSDT trading above them all, before crashing below of course. This is the most bullish a chart can become. Literally the most bullish possible.
A new ATL is hit followed by a strong recovery, with a v shaped bottom. Growth confirmed. ONTUSDT has been moving but very slowly, remember? "Slow and steady growth at first and then bullish momentum grows."
That's one, there was another one; "Bottom prices are available now but soon they will be no more, once they are gone they are gone forever. Today, prices can be low yet the next day, a strong rise and the bottom prices are forever gone."
These are the past few weeks of analyzes in summary.
Another, "Buy now and buy everything as if it is the end of the world."
While the bottom is gone, it is still early to enjoy a huge bullish rise/wave/phase and maximum growth.
» The 250% target is an easy target and there will be much more in this bull market. Prices will go off the chart.
Thank you for reading.
Namaste.

ONDO 4H – Fake Breakdown Reversed, Bullish Momentum BuildsBYBIT:ONDOUSDT is exhibiting a strong bullish reversal pattern on the 4H chart, aligning with the broader ascending channel observed on the daily timeframe. After a brief deviation below the channel, which acted as a bear trap, the price swiftly re-entered the channel and broke above the descending resistance trendline. This move indicates a resurgence of buyer strength and a potential shift in market sentiment.
Following the breakout, COINBASE:ONDOUSD has been consolidating above the broken trendline and the ascending channel's support, suggesting that the previous dip was a false breakdown. This consolidation phase often precedes significant upward movements. If the bullish momentum continues, we can anticipate ONDOUSDT targeting the mid-channel resistance around 1.40, with the possibility of challenging the 2.00 zone or even reaching new all-time highs.
On the fundamental front, Ondo Finance has recently made headlines by engaging in discussions with the U.S. Securities and Exchange Commission (SEC) regarding the tokenization of U.S. securities. This strategic move aims to bridge traditional finance with blockchain technology, enhancing the project's credibility and long-term growth prospects.
🔔 Follow for real-time updates!

Ghost Town Vibes Explained —Bitcoin & The Altcoins Will GrowIt is a very well-known fact that people only join the market and decide to participate when prices are high and rising. Retail is not interested in bottom prices because there is no excitement.
No people around can be taken as a clear signal that the market is trading at bottom prices. This is good, normal and natural, think about it.
When the market is trading at high prices, All-Time High, you will see a massive amount of people engaging and participating. There is excitement, entertainment and fun and that's what people want.
The market being overbought and trading at high prices, lots of activity and many people ready to buy is a clear signal that the top is in a crash comes next. Remember, most of the people are not here to make money, grow or learn, most of the people engage in "trading" to lose money, and that's why there is no interest when prices are lower. Only smart investors, smart traders and whales tend to be looking at the market when prices are great.
Just watch! Just wait!
30 days from now the Altcoins market will be high up. All the trading pairs will be anywhere between 100% and 300% higher compared to current prices, this will not be the top but only a start. At this point, watch the rush and experience all the action around Cryptocurrency, it is just how it works.
Imagine an amusement park but with no entertainment involved. Nobody will pay to visit this park. When they add the games and the rides, loud music, dance and shows, people will go there to play and have fun.
People don't care about the price, they just want to exchange with others and be part of this world.
Humans like to be in groups, community; when Crypto grows, everybody will join.
The ghost town vibes is the best signal that confirms bottom prices and a bull market about to develop. It is the best signal pointing to a strategy of buy and hold. Focus on the long-term.
Whatever happens, think long-term. You can't go wrong when buying at the bottom. This is your chance.
Thank you for reading.
Namaste.

TRUMPUSDT LongTRUMP buy signal on M15 Timeframe. Triangle pattern was succesfully broken on bullish side. Now bullish target is 8.66 level, Risk reward 1/5. On higher TimeFrame bullish target is 9.4 level.

Shiba Inu 1,479% Bullish Wave Starts Now (2025 Bull Cycle)Shiba Inu is now starting a new rise similar to early 2024, February, but much stronger much stronger.
Good afternoon my fellow Cryptocurrency trader, here we have a long-term chart.
The structure of the chart is quite revealing and leaves no room for doubts. SHIBUSDT is bullish now.
There was a correction after the March 2024 high ending in higher low. This then proceeded to produce a lower high and then a new lower low. The action is now bullish as it recovered above the August 2024 low.
Three weeks closing green now, trading green as this one is yet to close. This week is the confirmation as closure happens above long-term support. Touch and go. The action moved below on a wick just to recover, this is a strong bullish signal and when the week ends at 0.000012500 or higher full bullish confirmation is in. The 2025 bull market starts.
Early 2024 was the initial bullish breakout and this breakout produced massive growth, it was great but nothing compared to what is coming next. The next wave will be many times bigger because 2024 was still part of the transition year while 2025 is the bull market. 2026, after the peak and new All-Time Highs, a bear market will develop.
The bear market is followed by a new period of sideways, transition and then a new bull market. The market moves cycles and these are repeated over and over like night and day. 4-years based on the Bitcoin halving. It can extend but most likely it will continue to be the same.
The targets can be seen on the chart. Maximum growth, strong comes ahead.
» A nice target sits at 0.000139 for 894% and new ATH potential up to 1,479% at 0.000220. We will have to wait and see, it is too early but the market is turning green now and will continue to trade green. It can happen that it go higher rather than lower based on the chart. It can happen that rather than overestimating the potential of this pair, we are underestimating it, this too would be good, the more it grows the better it gets.
Namaste.

OFFICIAL TRUMP 100X Chart Setup Now PossibleLook at this, the bottom is in.
I draw a black line on the chart that matches the wick low from the 3-April candle. Today, the action is back above this low.
All the action below this line is the bottom pattern. It takes time for a bottom to form and this bottom is now confirmed. Once the bottom is in, nothing else can happen other that sustained long-term growth. If the action wasn't sustained long-term, then this wouldn't be the bottom, just another low in place.
This is it, feel free to go All-In with 100X...
I am just kidding of course, leveraged trading is for experts and experts will never gamble their money away.
We trade with 2-3X maximum when we are doing our daily work and we go to higher leverage when the market is trading at its lowest prices possible and this happens only once every 6-8 months.
So, no 100X.
On top of the bottom pattern there is also a falling wedge. The falling wedge has been broken and this means a broken downtrend. What happened with the token unlock?
People were saying that prices were to drop because there was going to be a token unlock, but the market cycle does not care about these things. When prices are low we buy and hold, we sell when prices are high and green.
The targets on the chart are just easy targets, it can go much higher... Much, much higher than what is shown on this chart.
As prices grow, I will publish updates. If you are interested, make sure to boost and follow to show your support.
More comments and boosts, more updates.
Just let me know and I'll get it done.
Namaste.

ETHFI Breakout Loading? Targets Up to $1.67!$ETHFI/USDT Analysis
Price is currently trading around a key resistance zone after a strong recovery from recent lows. While momentum looks bullish, the resistance has not been broken yet — making this a crucial level to watch.
A clean breakout and candle close above this zone could confirm a potential rally toward the next targets.
🎯 Upside Targets (if breakout confirms):
TP1: $0.881
TP2: $1.291
TP3: $1.677
📌 For now, stay patient. Let the price action confirm before entering — this zone could act as a rejection point if bulls fail to push through.
DYOR, NFA

Altcoins, Crypto is different since institutions came inHow long have we been saying this? Yet the masses have not grasped this concept. Neother have influencers. But that makes sense because they need clicks to survive. People tend to "graze" where pasture seems greener, even if it isn't.
CRYPTOCAP:TOTAL 3 = NO CRYPTOCAP:BTC or CRYPTOCAP:ETH
Altcoins have been in a steady incline since Nov 23.
Daily
The last 2 consolidation phases lasted AROUND 6 months, depending on where you begin the consolidation phase.
Weekly
Not important going further as Crypto landscape has changed & the back data is irrelevant. However, let's be nosey & see how it looks in comparison.

Basic Attention Token, An Old FriendLet's take the market bottom as the low that was set in June 2023, what do you see?
One single signal can reveal the bottom is that true?
One single signal can tell you everything that is going on with a chart, or not.
It is more about your experience, what you know about the market and the market cycle.
The main bottom for the 2022 bear market for Basic Attention Token (BATUSDT) happened in December 2022, after it goes sideways but, let's take June 2023 as the market bottom for the purpose of this chart.
#1 on the chart is a stop-loss hunt event. It leads to a bullish wave.
#2 on the chart is the same; a reversal comes next.
The bullish signal is in because #2 is already gone. The action went below long-term support (June 2023 low) is now trading back above it. Three weeks green, bull confirmed; yes we win! Yes, I win!
So this is easy don't you agree?
What's the potential for growth?
An easy target will give us some 350%. A strong target will give us 795%. Strong is not the best. We can end up with better target specially if we consider how the market in the past behaved.
Are you with me?
What do you see?
Do you agree?
The comments are the feedback, interact with me; what do you see?
Do you agree that this chart is green and set to grow?
If you agree boost, if you disagree boost and follow.
Thanks a lot for your support.
A strong rise can take more than a year to develop. With a low in August 2024, a high can happen in August 2025. Sounds early, looks early, feels early but can happen.
Taking the lowest point since the March 2020 bottom, April 2025, an entire year of bullish action would put an All-Time High in April 2026. This sounds good but, can it be true?
Too good to be true or too hard to believe?
If the bull market can be late to start, it can also end late.
Let's hope the bullish action goes beyond 2025 into mid-2026, that would be the best. The longer it takes, more time to adapt, plan and to secure wins and profits.
Thanks you for reading.
Namaste.

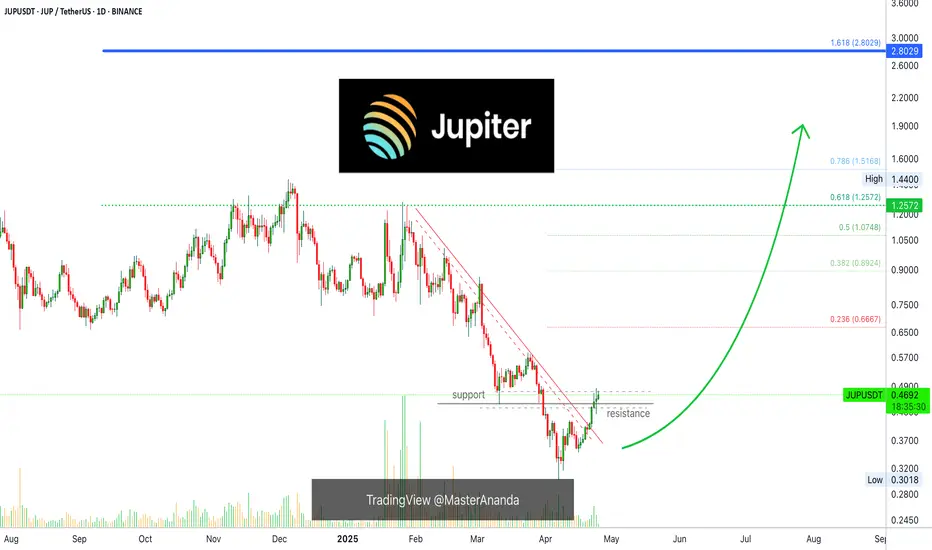
JUP Predicts The Future: Crypto Bull Market Certainty Level 100%Jupiter has been rising for 10 days straight. This hasn't happen since October 2024. The bullish bias has been revealed. This is a type of bullish consolidation. The action is back above the 11-March low. Yesterday's session wicked below, closed above. Bullish, bullish, bullish all across.
Jupiter is preparing for a nice jump.
Good evening my fellow Cryptocurrency special-genius trader, it gets better everyday.
What if... Right!
Do you agree? Ok!
The support/resistance dynamic is back in full view.
The continued growth is a very much strong revealing signal should be paid attention to. It works.
Signals like these are simple signals but can reveal everything, it works really good trust me.
Ten days straight moving up. There is a red candle in-between the rise but this does not nullify in any way the rise. It works. Trust me.
It is actually quite entertaining when you see the results.
Making the prediction is nothing, it is great when you see it work.
So these are the signals, simple signals and yet it works.
Watch! Jupiter (JUPUSDT) is set to grow. Deduction/conclusion arrived at based on the chart. 100% the chart even predicts political events. It has been proven many time now in the recent weeks. See this...
Major events will develop that will propel the market up. Political events, why? The charts are bullish and pointing up to massive growth. If any event is needed, the market creates it so soon these events will be public and the market grows.
The market grows because it is set to grow. It has already been decided it is already true. It only needs to show in the prices and charts.
It is like you apply for a job and you get it but you have to wait 3 months before your entry date. It is a done-deal, it is a secured deal it cannot be cancelled but you aren't still working but you know for certain. Something like this but with a higher level of certainty.
Say you have a family member 99 years old with terminal cancer and ready to go. The news are in, the data is in and everybody knows but the person is still alive. It is a done deal, it hasn't happened but will happen. Something like this. Things can be certain and yet not materialized. These things happen.
It can happen that it has been decided, it is known for a fact and sure the market will grow. Yet, it hasn't happened but this doesn't mean that it is questionable, some things can't be changed.
It can't be avoided and nobody wants to avoid it. It is the other way around, most of the majority want it to happen and it will happen. No other scenario is possible that's how the world works.
Tomorrow, it is day. Later, the night. Repeat over and over, nothing can avoid this reality from happening. Times change, it is the same.
One day it is the banks, the next day it is Crypto.
Namaste.
Stacks: Psychological Effects Of Trading & Technical AnalysisI was about to call it quits for now but I saw Stacks.
There was a guy here, a few years back. You know these people that are a true pain in the muladhara? That type of guy. He was always going about STXUSDT and as usual, I would give him the entry, the levels, the exit and he would always get it wrong.
Write, write, write, comment, comment; back and forth but never right, always wrong.
Jesus Christ!
Brahman please help!
I have positive impressions on my mind for this pair. That is because some time ago I shared a chart and it did great. This happens. When the prediction goes as planned, it records pleasant memories and each time I go through the pair the sanskaras are activated. It also works the other way. When a trade goes wrong, when I see the pair I tend to feel, "Yuck!"
Each time, good or bad, I have to overcome my mental attachments to be able to look a the pair fresh, with a new perspective, new!
If you get attached to the positive outcome, you are likely to jump in before the time is right.
If you get attached to the negative outcome, you are likely to miss it the next time prices are about to rise.
Both these need to be avoided if you are looking at charts or doing your own numbers. Detach completely and look at it fresh.
Today it is a new day. Whatever happened in the past, good or bad, has nothing to do with this present moment.
I am looking at Stacks, STXUSDT, what does the chart have to say?
A long-term support zone, mid-2023, has been activated.
All the action in 2024 has been removed. We are back to baseline, back to baseline is good for the bulls.
This pair allows buying at support in expectation of long-term growth.
Namaste.
