Uniswap Exits Opportunity Buy Zone · $73 & $118 2025 ATH TargetUniswap is finally out of its long-term opportunity buy zone, a trading range that was activated first in 2022 and remained valid for a long time.
After October 2023, UNIUSDT produced two bullish moves but each time fell back into this zone. Orange/brown on the chart. Notice how this zone matches price action happening below EMA89, EMA55, MA200, EMA144 and EMA233. As Uniswap turned bullish and fully confirmed, it broke above all this major levels.
Last week, it managed to close above the really long EMA233 and this week the action is staying above. Currently $10.30.
Notice waves "1" and "2" these are relatively small waves. Something will happen with #3. The market evolves exponentially. Instead of another similar wave going a bit higher, it will be something like 2021. Not like 2021 in the sense that it will reach similar price levels, but in the sense that it will be completely out of proportion with what you saw in the last several years. Prices will go off-the chart.
We can think of resistance as a new all-time high being found around $73 and $118, but this time I only want to call your attention to this moment now. The fact that market conditions are changing and it is still early when we focus on the long-term.
I just realized that I might be seeing things differently and it is hard to visualize, for someone without the actual experience, what is about to happen. But despair not because that is the one reason why I am here and why you are reading this. I am here to alert you, remind you and prepare you for an event before it happens. In this way, you can profit and achieve your financial goals. I want to give you value in exchange for your trust. Will you trust? Uniswap is going up. Crypto is going up and it will be the best since 2021. Possibly the best bull market in the history of Crypto, the new regulatory framework and global adoption is saying so.
Thanks a lot for your continued support.
Namaste.
Altcoins

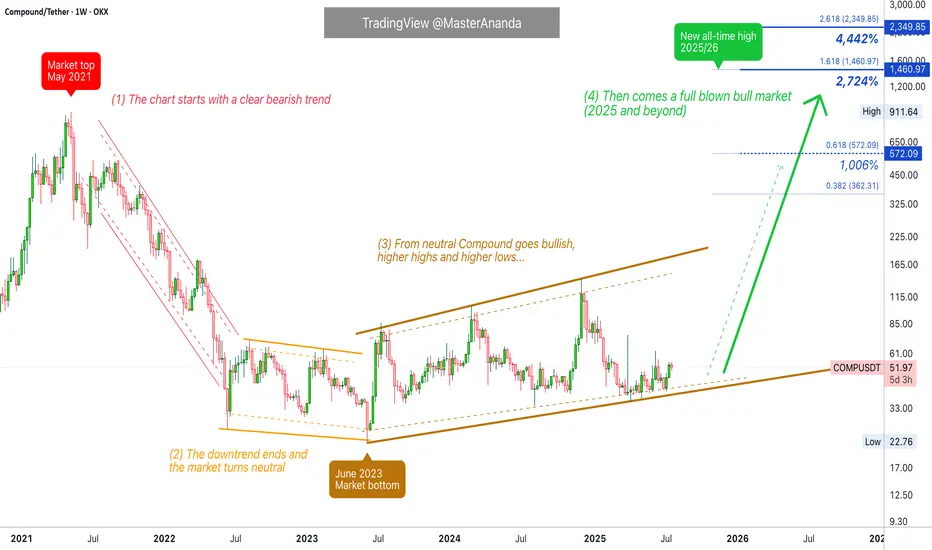
Compound Full Market Cycle · 1, 2, 3 & 4 (PP: 2,700% - 4,442%)This is the full long-term Compound (COMPUSDT) chart.
1) The market top happened May 2021. Notice how the bull market in 2021 ended early compared to 2025. While May signaled the start of a bear market, in 2025 we are already in July while trading at bottom prices.
High prices, a new all-time high, signals the start of a descent and bear market. COMPUSDT dropped from May 2021 until June 2022, more than a year. A shy lower low happened next around June 2023, a technical double-bottom.
2) Between June 2022 and June 2023 we have a neutral period, sideways. This is a "lost year."
3) Market dynamics change after June 2023. COMPUSDT stops producing lower lows and instead starts a bullish consolidation phase. Higher highs but still sideways. No major uptrend. This period lasts from June 2023 until present day, July 2025.
The pattern will break with a strong close above $150 followed by a sustained uptrend.
4) This is the 2025 bull market which can extend beyond this year into 2026, hopefully. Here instead of neutral or sideways, we should see a major uptrend as the mirror image of the 2021 downtrend. Also, a new all-time high is needed and expected to end this cycle. When the new all-time high hits, bearish conditions develop and the next bear market starts.
Potential for growth is huge, between 28 and 45X.
Thank you for reading.
Namaste.
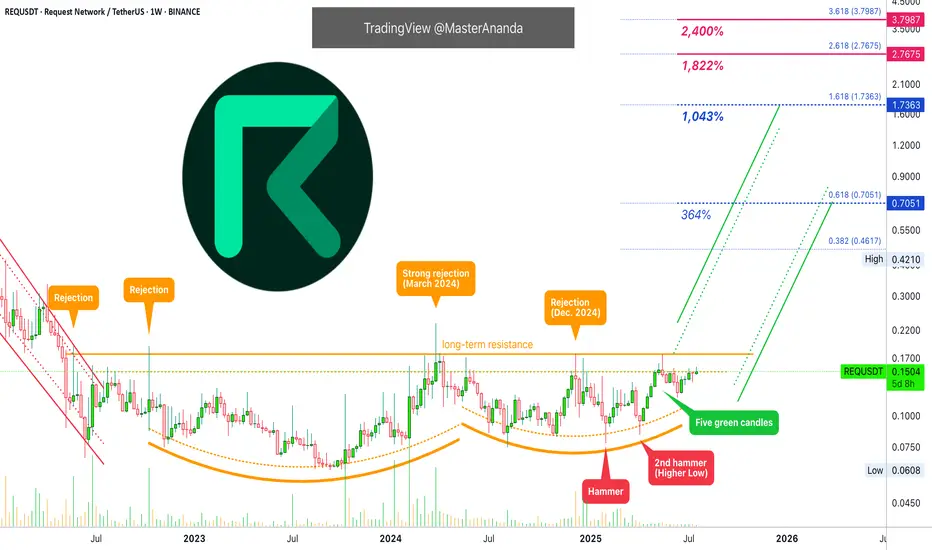
Request Network Has 1,800% Potential for Growth (Lev. Setup)This is a chart setup that I am opening with leverage. It is not available on many exchanges and this reduces risk for swings and shakeouts. The action has been strong.
Request Network (REQUSDT) produced a strong higher low in June compared to February and April this year. Many pairs produced double-bottoms or even a lower low in June. A higher low definitely reveals strength. This is what we have here.
The consolidation period has been going for 1,169 days. This is the exact same number we found on the DigiByte chart, more than three years. Three years of consolidation can lead to a very strong bullish cycle. So strong that it is hard to visualize but it will happen.
I am mapping a 1,800% target but just to be safe, I also have the 2,400%. Again, when the market lasts this long in the accumulation phase, it is because it is preparing for something great. The action is about to start within weeks or days.
The last barrier is the long-term resistance (orange) line on the chart. Once this level breaks, immediately you can expect +300% to 500%. After this initial boom, you can enjoy slow and steady growth for months. That's where we are headed. This will not only happen to Request Network but for most of the altcoins, Bitcoin is already up.
Retraces and corrections should be considered an opportunity to buy-in, rebuy and reload.
Namaste.
Nillion Token · Time Sensitive · Easy & Fast 247% ProfitsI am seeing many charts like this one with fully confirmed signals and ready to produce a strong advance exceeding 100-200% growth. The full move can develop within 2-6 weeks. Can be less if the action is very strong.
We are looking at Nillion Token (NILUSDT) on the daily timeframe. Our attention is called to two signals mainly: (1) A low mid-April and (2) an ascending triangle.
The ascending triangle is a classic reversal pattern. Since this pattern is complete with the action moving above the mid-April low, we have a fully confirmed bullish bias. There is also the current candle with a long lower wick. Sellers started the day but the bulls are ending it on a high note.
The beauty of this chart setup lies in the risk and potential for profits. Very low risk because the signals are strong, and profits can come fast because the bullish move is already advanced.
Get in and get out. Easy chart, easy profits, easy win, easy trade.
Thanks a lot for your continued support.
Namaste.

NEAR Swing Long Idea - Altseason 2025📌 Fundamental Sentiment:
The entire crypto market is rallying, alongside other risk assets. This is mainly driven by U.S. policy expectations — Trump is pressuring Powell to resign and aggressively pushing for rate cuts from the Federal Reserve.
📌 Technical Analysis:
NEAR has recently broken and closed above a significant HTF support/resistance level.
Additionally, we’re now trading inside the 0.75 Fibonacci retracement level of the HTF bullish trend — which I define as the maximum discounted zone.
For this setup, I’ll apply my Deep Range Theory (DRT):
If price dips below the 0.75 zone and accumulates there,
Then breaks above 0.75 after a period of consolidation,
→ It signals that price aims for the 0.5 level of the range and will likely run HTF liquidity for either reversal or re-accumulation before continuation.
📌 Gameplan:
✅ Break and close above HTF S/R
⏳ Waiting for break and daily close above 0.75
🔄 Retest to LTF demand (4H–1H)
📈 A bounce on LTF demand will trigger the long setup
📌 Trade Management:
This is a mid-term swing trade, as I’m following the HTF bullish trend.
🎯 Target: $5 — which is approximately a +70% move from current price.
❗Risk Management:
If price makes a daily close back below 0.75 after breaking and closing above, I will exit the trade to preserve capital.
I’ll also monitor macro sentiment closely. If there's a sharp bearish shift, I may consider an early exit before reaching the HTF target.
—
🔔 Follow the channel for daily trade ideas & weekly macro recaps.
💬 Drop a comment below if you have any questions or insights!

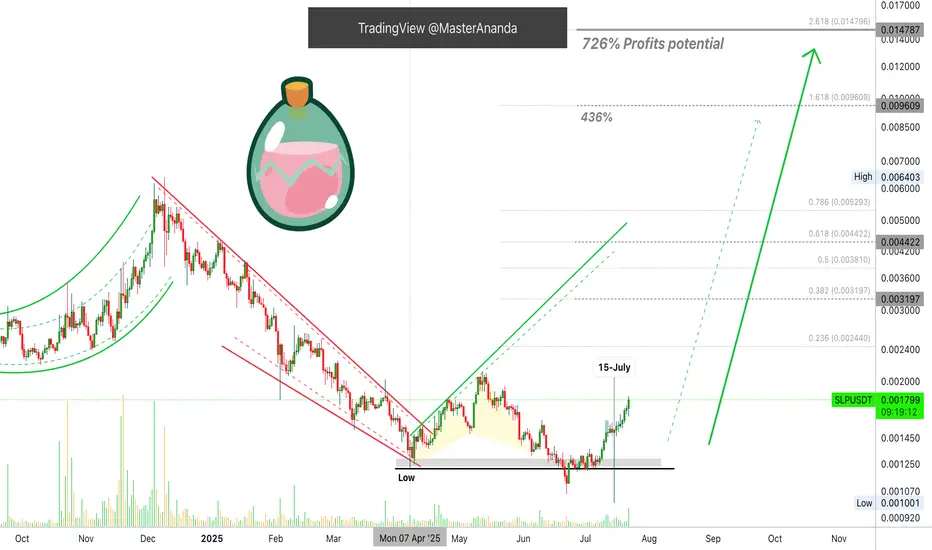
Smooth Love Potion 726% Easy Target & Technical AnalysisAs you already know the main low happened 7-April. It is always the same date but we are looking at a different pair so please, bear with me. Stay with me and continue reading because you are going to love the results. The technical analysis can be repetitive and that is only because I like to keep it simple using signals, systems and technics that work. I don't care about three hundreds indicators as long as the market moves in my predicted direction.
The low happened in April and then we have two challenges of this level, lower lows. In June two days closed below (black line on the chart) just to recover. There you have a strong bullish signal. A failed signal on the breakdown. Then again on 15-July there is a very long lower wick session and this is truly the most bullish signal ever. On this date there was massive selling and the action reached the lowest ever just to recover, the day closing green. When you see a candle like this, you know for certain and for a fact that the bearish move is done, not possible anymore.
Strong selling did happen, so strong that it created a major low—outside the broader marketwide pattern—but everything was bought within hours. Since all the weak hands, all leveraged positions, all stop-losses, everything was activated on that move, what is left is a bullish wave. There is no liquidity left on the downside so the market has to grow next, and this is exactly what is happening.
Now, very easy within months we can see 400% and even 700% growth. Of course, this will be far from the end. These targets are based on the daily timeframe. If we consider the long-term picture, Smooth Love Potion (SLP) can grow so much more. If you are interested in such numbers and projections, boost this post to let me know. If enough people want to see it I can publish a new chart with the new all-time high and beyond.
Thank you for reading.
SLPUSDT has been growing since June 22, an entire month. The price pattern is very similar to what I just explained on Toncoin, a major boom will develop in the coming weeks. It can be just a few days from now, say 2-3 days, or it can take a bit longer but it is getting close, so close, that you can obviously see pricing rising right now and the green candles are getting bigger... It will only get better.
Thank you for the love.
Namaste.
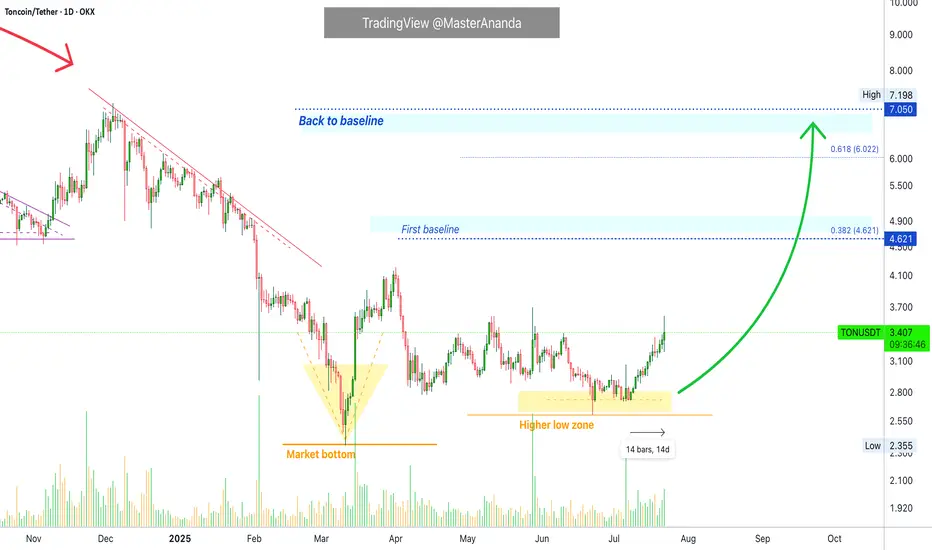
Toncoin Update · A Closer Look · Major Move in the MakingConsider this, Toncoin has been growing steadily for fourteen days straight. The growth is slow, steady and patterned, but it keeps on happening. Notice no strong sudden jump but still, straight up. This is how the bottom is missed.
At times, we buy and we are waiting for a sudden jump but this almost never happens. The way it works, in a bull market, we get a long drawn out build-up of bullish momentum. After weeks, or sometimes even months, of prices slowly rising, then we get the sudden jump. This is to say that we are getting close.
Toncoin will continue in this pattern for days, can be weeks or even months; but at one point, there will be a major advance producing such amazing growth. Consider Bitcoin Cash on the daily timeframe for an example.
There is one more thing we need to do but I will leave this for a different publication. We need to consider the true all-time high potential.
As you might be aware, we've been looking together at "conservative" and "easy" targets for the next high and bullish wave, we are leaving this approach behind. Now it is wise for us to consider 'true' potential, 'optimistic' and 'real' targets, the highest possible, etc. So we are going to be looking at how far up Toncoin can go in the coming years and months.
Your support is highly appreciated.
The action now indicates that a major move is in the cards for this pair. If you want to catch one of those waves where you see +100% or +200% within weeks, you can sit on your TON tokens, this will be it.
It is going to happen but keep in mind that patience is key.
After you buy you hold, wait long and the market takes care of the rest. The wait is worth it when you consider the amazing profits and results that can be achieved. You deserve the best.
Keep going; keep in insisting; keep trying, keep learning, keep pushing, keep growing. We are going to achieve our goals. If you stay around long enough, the market will give you exactly what you want.
Money? peace of mind? More time to do the things you like?
Not having to leave your home to work? It is possible with Crypto.
Thanks a lot for your support.
Namaste.
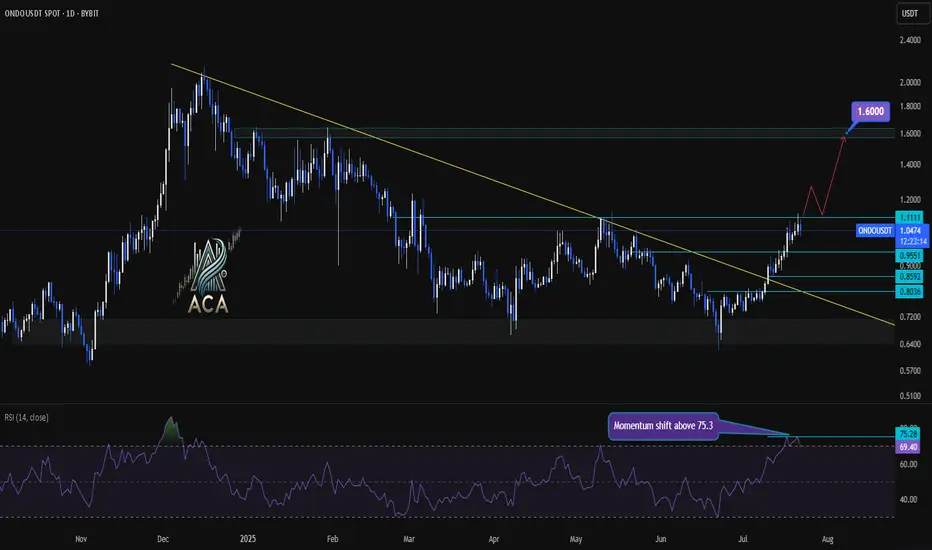
ONDOUSDT Daily Chart Analysis | Momentum Shift & Breakout LevelsONDOUSDT Daily Chart Analysis | Momentum Shift & Breakout Levels
🔍 Let’s dive into the ONDO/USDT daily chart and break down the latest momentum signals, key breakout areas, and targets for bulls.
⏳ Daily Chart Overview
The daily trend shows significant recovery after prolonged downward pressure, with price action now testing critical resistance levels. A key descending trend line has recently been challenged, highlighting a potential shift in market structure.
🔺 Bullish Setup
- Momentum Trigger: The RSI has closed above 75.3, signaling a strong momentum shift and upping the odds for continued upside.
- Breakout Confirmation: Watch for a daily candle close above the $1.1111 resistance level. This would confirm a bullish breakout and could serve as a solid trigger for further upside.
- Trend Line Dynamics: The price has decisively broken above the major descending trend line, which had capped rallies for months—removing a significant area of supply and emboldening bulls.
- Upside Target: Once confirmed, this setup opens the door for an advance towards the $1.60 area, where the next major resistance sits.
📊 Key Highlights
- Daily RSI closing above 75.3 reflects strong market momentum and buyer dominance.
- A daily candle close above $1.1111 can be used as a bullish trigger.
- The long-term descending trend line has been broken, indicating a major momentum shift.
- Immediate upside target stands at $1.60, representing a clear resistance level for profits or further evaluation.
🚨 Conclusion
Momentum is clearly shifting in favor of the bulls as technical barriers fall by the wayside. For traders looking to position long, confirmation above $1.1111 combined with the powerful RSI reading sets the stage for a move towards $1.60—keep these levels on your radar as the setup plays out!
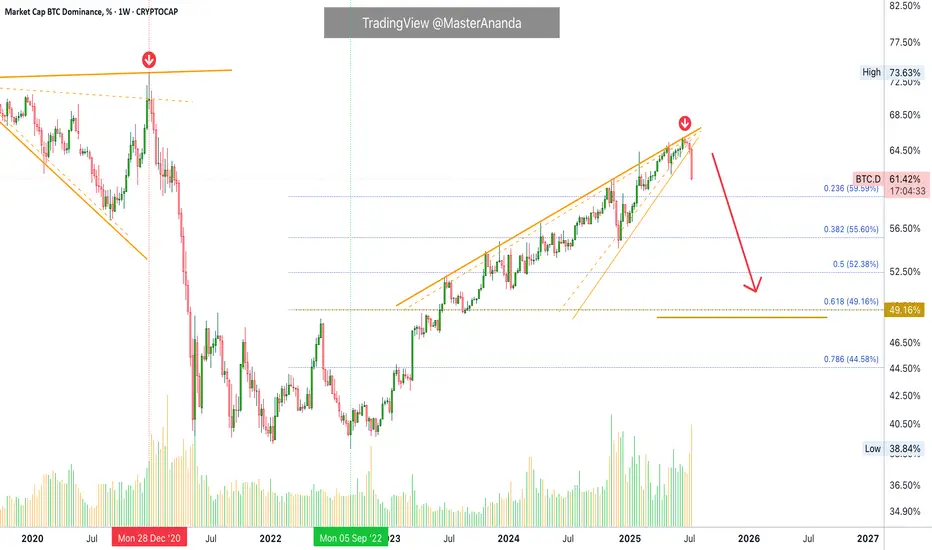
Bitcoin Dominance Weekly · Highest Bearish Volume in YearsThis week Bitcoin Dominance Index is producing the highest bearish volume session since February 2021. More than 4.5 years.
This week we have the strongest bearish action since June 2022. We can say that the altcoins market bull market is not only fully confirmed but already underway. We are already experiencing the best altcoin season since 2021 but it is still early, this is only the start.
Bitcoin Dominance is set to produce the strongest drop in many years and this only happens when the altcoins go ultra-bullish.
Bitcoin is moving sideways right now near resistance. As Bitcoin does this, the altcoins continue to move forward. This is classic bull market dynamics. When Bitcoin consolidates at a high price, the altcoins tend to explode. You can expect this pattern to continue to repeat for months to come. There is more good news though.
The fact that the altcoins are growing, perfect examples right now are Ethereum and Litecoin, is a bullish signal for Bitcoin.
It is not like the altcoins will grow and then Bitcoin will drop, no. Bitcoin consolidates and the altcoins grow, when Bitcoin stops consolidating it will move forward and hit a new major high, that is a price just around $134,000 and $136,000. When Bitcoin hits this price the altcoins continue to grow, back and forth. This is the most bullish the market has been since 2021. We will have to wait and see where this will all lead but new all-time highs are expected across all major projects and then some. Bitcoin is already in new all-time high territory but we need a new all-time high on Solana, Litecoin, Ethereum, Cardano, and so on. XRP is already at a new all-time high but it has much more to give.
If you visit @MasterAnanda, you will find up-to-date analyses for all these altcoins with new updated not conservative but realistic and good optimistic targets.
I will continue to share updates throughout the entire bull market. This is only the start. Get ready because the best is yet to come.
Namaste.
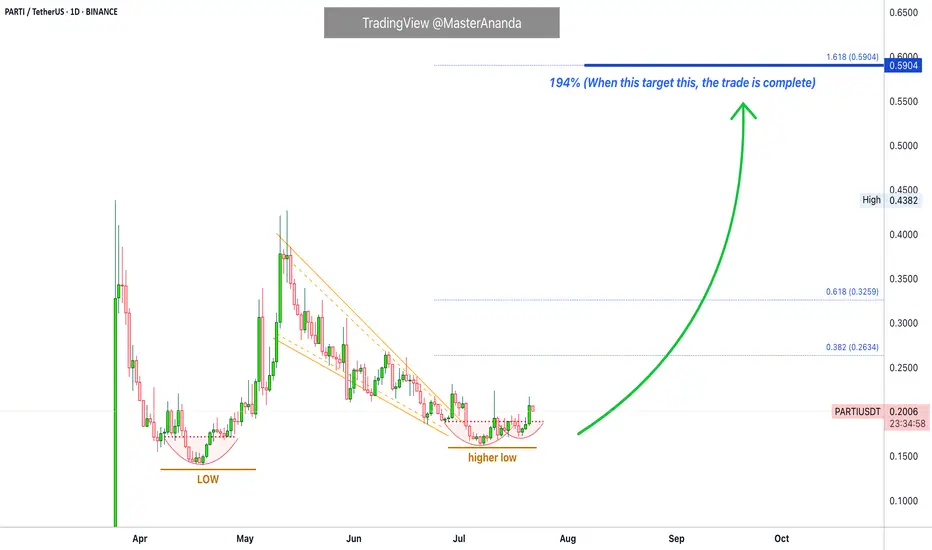
Particle Network Short-Term Trade Setup @194% Profits PotentialHere is the thing, the young charts we are using for the short-term trades, and this makes sense because we can't make much of a long-term prediction with no data ok?
Let's trade!
Basic and simple. I can't do it any other way so you will see me repeating the same. The truth is that simple works. If you can't explain something in a simple manner, it simple means you don't understand it well enough. Well, I understand this thing nicely because I will make it so simple for you, that you have to agree and even a three year old can say, "True, Master is right, I agree with his interpretation of the chart."
Low and higher low. Beautiful.
A bullish wave leads to a correction. The correction ends in a higher low. This confirms the bullish bias. The higher low is the place that will launch the next leg up. Minimum target is always the 1.618 Fib. extension. This is mapped on the chart as 194%, once it hits, the trade is closed and over. Take the profits and move on.
Thanks a lot for your continued support.
Thank you for reading.
Namaste.
Adventure Gold 679% Easy Target, High Profits & TA (8X Lev)I can translate all of the signals and all the chart data but the truth is that "bullish" because that is what the chart is screaming to me. The chart is saying "bullish" and my intuition is telling me that Adventure Gold (AGLD) is going to move next.
Notice I continue to pick the ones trading low near support. Those trading within the "opportunity buy zone" for our trades. When it comes to those already moving, I only give updates. When it comes to buying and trade-numbers, I choose the ones with low risk vs a high potential for reward.
AGLDUSDT has been closing green four weeks slowly rising, but prices remain very low. This is a bullish type of consolidation. It is a tricky signal because it might look weak but the truth is that this pattern tends to transform into a bullish explosion. The choice is yours.
I give you the chart, the translation, the basics, the training, the learning, the entertainment, the inspiration. I give you peace of mind and the right price. You have to take care of the rest. I can show you the door, but you have to cross it. You have to buy and hold, and be ready to sell when prices are at resistance or near resistance where I show in these charts.
We are a team. It is a huge sacrifice to be able to read the charts without losing focus, without going crazy due to all the distractions, all of the attacks and all of the stress. I have to develop a Buddha kind of meditative mind to be able to keep up and give you only the best. You know I can do it because I've been doing it, the results will speak for themselves, but is it not easy. I have to give my life for these charts and this market, but it is worth it if you take action and use this information to achieve your goals and financial success.
Thank you for reading. We are in this together.
I love you, truly. We've been together for so long, and this is only the start.
Namaste.

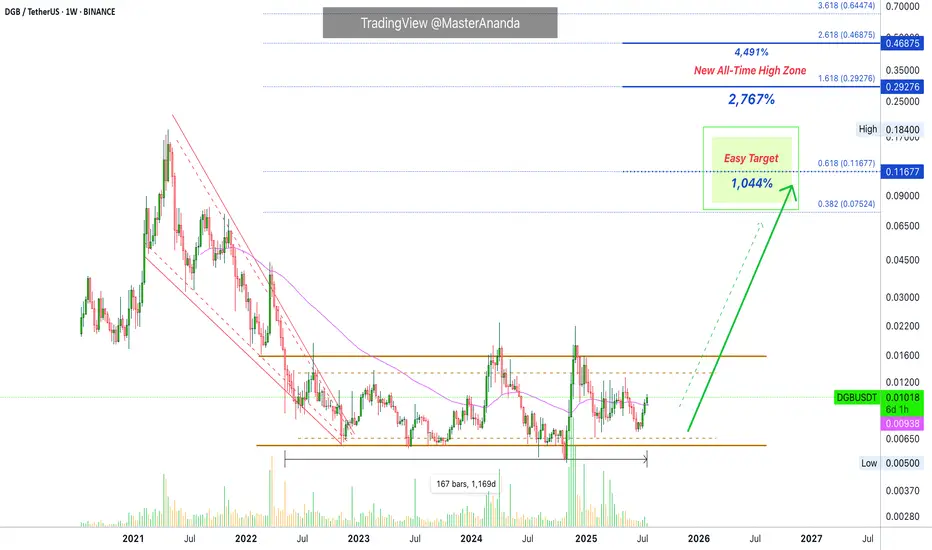
DigiByte Update · Optimistic New ATH · 1000%, 2800% & 4500%I will explain everything. The technical analysis, why I believe DigiByte can grow beyond 2,700%, and the overall Cryptocurrency market conditions.
Good evening my fellow Cryptocurrency trader, I hope you are having a wonderful day.
First, let me tell you that DigiByte (DGBUSDT) is fully bullish confirmed based on technical analysis. In simple terms, the action is happening above EMA55 weekly and we have higher lows since November 2024 and three weeks closing green.
Since there are now new lows in 2025, this clearly shows a lack of bearish trend. There is no bearish trend but neither a bullish trend, the market has been sideways. DigiByte has been sideways now for 1,169 days. And this is the reason why a new all-time high is possible in this year and bullish cycle. This is simply the strongest consolidation phase ever in the history of this market.
A 1,044% target at $0.116 is very easy indeed and should be hit without a question. But the fact that the market has been neutral for so long opens the doors for a massive bullish cycle and this is why we are aiming higher. Just as a new all-time lows can be hit within a bearish period, new all-time highs can be hit within a bullish cycle. Consider $0.29 or higher.
Just consider inflation, how much the world changed in the past four years. All the advances when it comes to regulations and acceptance towards this market. A new all-time high is only logical and easy to conceive. It is also supported by market sentiment, marketwide action and technical analysis.
DigiByte will not stay behind. It will surely perform just as you expect or even beyond. The Cryptocurrency market tends to surprise, it always go beyond our expectations.
Thanks a lot for your continued support.
Namaste.
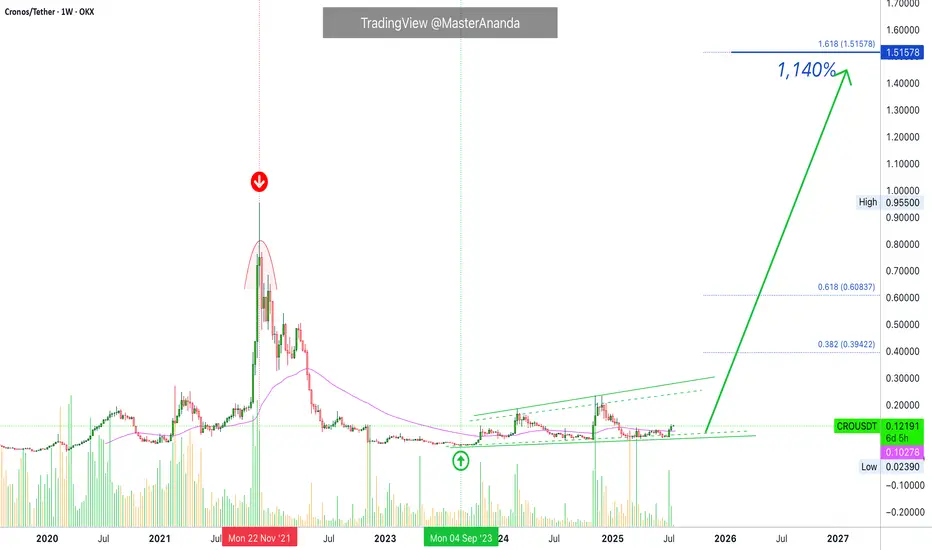
Cronos 2025/26 New All-Time High Revealed · PP: 1,140%Cronos has all the classic signals ready, confirmed and combined. RCC. And this opens the doors for a major advance which will not be shown fully on this chart. That is because I am using the linear chart for perspective but the log chart is needed to see all the major targets. Just trust, it is going to move very high in this bullish cycle run.
Good afternoon my fellow Cryptocurrency trader, I hope you are having a wonderful day.
Didn't I told you that you would see so much growth, that you will become complacent at some point? We are not there yet, but we will get there and you will have new challenges to face. Believe it or not, taking profits, using your earnings, will be one of the hardest things to do but the only right choice. A win is only a win when you close when prices are up.
Just as you cannot incur a loss unless you sell when prices are down; you cannot secure a win unless you sell when prices are up. When a pair grows 1,000%, you should take profits, period. When a pair growths 500%, it is wise to secure, 10%, 20%, etc. A plan is needed to achieve maximum success.
How you approach the market will depend on your goals, your capital, your trading style, which projects are available to you in your home-country, and so on.
A long-term investor does not need to sell, can continue to buy, accumulate and hold for a decade or more. Can you see? Each strategy is dependent on the person behind it.
CROUSDT · Trading weekly above EMA55 while still near the bottom. The bottom is revealed when we compare current candles size and location to the 2021 high price.
Last but not least, notice how each time there is a strong increase in trading volume the weekly session ends up closing green. Bullish volume is dominating this chart. A long-term accumulation phase.
Without further ado, the next and easy all-time high target is $1.51 but it can go much higher. Total profits reaching 1,140%.
Thank you for reading.
Namaste.
UMA · $6.65 Easy Target · Much Higher Possible Late 2025 · 1220%$6.65 is actually a very easy and conservative target. We tend to cap profits potential when we approach the market using leverage. When doing spot, we get all the targets all the way to a new all-time high—price discovery—and beyond.
Here we have a very strong bullish chart setup. Consider this. When the action recovers above long-term support we know this to be bullish. I just mentioned this signal on APEUSDT.
UMAUSDT moved below not only August 2024 but also October 2023. It has recovered, it is trading back above both levels and this is truly as good as it gets. We can see a break above EMA55/89 (3D sessions) coupled with rising volume and very, very strong full green candle. This type of action reveals the start of a major bullish advance.
I think UMA can easily hit $10, $17 and $23. Somehow I am getting the feeling that $23 will not be the end of the bull market for this pair. Which means that it can go higher... We will have to wait and see of course. Growth potential is always unlimited. There is no limit to the upside. Anything can happen. We are open to see maximum growth in the coming months. The strongest bullish cycle in the history of Crypto.
Thanks a lot for your continued support.
Namaste.

Solana About To Gain Bullish Momentum Towards $420, Later $1000+It seems like Solana has been taking forever to grow, to recover; it seems like a long time. Let's do some maths. The bottom was in 7-April and we are now on July 21. 98 days. A little over three months. That is how long it has taken Solana to move back above $200. Seeing that the all-time high is $295, this isn't a long time, we are getting close to resistance and this resistance will break easily just as it happened with Bitcoin. Solana is set to grow to $420 mid-term and this bull market is likely to give us a target of $620 and potentially $1,000. $1,000 is the bright spot we want to hit on the bull run phase.
Why aim so high? Because the correction was really small in comparison to Solana's major bullish cycle since 2022. Solana crashed and crashed really hard but this hard-crash led to the strongest bullish cycle ever. Only in January 2025 did Solana stop too breathe and it did so by doing a 60% drop-market flush. With this drop over, Solana can produce the continuation of its long-term, eternal bullish cycle. Higher and higher, week after week, month after month.
If you are a Solana holder I just want to tell you to be patient on this pair. All the gains that have not been done in the past will be fulfilled in a matter of days. Solana will catch up with the rest of the giants and grow strong. Once Solana is up there at a new all-time high, the rest of the market will continue to grow.
Think of Solana behaving just like Bitcoin; when it reaches high up, instead of crashing we can experience some consolidation followed by additional growth. When we are close to the true cycle top, money will flow out of these big projects into the smaller ones, creating a major bull run.
All is good and perfect and it is early still today. Think about it, would it be late to buy below $200 when you know the potential is 1K?
Thanks a lot for your continued support.
Namaste.

Apecoin Technical Analysis · New All-Time High & Easy TargetsAs I told you just recently, the moving averages can be used in different ways. The main way is to gauge the market bearish or bullish potential and this is the classic way. The second one, less conventional, is to know how advanced is a trading pair within the current cycle.
Before everything was growing, we would confirm a pairs bullishness by looking at EMA55, EMA89, EMA144, MA200, etc. But now that we have a confirmed bullish bias, we can use these same moving averages to see how much room there is left for growth. For example, here APEUSDT is trading below EMA55 weekly. This is great news. This reveals to us that this pair is still early. As we know the entire market will move upwards based on the classic four years cycle—a bull market every four years, or the fact that a bull market happens the year after Bitcoin's halving—catching a pair before a major breakout can be life changing, profits can be huge.
But we still need some bullish signals though so let's look at those. Apecoin moved below its August 2024 market bottom. This is bearish. Once the action is happening back above this long-term support level the bullish bias is confirmed. Currently, APEUSDT is trading above its August 2024 low.
Another good and strong bullish signal is the classic rounded bottom pattern. On the 7-April low a rounded bottom pattern formed to produce a reversal. Notice how the trading volume is much lower on the last low compared to previous action. If the market was set to continue lower long-term, the lowest point would have high volume. Lower lows with decreasing volume signals that the bearish trend is losing force. This is already confirmed here because Apecoin produced a higher low in June and has been closing green several weeks.
Technical analysis coupled with marketwide action. Apecoin is set to grow strong long-term.
Thank you for reading. I hope you find this information to your liking. I hope you make tons of profits in this bull market cycle and fulfill all of your goals. You are appreciated.
Namaste.

Ethereum: Breakout Holds Strong | Next Targets $4K, $7K+Last week, three major crypto bills cleared the U.S. House of Representatives—and Ethereum (ETH) is emerging as the biggest winner from this legislative momentum.
ETH recently broke out of a rounding bottom pattern and hasn’t looked back. Momentum continues to build, and it’s now outperforming most other major assets.
📈 Technical Highlights:
✅ Short-term target: $4,000
✅ Long-term potential: $7,000–$8,000
🛡️ Key support: $2,700–$2,800 (bullish as long as this holds)
📣 Takeaway:
Ethereum’s breakout remains intact. Pullbacks into support could offer high-probability setups for swing traders and long-term investors.
#Ethereum #ETHUSD #Crypto #Trading #TechnicalAnalysis #CryptoTrading #EthereumPrice #Altcoins #Bullish #Breakout

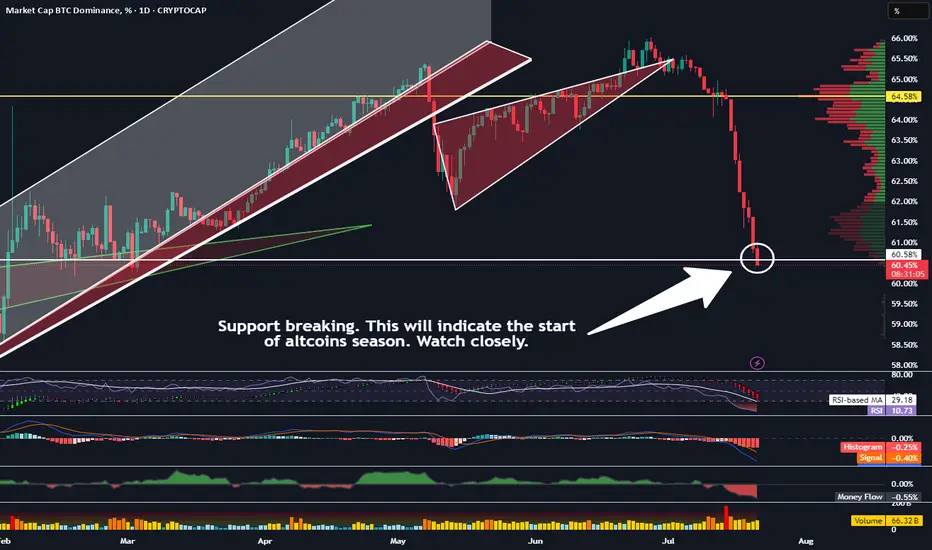
When This Support Breaks, Altcoin Season Becomes Official!Trading Fam,
We have many signs that altcoin season is almost upon us. Solana is breaking important resistance. Eth is nearing its target (both of these posts can be found below). But the most important indicator imo can be found on our BTC.D chart. Dominance has now reached an important support. I was kind of expecting a bounce here. And it still could bounce. But if it doesn't, then I feel like I can officially state that we will be in altcoin season for the rest of the year. Here's what you should be watching. If the body of that daily candle closes below our support today and then a new one opens and also closes below the support, its a wrap.
Let's go!
✌️Stew
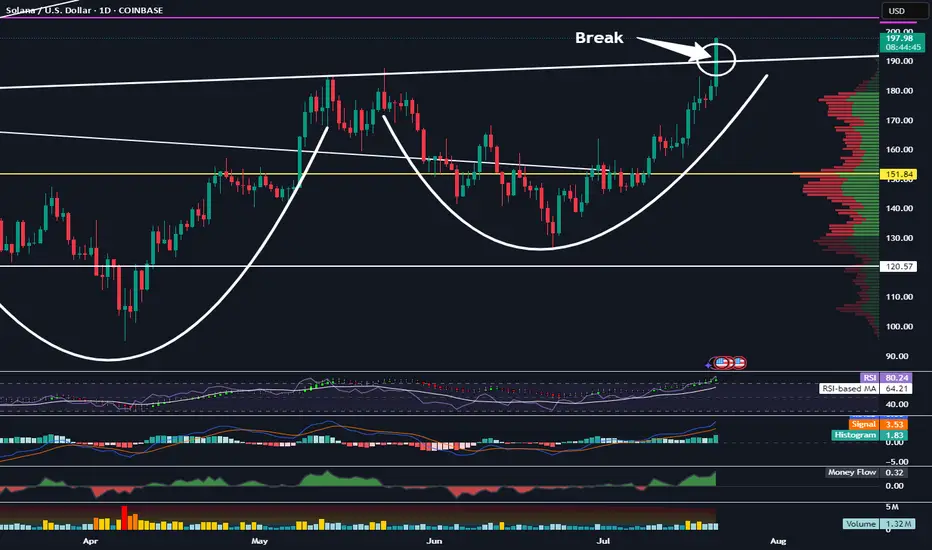
Solana Has Broken This Important Resistance LevelTrading Fam,
Things are definitely heating up in the altcoin space. Two big key movers are ETH and SOL. Right now SOL has broken a very important resistance level in the neckline of this inverse H&S pattern. Watch closely. If the body of our daily candle closes above this today and remains above it tomorrow, this pattern is in play and our target would be around $275.
✌️Stew
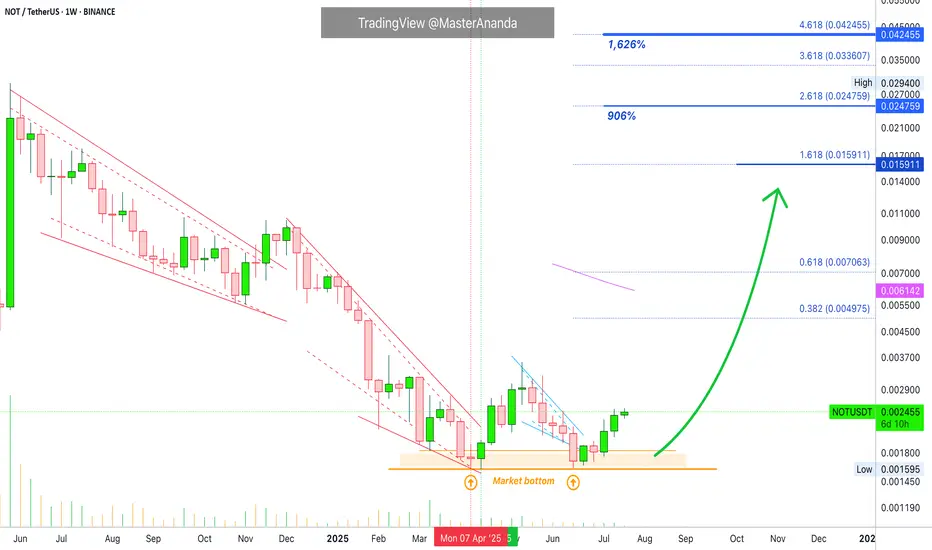
The Truth About Notcoin · Still Trading At Bottom PricesDid you miss Notcoin's bullish wave? No you didn't because it is still very early in this game. This is the beauty of the Cryptocurrency market, you can even wait for confirmation and still have access to countless opportunities.
I just showed you some charts for Cardano, XRP, Ethereum, Solana and others. What difference do you notice between those and Notcoin? Yes you guessed it right; the former are trading very high up while the latter is still trading at bottom prices.
Notcoin is still trading at "opportunity buy zone" prices because the action is happening below its May 2025 high. The trading is also happening below EMA55 and in this instance this means that it is super early. Early not bearish because we know the market is moving up based on Bitcoin Dominance Index (BTC.D), Bitcoin and the Altcoins. Everything already confirmed what we have been predicting for months.
So, NOTUSDT is set to produce a 20-30X strong bullish wave. The market is making this clear and is asking you, what will you do? How can your life change with this information that you have ahead of the masses?
While for you it might be the norm to know that "Crypto is going up," many, many people are still unaware, millions of people, and they will only join the market when prices are trading 500% to 600% up. After this we would still have the bull run.
Since you are reading this now, you have great timing and you are ahead in this game. But this opportunity buying zone won't be available for much longer, it will be gone in a matter of days. Some pairs will give us at least a few weeks to buy low, the rest of the market will start to move ahead and just several days from now, marketwide bullish action will be the norm.
You know the future in advance. Take action. Make it happen. You can change your life for the better. You can produce outstanding results.
You have what it takes to succeed in this game.
Plan ahead and you will be able to collect huge profits.
It is better to hold several projects long-term rather than switch around between pairs. Just a friendly advice.
Thank you for reading.
» Beginners should simply hold, watch and read.
» Experienced market participants should trade.
» Experts should be using leverage and pyramiding.
This is the opportunity we've been waiting for.
Namaste.
Cardano Update · Straight Up · New ATH & MoreCardano is easy to predict. We already have three great examples. Remember Bitcoin Cash? It has been growing straight up for 100+ days. Cardano will do the same. What about XRP? It is already trading at new all-time highs and Cardano is in the same group/category; big market capitalization. Then we have Ethereum which is the most recent example, as predicted, it is moving straight up. No retrace nor correction which is normal because it went sideways for months before the current bullish breakout.
Cardano has now four green weeks and this is the fifth one. This one will not be red which means straight up.
Technical analysis
I already told you about EMA55 and EMA89, weekly timeframe, ADA is trading above. MA200 as well. Notice the descending triangle on this chart. This was the consolidation period and it already broke bullish.
Targets & new all-time high
Expect ADA to continue growing until it hits the highest prices since 2021. $1.83 and beyond. Once this level is conquered, we can start rooting for a new all-time and this will happen with a high level of certainty.
Cardano will easily reach $3 and move beyond $4. I think it can go much higher...
I will do a new publication with updated new all-time high projections. The targets above are valid for the coming months.
Just a friendly update.
And thank you for your continued support.
(If you enjoyed this post, follow!)
Namaste.

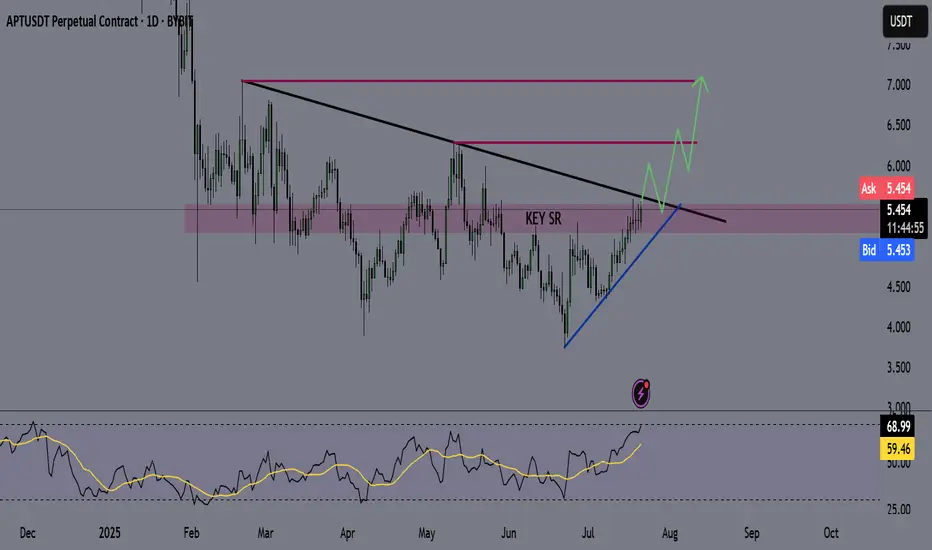
APT - APTOS Coin - Swing Long Idea📌 Fundamental Sentiment:
The entire crypto market is rallying, alongside other risk assets. This momentum is largely driven by U.S. policy expectations — specifically, Trump’s increasing pressure on Powell to resign and aggressively push for rate cuts from the Federal Reserve.
📌 Technical Analysis:
Price is currently testing the HTF supply zone with strong momentum. Additionally, it’s approaching a long-term bearish trendline that has dictated the downtrend since February 2025.
📌 Gameplan:
I want to see:
A clean breakout above the HTF supply zone with daily candle closure.
A confirmed break and close above the HTF bearish trendline on the daily timeframe.
If both confirmations align, I’ll start preparing for swing long setups, potentially riding into the early stages of a 2025 altseason.
—
🔔 Like & Follow for more daily updates. Feel free to drop your thoughts in the comments!
$PENGU: Taking Profit and Watching for a TurnIf you find this information inspiring/helpful, please consider a boost and follow! Any questions or comments, please leave a comment!
PENGU has made a strong move off the 0.007 level, now it just popped cleanly out of consolidation beneath the key LOI at 0.032. That break gave us the signal we needed for continuation, and so far, the price has followed through nicely.
But now, we’re approaching a zone where things could get a bit trickier.
This advance is starting to look like a classic wave 3 impulse, and while there’s no clear confirmation of a top yet, signs are beginning to flash caution. That means it’s time to start watching for potential topping behavior—especially if we move into a broader consolidation phase.
Here’s what’s on my radar:
• Wave 3 Exhaustion?
Still unconfirmed, but this could be the final leg of the wave 3 structure.
• AOI or Key Level Rejection
A stall or strong reaction near resistance could be a red flag. Channel parallel being reached.
• Bearish Divergence on the EWO
Momentum isn’t keeping pace with price. That’s often a precursor to a deeper pullback.
No need to force the next move here. This thing could just keep ripping up, but I am being extra cautious here. Not only to look for a potential top, but if a retrace is given, a potential long add to my current trade. Taking profit at these levels makes sense, especially given the early entry from 0.012 and my trade plan.
As always, trade what’s printed, not what’s hoped for. Stay nimble.
Trade Safe!
Trade Clarity!
