BTC.D+ETH.D+USDT.D+USDC.D InsightsAn interesting chart with BSL still to take and pushing for it.
If you study the time cycle of last cycles altcoin season you will see that it occurred after this chart took the range highs and BSL and then distributed from there to new lows
I believe we are seeing the same scenario setting up in this chart and data with it pushing to the BSL and range highs into supply, before a possible reversal bearish kicking off the final altcoin cycle and season.
We shall see... One to add to your watchlist!
Altcoinseason

Bitcoin Dominance Will Drop To 60% SoonGood Morning Trading Family,
I really don't have much to say on this post. My last post on Ethereum showed us an inverse head and shoulders pattern, which plays out over 85% of the time. This is a clear sign that altcoins may rally within the next week or two. And here, on our Bitcoin dominance chart, you can see that the patterns are clear, BTC dom cannot last at this level much longer before a breakdown to 61% or lower occurs. Be prepared. FOMO will get real.
Best,
Stew

Altcoin Cycle - Cycle bottoms spottedAs I demonstrated on this picture. I believe I identified the cycle bottoms and marking a new cycle low. With the BITSTAMP:BTCUSD price rising now and CRYPTOCAP:BTC.D about to meet hard resistance levels, I believe this will increase the propability of a start of the altcoin cycle. Also known as the Altcoin season.
CRYPTOCAP:OTHERS
CRYPTOCAP:OTHERS.D
COINBASE:ETHUSD
BINANCE:SOLUSD
INDEX:BTCUSD
BINANCE:BTCUSD

others - altcoins It looks like the altcoin season is about to begin and we will witness an alt party or alt season.

Altseason Index Proxy (TOTAL3 / BTC.D) Weekly TF
Symbol & Timeframe:
* **Symbol**: CRYPTOCAP\:TOTAL3 / CRYPTOCAP\:BTC.D
* **Timeframe**: Weekly (1W),
* **Purpose**: A clean, data-driven proxy for detecting altseason momentum
Technical Structure:
✅ Key Support Zones
* **13.47B (61.8% Fib)**: Critical golden zone; current price consolidation area
* **12.45B (50.0% Fib)**: Lower bound of golden zone
* **11.00B**: Historical support zone
* **8.15B (0.0%)**: Absolute bottom of retracement range
🔹 Hidden Bullish Divergence
* **MACD Histogram & Signal Lines** show hidden bullish divergence
* Price action forming **higher lows** while MACD makes **lower lows**
* Indicates trend continuation potential
🔢 Fibonacci Targets
TP1: 16.8B (100.0%)
TP2: 22.2B (161.8%)
TP3: 30.7B (261.8%)
🔄 Expected Path
* Potential short-term correction toward 12.4B followed by a breakout
* Bullish continuation path sketched with progressive Fib targets
📈 Macro & Fundamental Confluence
📉 Liquidity and Monetary Easing
* Global monetary policy is easing (e.g., Fed pivot expected mid-2025)
* Increased liquidity historically precedes strong altcoin rallies
BTC Dominance Decline
* BTC.D rolling down from long-term highs
* Signals beginning of capital rotation into altcoins
🚀 Emerging Narratives
* Rise of L2s (e.g., Base, zkSync), AI tokens, real-world asset protocols
* Fresh narratives tend to amplify altseason rotations
💼 Institutional Tailwinds
* Spot ETH ETF approvals pave way for alt ETF flows
* Regulatory clarity expected to reduce uncertainty in late 2025
Related Reference Charts:
🌐 TOTAL3 (Altcoin Market Cap Excluding BTC & ETH)
📊 BTC Dominance (BTC.D)
These charts offer standalone confirmation of:
Altcoin strength forming on TOTAL3
BTC dominance facing structural resistance
Composite Altseason Thesis:
1. Liquidity injections + halving = BTC rally
2. BTC.D breakdown + TOTAL3 support = altcoin strength
3. Technical confirmations: hidden divergence, fib confluence
4. Narrative and regulatory catalysts = widespread rotation
**Conclusion**:
We are entering a prime zone for altseason acceleration. Price reclaim above 13.47B and continued BTC.D drop will validate bullish thesis. Monitor closely for breakouts past TP1 and momentum into TP2/TP3.
📌 Current status:
- Price rebounding in the 12.45–13.47B Fibonacci zone (50–61.8%)
- Hidden bullish divergence on MACD + ascending price structure
- BTC.D has rolled off 65% resistance — suggesting capital rotation
📊 Altseason Thesis:
1. Post-halving BTC rally → profit dispersion into altcoins
2. Macro conditions (Fed pivot, record liquidity) enabling risk-on environment
3. Technical confirmation via index momentum and fib structure
4. Narrative tailwinds: Layer-2 adoption, AI-crypto, altcoin ETF catalysts
📈 Targets:
- TP1 @ 16.8B (100% Fib)
- TP2 @ 22.2B (161.8% Fib)
- TP3 @ 30.7B (261.8% Fib)
🟢 Key support: 12.45–13.47B zone; breakout + BTC.D collapse = altseason trigger.

BTC.D (Dominance at Critical Fibonacci Confluence) 2025 Weekly
**Summary:**
Bitcoin Dominance (BTC.D) is testing a major Fibonacci confluence near the 66% level. This zone historically acts as a major pivot and may signal either a continued dominance rally or a potential reversal setting the stage for altseason. We use three layered Fibonacci retracements to outline dominant trend zones, key resistances, and projected targets.
**Chart Context:**
This chart uses **three distinct Fibonacci retracements** to map the historical and projected behavior of BTC dominance:
1. **Primary Fib** (100% to 0%): Captures the macro move from BTC.D \~100% down to its 0% level at \~0%, which aligns with the first altseason (2018–2019).
2. **Secondary Fib** (100% to 38.88%): Maps the first bearish wave to identify potential recovery levels. BTC.D retraced up to the 61.8% (\~73.68%) but failed to break further.
3. **Third or the Current Fib** (73.68% to 38.88%): Maps the latest bearish fall in BTC.D. As of now, BTC.D is hovering at the 78.6% retracement level of this move, indicating heavy resistance.
**Key Technical Observations:**
* **1st TP (Resistance):** 66% — Strong Fibonacci confluence zone:
* Fib2 48.6% ≈ Fib3 78.6%
* Major reversal zone historically
* **2nd TP (Support):** 52.25% — Multi-Fib confluence:
* Fib1 48.6%, Fib2 61.8%, Fib3 38.2%
* **3rd TP (Ultimate Support):** 38.88% — Historical BTC.D bottom, aligned with the first altseason.
* Intermediate Fibonacci confluences between 48%–60% serve as layered support during decline phases.
**Indicators:**
* No external indicators used; pure multi-frame Fibonacci confluence.
* Price action structure and historical patterns highlight potential market rotation zones.
**Fundamental Context:**
The current phase of the market reflects increasing speculative activity in altcoins while Bitcoin consolidates. Historically, high BTC.D correlates with Bitcoin-led rallies, while a sharp drop often triggers altseason.
* Growing inflows into ETH, SOL, and possible now XRP, and mid-cap alts suggest capital rotation.
* If BTC.D faces rejection from 66%, the market could enter a new altseason phase.
* Macro tailwinds (e.g., easing monetary policy, risk-on sentiment) support altcoin performance in the medium term.
**Philosophical or Narrative View:**
BTC.D acts as a barometer of market risk preference. As confidence expands beyond Bitcoin, money flows into altcoins—like tributaries branching off the main river. The rejection from major confluences signals this psychological shift, marking phases of creative decentralization.
**Related Reference Charts:**
* TOTAL3 Fibonacci Setup (Altcoin market excluding BTC & ETH):
* TOTAL2 Correction Probabilities:
**Bias & Strategy Implication:**
* **Primary Bias:** Bearish rejection from 66% followed by correction to 52% and potentially 38.88%.
* **Alternative Scenario:** Brief breach above 66% before reversal.
* Traders may consider rotating into altcoin exposure if BTC.D confirms reversal at the confluence zone.
**Time Horizon:**
* Mid to Long Term (1–6 months outlook)
* Weekly timeframe tracking
**Notes & Disclaimers:**
* This analysis is for educational purposes. Market conditions may evolve rapidly.
* Use proper risk management when acting on dominance signals.

Biggest Altcoin Season of this Bull Cycle is Coming! As you can see, there is a Massive Ascending Broadening Wedge forming on the #Bitcoin Dominance!
Currently dominance is located almost near the top of the wedge. More likely we will see its ascend up to 67% which will be marked as top before the dump.
The breakdown of this wedge will signal a beginning of a HUGE Altcoin Season (comparable to Autumn of 2021 or Autumn of 2023) when not only small cap, but major altcoins will be sent to new highs. With high probability it will begin in August and will last till December this year.
Mark my words & be prepared for the last opportunity of this bull cycle!


Another reversal coming (Altcoins Market)A reversal at the blue box zone has already occurred. Now, we’re looking at a potential minor reversal, pay close attention between Tuesday and Wednesday. Why does this matter? Because the fastest and safest way to make money is to buy low and sell high.
I usually exit when it becomes highly overbought or reacts to key support and resistance (SnR) zones. Currently, I’m not holding any major positions, except for a few memecoins.
Once the price reaches the red box area, I’ll be loading up. This time, I’m choosing CRYPTOCAP:BNB and $APT.
Don’t ask me why, I just am.

WhEn ALTCOINS SEASON ?!
well according to the chart, the altcoins season might start very soon and if we start to see break under the green lines levels then this might ignite the altcoins season. first break under 63.73% level might gives us an early evidence to support the idea and break under 63.3% level might confirms the possible start of altcoins season, hopefully, and the more it dips it makes altcoins even rocketing to the top. on the other hand, going back above 64.34% might weakness or at least delay this idea.
good luck

Your Guide to Token Trends & Market Action – With My AnalysisHey everyone! Hope you're all enjoying a great weekend !
If you'd like a Token analysis , please drop your request in the comments using the format below:
Request Format :
Project Name: Bitcoin
Token Symbol: BTC
Please Note:
I’ll be analyzing up to 10 tokens only .
One request per person — make it count!
Your analysis will be posted directly as a reply to your comment .
If you find this helpful, don’t forget to ✅ Like ✅ and Share it with your friends.
Wishing you health, wealth, and massive success!

Market Pump, real or fake news?The pump is likely to begin again around the blue zone on May 19th. You might witness an unexpected surge in the #Altcoins market.
I hold(From Large to Small): CRYPTOCAP:SOL CRYPTOCAP:SUI CRYPTOCAP:ETH CRYPTOCAP:ADA CRYPTOCAP:XRP
Memecoins: $NAIIVE CA:0xB21b24F12c6125487a33fCF96aB06a5c74114444
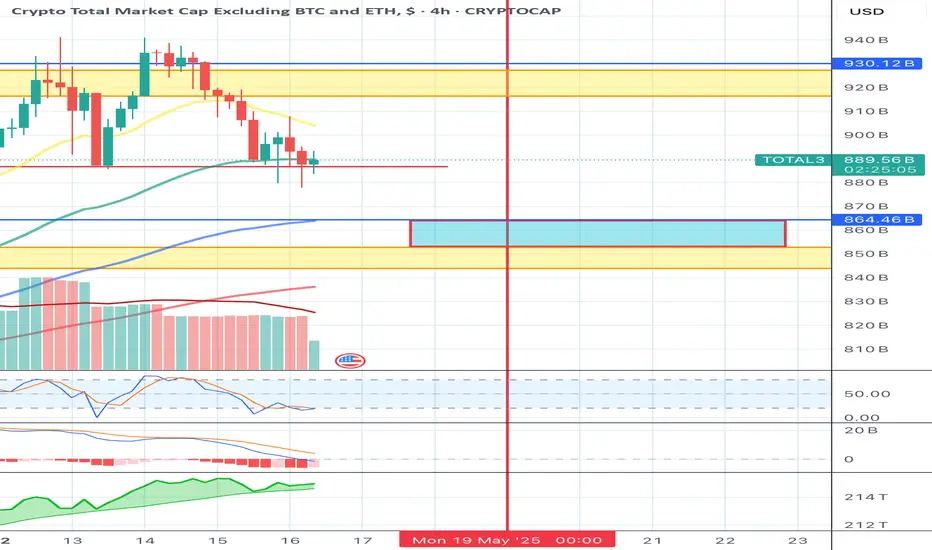
Altcoins Market Consolidation until 19th May 2025Total3 (Altcoins market cap) is currently consolidating between $900b-$930b expected until 19th May 2025 before the market continue to climb, just as I pointed out in last week’s analysis. No need to worry, #Altcoinseason is already here. A healthy correction is better than none.

The Altcoins Market Is Ready To Grow —Altcoins Season 2025The Altcoins market is ready to grow and here I have all the proof that you will ever need.
Good afternoon my fellow Cryptocurrency trader, how are you feeling today?
We know that the Cryptocurrency market is one; What one does, the rest follows.
We know that Bitcoin is the king of Crypto and when Bitcoin is bullish, the rest of the market also turns green. But Bitcoin being bullish isn't always all that is needed for marketwide bullish action. Bitcoin needs to be bullish but at a strong price, bullish confirmed. And that's exactly the situation we have today.
Today Bitcoin crossed easily and with a full green candle the $100,000 price barrier. Not only $100,000 but higher, $104,000 after trading as low as $96,800 today. With Bitcoin ultra-bullish, the Altcoins are set to follow and this chart—OTHERS.D—confirms not only the big Altcoins will follow but all Altcoins, the smaller ones as well.
Here is the best piece of news I can give you:
When Bitcoin grows 10%, the smaller Altcoins can grow between 50-100%.
When Bitcoin grows 30%, some of these Altcoins can grow up to 300%. Most of them can grow anywhere between 100 and 200%. This scenario is already present.
From Bitcoin's bottom around $74,500, it is already some odd 30% up. But, the smaller Altcoins do not start growing together with Bitcoin, only when Bitcoin becomes really strong. Bitcoin is really strong now so all the Altcoins grow.
When Bitcoin grows, say 50%, from $100,000 to $150,000, many of the OTHERS Altcoins will be growing between 300 and 500%.
When Bitcoin grows 80-100%, these Altcoins will be growing between 600% and 1,000%. So these pairs can be used to earn as profits in the same range as with a leveraged trade but without the liquidation risk.
So you can earn 5X, 6X or 10X on a small Altcoin, while Bitcoin produces its bullish wave.
Here the OTHERS.D index hit bottom yesterday and today is starting to grow. We have a full green candle and the action moving above support, the 7-April low.
The chart patterns, price dynamics and market conditions are pointing toward this index moving up. This moving up is the proof that the smaller Altcoins are set to grow strong. This means that these will grow faster than Bitcoin, Ethereum, Cardano, Solana, Dogecoin, XRP, BNB, Tron and all those in the TOP10. Don't get me wrong, everything will grow, but it is time for the Altcoins season.
Thanks a lot for your continued support.
Namaste.

Later, Bitcoin!Bitcoin remains in a long-term bullish trend, but it currently appears significantly overvalued relative to gold. The recent breakout, followed by a re-test of the upsloping wedge formation, suggests that bullish momentum may be waning. This could indicate that capital is beginning to rotate out of Bitcoin. As a result, it may be more prudent to revisit the market in one to two years ahead. This shift may also mark the beginning of a potential altcoin season.

Ripple rises again from $2 levelCRYPTOCAP:XRP - bulls attack triangle, focus on 2.30 → 2.48 USDT
Price has been holding above the ascending support since mid-March and has just popped out of a local falling wedge, keeping the chance of a breakout of the main downtrend line alive.
📌 Levels
- S1 2.10 USDT - dynamic support and bottom of the small wedge
- S2 2.00 USDT - round number and bottom of the broad pattern
- R1 2,30 USDT - crossing of the downtrend line (target #1)
- R2 2,48 USDT - horizontal “Resistance level”, potential reversal boundary
📈 Scenario
A consolidation above 2.30 will confirm the bullish exit from the triangle and open the way to 2.48 USDT. A breakout to 2.60 is possible if volume strengthens.
⚠️ Risks
A failure below 2.10 will bring the price back to the narrowing range; a move below 2.00 will increase sellers' pressure and target 1.90-1.85 USDT.

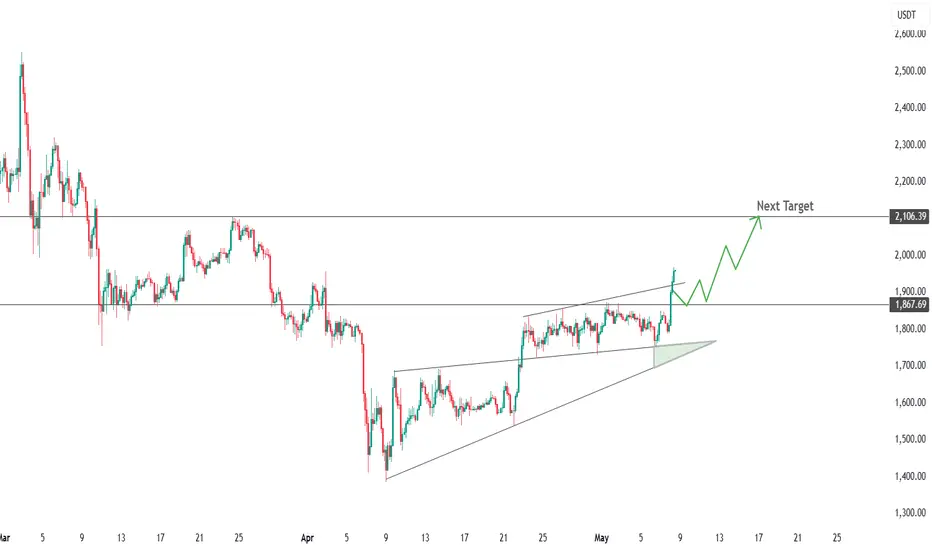
Broke the resistance levelCRYPTOCAP:ETH - wedge broken, target 2,100 USDT
After a three-week contraction, the price broke above the upper boundary of the ascending wedge and the 1,870 USDT horizontal, confirming a change of momentum in favor of the bulls.
📌 Levels
- S1 1 870 USDT - top of the wedge, retest zone
- S2 1,800-1,820 USDT - base of the formation
- R1 1 900-1 920 USDT - local obstacle near trend lines
- R2 2,106 USDT - calculated wedge height target and March supply area
📈 Scenario
Holding S1 opens the way to R1; a consolidation above 1,920 activates the march to 2,100 USDT. A run-up to 2,200 is not ruled out with strong volume.
⚠️ Risks
A failure ⇩ 1,870 would indicate a false breakout; a move below 1,800 would bring the price back to the wedge and increase the chance of a test of 1,740.
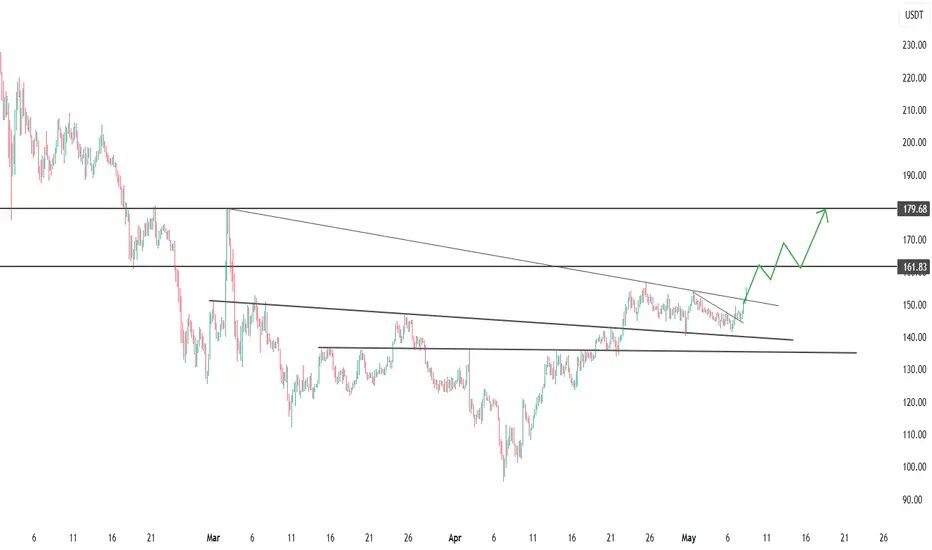
SOL broke through the resistance line near $150CRYPTOCAP:SOL - wedge broken, bulls take control
Price broke out of the descending wedge (140-150 → 150-162) and closed above 150 USDT on higher volume - a break of the medium-term trend.
📌 Levels
- S1 150 ± 3 - retest zone, S2 140 - April base.
- R1 161.8 - March resistance, R2 179-180 - wedge height and supply zone target.
📈 Scenario
A consolidation > 161.8 activates a move to 180; if successful, a push to 195 is possible.
⚠️ Risks
Failure < 147 will bring price back inside the wedge with a chance of 140.
As long as 147-150 holds, priority long.
Secret Plan For Altcoins RevealedHello, Skyrexians!
Bitcoin dominance probably topped yesterday and now started moving to 62% (hope so). At the same time I noticed that made a mistake in my recent CRYPTOCAP:OTHERS.D analysis and now I looked at this chart again and got that we can see that bull trap soon.
Let's take a look at the daily chart. On the first look it's very easy decision: just buy now or hold because we have 5 waves and bullish divergence and green dot on Bullish/Bearish Reversal Bar Indicator . But my intuition makes me scared because it can be just the wave 3 and bounce ahead will coincides with the drop to 62% on BTC dominance. I think now that wave 4 will reach approximately 9 or even 9.3%, these targets are very likely, but after that we need to make a difficult decision. Probably I will take profit on those part of altcoins which were bought after Feb 3 dump to have a free money on the shakeout. Dump below 6% will coincides with growth on BTC.D to 67%.
Best regards,
Ivan Skyrexio
___________________________________________________________
Please, boost this article and subscribe our page if you like analysis!

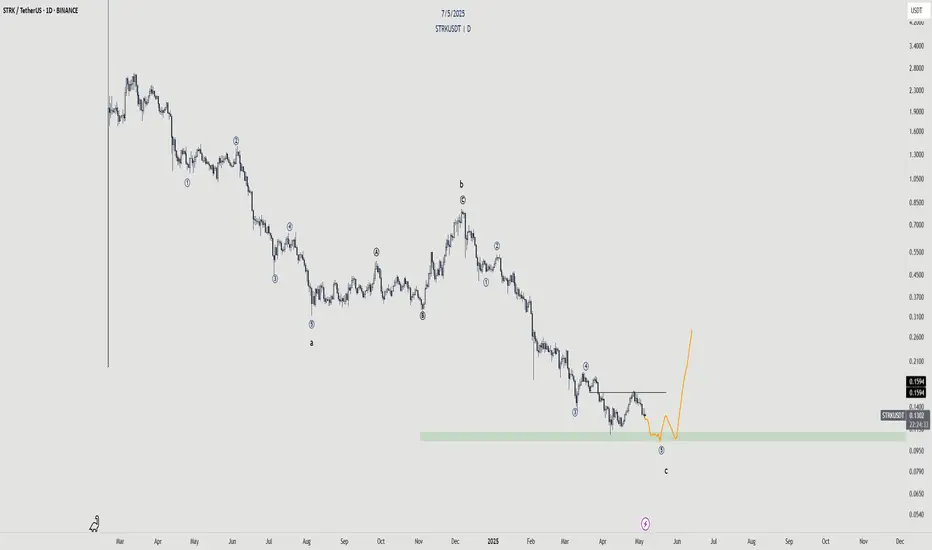
Starknet - Incoming Reversal?Starknet has been on a consistent downtrend. Its about time we finish this wave structure where we will see an impulse finish of Wave c.
Looking for the 5th wave to finish to sweep the low. However, the pullback seems very deep in that micro structure so its also likely we don't get that sweep. As long as we close below that wick from the green box and we can consider 5th wave to be done.
ALT COIN SEASON IS JUST WEEKS AWAY, HOPE YOU HAVE YOUR BAGS FULLHey Traders,
We’ve been watching this Bitcoin Dominance (BTC.D) chart closely — and it’s heating up again!
For those unfamiliar, BTC Dominance tracks the percentage of total crypto market cap that belongs to Bitcoin. When BTC.D rises, it typically means altcoins are underperforming compared to BTC — either due to their market caps falling, or BTC’s increasing. When it drops, altcoins are gaining ground.
While this chart won’t tell you whether markets go up or down, it’s critical for spotting where to diversify and when. It’s a must-have tool in your crypto trading utility belt.
⸻
Why This Chart Matters Now:
We’re nearing the top resistance trendline of a long-term triangle formation that dates all the way back to 2017. This line has rejected BTC.D multiple times in the past — and we’re back to test it again, hovering between 63% and 66% dominance.
Each of these rejections previously led to a drop in BTC Dominance — which triggered powerful altcoin seasons.
⸻
Key Bearish Signals:
• Bearish Divergence on the MACD
• MAJOR Bearish Divergence on the RSI
(Just like before previous alt seasons!)
• TOTAL2 (the white line representing all altcoins) looks poised to spike if history repeats.
Altseason Clue: When BTC.D forms bearish divergences on these indicators, it’s often followed by a surge in altcoin market cap — a key early signal we may be close to another one.
⸻
BUT… This Isn’t 2021 Anymore:
Let’s be real — the market has changed. Solana-based launchpads like Pump.fun and Jupiter DEX have revolutionized how easily tokens are created and traded. That’s new capital flow and speculative behavior we didn’t see last cycle.
Plus, the geopolitical landscape is shifting fast. With President Donald J. Trump calling for crypto regulation frameworks within 180 days, we may soon see an influx of institutional money — but it could come with strings attached.
⸻
Final Thoughts:
A breakdown in BTC.D could mean a major rotation into alts — but don’t bet the farm.
Markets could still dump. We may even skip altseason altogether this cycle.
However, this chart gives you a crucial edge — so use it wisely. Know your tools. Zoom out. Plan ahead.
As always — stay sharp, stay safe, and stay profitable out there.
— Savvy

HolderStat | Smart money is interested in BNB🚀 Wallet Snapshot:
● Recent moves: withdrew 26.62 BNB from Binance → Bitget & UniversalRouter; swapped 122.78 K KILO via PancakeSwap
● Top holdings: 17.962 CRYPTOCAP:ETH | 13.683 CRYPTOCAP:BNB | 122.781 K BYBIT:KILOUSDT
● Performance: $250 K+ net profit
Savvy rotation perfectly timed for this mark-up phase! 🔥

HolderStat | preparing for the May saleThis smart trader withdrew 2.965 CRYPTOCAP:ETH ~$4.9K to Crypto.com—proof this trader is primed to load up on alts. With a lifetime 1832% return over 9 trades this fresh deposit signals full force into the next altcoin rally 🌟
