Later, Bitcoin!Bitcoin remains in a long-term bullish trend, but it currently appears significantly overvalued relative to gold. The recent breakout, followed by a re-test of the upsloping wedge formation, suggests that bullish momentum may be waning. This could indicate that capital is beginning to rotate out of Bitcoin. As a result, it may be more prudent to revisit the market in one to two years ahead. This shift may also mark the beginning of a potential altcoin season.
Altcoinseason

Ripple rises again from $2 levelCRYPTOCAP:XRP - bulls attack triangle, focus on 2.30 → 2.48 USDT
Price has been holding above the ascending support since mid-March and has just popped out of a local falling wedge, keeping the chance of a breakout of the main downtrend line alive.
📌 Levels
- S1 2.10 USDT - dynamic support and bottom of the small wedge
- S2 2.00 USDT - round number and bottom of the broad pattern
- R1 2,30 USDT - crossing of the downtrend line (target #1)
- R2 2,48 USDT - horizontal “Resistance level”, potential reversal boundary
📈 Scenario
A consolidation above 2.30 will confirm the bullish exit from the triangle and open the way to 2.48 USDT. A breakout to 2.60 is possible if volume strengthens.
⚠️ Risks
A failure below 2.10 will bring the price back to the narrowing range; a move below 2.00 will increase sellers' pressure and target 1.90-1.85 USDT.

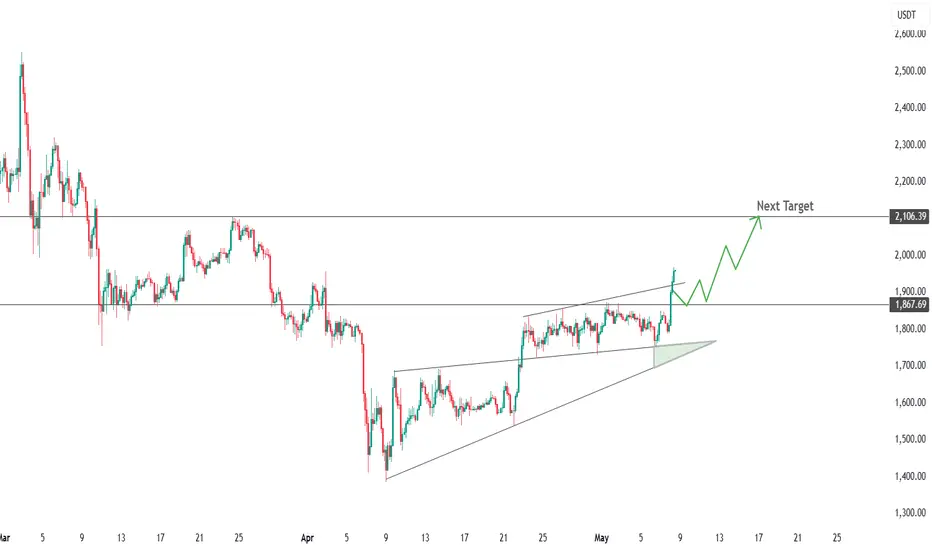
Broke the resistance levelCRYPTOCAP:ETH - wedge broken, target 2,100 USDT
After a three-week contraction, the price broke above the upper boundary of the ascending wedge and the 1,870 USDT horizontal, confirming a change of momentum in favor of the bulls.
📌 Levels
- S1 1 870 USDT - top of the wedge, retest zone
- S2 1,800-1,820 USDT - base of the formation
- R1 1 900-1 920 USDT - local obstacle near trend lines
- R2 2,106 USDT - calculated wedge height target and March supply area
📈 Scenario
Holding S1 opens the way to R1; a consolidation above 1,920 activates the march to 2,100 USDT. A run-up to 2,200 is not ruled out with strong volume.
⚠️ Risks
A failure ⇩ 1,870 would indicate a false breakout; a move below 1,800 would bring the price back to the wedge and increase the chance of a test of 1,740.
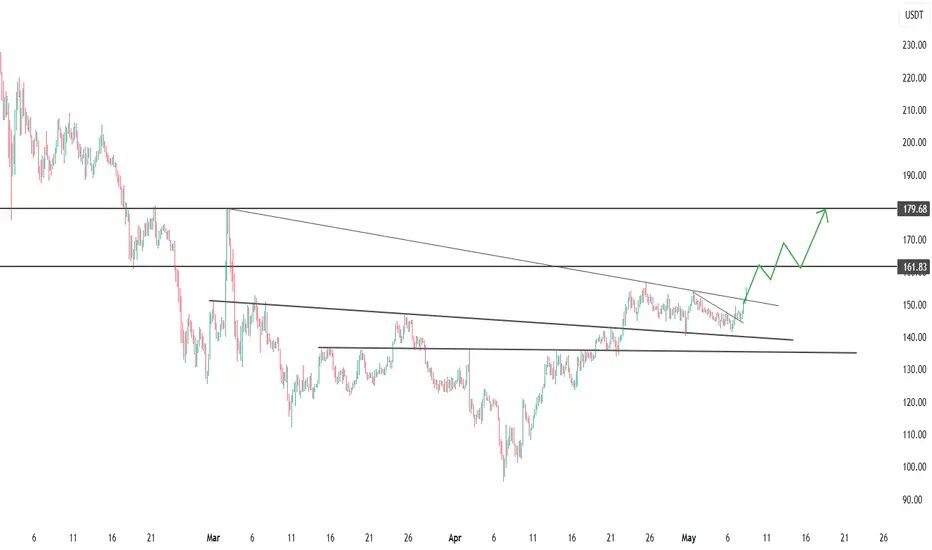
SOL broke through the resistance line near $150CRYPTOCAP:SOL - wedge broken, bulls take control
Price broke out of the descending wedge (140-150 → 150-162) and closed above 150 USDT on higher volume - a break of the medium-term trend.
📌 Levels
- S1 150 ± 3 - retest zone, S2 140 - April base.
- R1 161.8 - March resistance, R2 179-180 - wedge height and supply zone target.
📈 Scenario
A consolidation > 161.8 activates a move to 180; if successful, a push to 195 is possible.
⚠️ Risks
Failure < 147 will bring price back inside the wedge with a chance of 140.
As long as 147-150 holds, priority long.
Secret Plan For Altcoins RevealedHello, Skyrexians!
Bitcoin dominance probably topped yesterday and now started moving to 62% (hope so). At the same time I noticed that made a mistake in my recent CRYPTOCAP:OTHERS.D analysis and now I looked at this chart again and got that we can see that bull trap soon.
Let's take a look at the daily chart. On the first look it's very easy decision: just buy now or hold because we have 5 waves and bullish divergence and green dot on Bullish/Bearish Reversal Bar Indicator . But my intuition makes me scared because it can be just the wave 3 and bounce ahead will coincides with the drop to 62% on BTC dominance. I think now that wave 4 will reach approximately 9 or even 9.3%, these targets are very likely, but after that we need to make a difficult decision. Probably I will take profit on those part of altcoins which were bought after Feb 3 dump to have a free money on the shakeout. Dump below 6% will coincides with growth on BTC.D to 67%.
Best regards,
Ivan Skyrexio
___________________________________________________________
Please, boost this article and subscribe our page if you like analysis!

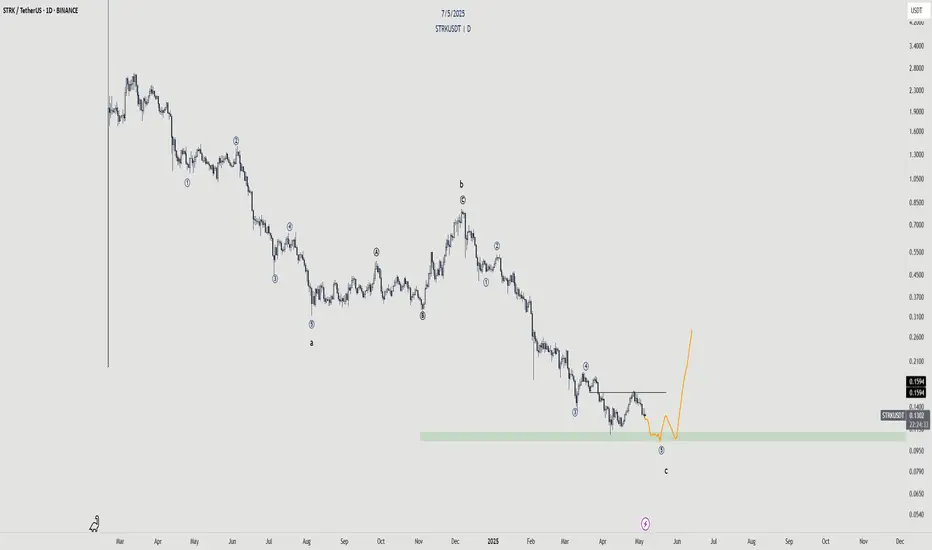
Starknet - Incoming Reversal?Starknet has been on a consistent downtrend. Its about time we finish this wave structure where we will see an impulse finish of Wave c.
Looking for the 5th wave to finish to sweep the low. However, the pullback seems very deep in that micro structure so its also likely we don't get that sweep. As long as we close below that wick from the green box and we can consider 5th wave to be done.
ALT COIN SEASON IS JUST WEEKS AWAY, HOPE YOU HAVE YOUR BAGS FULLHey Traders,
We’ve been watching this Bitcoin Dominance (BTC.D) chart closely — and it’s heating up again!
For those unfamiliar, BTC Dominance tracks the percentage of total crypto market cap that belongs to Bitcoin. When BTC.D rises, it typically means altcoins are underperforming compared to BTC — either due to their market caps falling, or BTC’s increasing. When it drops, altcoins are gaining ground.
While this chart won’t tell you whether markets go up or down, it’s critical for spotting where to diversify and when. It’s a must-have tool in your crypto trading utility belt.
⸻
Why This Chart Matters Now:
We’re nearing the top resistance trendline of a long-term triangle formation that dates all the way back to 2017. This line has rejected BTC.D multiple times in the past — and we’re back to test it again, hovering between 63% and 66% dominance.
Each of these rejections previously led to a drop in BTC Dominance — which triggered powerful altcoin seasons.
⸻
Key Bearish Signals:
• Bearish Divergence on the MACD
• MAJOR Bearish Divergence on the RSI
(Just like before previous alt seasons!)
• TOTAL2 (the white line representing all altcoins) looks poised to spike if history repeats.
Altseason Clue: When BTC.D forms bearish divergences on these indicators, it’s often followed by a surge in altcoin market cap — a key early signal we may be close to another one.
⸻
BUT… This Isn’t 2021 Anymore:
Let’s be real — the market has changed. Solana-based launchpads like Pump.fun and Jupiter DEX have revolutionized how easily tokens are created and traded. That’s new capital flow and speculative behavior we didn’t see last cycle.
Plus, the geopolitical landscape is shifting fast. With President Donald J. Trump calling for crypto regulation frameworks within 180 days, we may soon see an influx of institutional money — but it could come with strings attached.
⸻
Final Thoughts:
A breakdown in BTC.D could mean a major rotation into alts — but don’t bet the farm.
Markets could still dump. We may even skip altseason altogether this cycle.
However, this chart gives you a crucial edge — so use it wisely. Know your tools. Zoom out. Plan ahead.
As always — stay sharp, stay safe, and stay profitable out there.
— Savvy

HolderStat | Smart money is interested in BNB🚀 Wallet Snapshot:
● Recent moves: withdrew 26.62 BNB from Binance → Bitget & UniversalRouter; swapped 122.78 K KILO via PancakeSwap
● Top holdings: 17.962 CRYPTOCAP:ETH | 13.683 CRYPTOCAP:BNB | 122.781 K BYBIT:KILOUSDT
● Performance: $250 K+ net profit
Savvy rotation perfectly timed for this mark-up phase! 🔥

HolderStat | preparing for the May saleThis smart trader withdrew 2.965 CRYPTOCAP:ETH ~$4.9K to Crypto.com—proof this trader is primed to load up on alts. With a lifetime 1832% return over 9 trades this fresh deposit signals full force into the next altcoin rally 🌟

HolderStat | What Tokens does a Successful Trader BuyThe trader owns ~$48.9K 💵
23 hours ago, he exchanged $10K USDC for ~$69K MEXC:DSYNCUSDT , increasing his position to ~138K tokens.
Top Holdings:
● $30K USDC as a reserve for purchases.
● ~138K MEXC:DSYNCUSDT with an average price of $0.14
Smart rotation at this stage of growth! 🔥

Altcoins Market Cap: We on the Verge of a 5T Exposion!Hey crypto traders! Let’s dive into this monthly chart of the Altcoins Market Cap. You won’t believe what’s brewing!
We’re currently approaching a critical channel support at 200B, a level that might act as a springboard for massive rally — check out the jumps from channel support in 2019 and 2023! Each time the market cap hit this support, it skyrocketed, and now we’re at that pivotal moment again.
The chart projects a jaw-dropping target of $5T within the next 24 months if history repeats itself!
The price action shows we’re testing the lower boundary of this ascending channel, with the market cap sitting around 239.65B. A bounce here could send altcoins on a parabolic run, potentially hitting 5T by mid-2026. But if support fails, we might see a dip toward 100B — let’s keep an eye out!
Key Levels to Watch:
Support: 175B (channel support)
Resistance: 1.55T, 5T (projected target)
Breakdown Risk: 100B
Are altcoins about to explode to 5T, or will we see a deeper correction? Drop your thoughts below!
PS take a look at others vs. btc price action here:

Breaking: Virtual Protocol ($VIRTUAL) Spike 29% Today Built on the Ethereum chain, Virtual protocol's native token ( SPARKS:VIRTUAL ) saw a noteworthy uptick of 29% today albeit the crypto market growth was modest today.
With the RSI at 75 and momentum growing, SPARKS:VIRTUAL seems poised to break the pass the $1.60 resistant zone and reclaim the $1 Billion market cap eventually.
On a bearish tone, failure to break pass the 1-month high pivot could resort to a consolidatory move to the 38.2% Fibonnaci retracement point a level technically seen as the support point.
What is Virtuals Protocol?
Virtuals Protocol (VIRTUAL) is an innovative cryptocurrency that aims to revolutionize virtual interactions through its AI and Metaverse protocol. Serving as the infrastructure layer for co-owned, human-curated, plug-and-play gaming AIs, Virtuals Protocol is at the forefront of integrating artificial intelligence with immersive virtual environments.
Virtuals Protocol Price Data
The Virtuals Protocol price today is $1.36 USD with a 24-hour trading volume of $410,193,840 USD. Virtuals Protocol is up 32% in the last 24 hours. The current CoinMarketCap ranking is #73, with a market cap of $886,828,030 USD. It has a circulating supply of 652,196,092 VIRTUAL coins and a max. supply of 1,000,000,000 VIRTUAL coins.

OTHERS/BTCUSD: The Ultimate Indicator for Altcoin SeasonsHey TradingView community! I’ve been analyzing the OTHERS/BTCUSD metric, and it’s painting an exciting picture for altcoin traders. This chart might just be the key to timing the next big altcoin rally — let’s break it down!
What is OTHERS/BTCUSD?
This metric calculates the total altcoin market cap (excluding Bitcoin) divided by BTC/USD. It shows how altcoins perform relative to Bitcoin.
High Metric : Altcoins are outperforming Bitcoin — think altcoin season!
Low Metric : Bitcoin dominance takes over, and altcoins take a backseat.
Historical Patterns: Falling Wedges Stealing the Show
The OTHERS/BTC Weekly chart reveals three Falling Wedge patterns, a bullish setup that’s historically preceded massive altcoin bull runs:
1st Altseason (2017-2018) : A Falling Wedge formed in 2016 (prior pink zone). The breakout unleashed a legendary altcoin rally — remember Ethereum and Ripple going parabolic?!
2nd Altseason (2020-2022) : Another wedge in 2018-2019 (blue zone) led to the 2021 altcoin boom, with projects like Solana and DeFi tokens soaring as the metric hit 10M.
3rd Falling Wedge (2022-Now) : Since 2022, a new wedge is forming (green zone), resurfacing the setups that sparked the last two altseasons.
Current Setup: A Critical Support Zone
As of April 27, 2025, the metric is approaching a key support zone of 2M-1.5M (where the altcoin market cap equals 1.5M to 2M Bitcoins).
Historical Significance : This level has been a launchpad in the past — both in 2016 and 2019, it marked the bottom before altcoins reversed and surged.
What’s Next : If this wedge breaks out, the metric could climb to 7M, 9M, or even 11.5M by 2025-2027. That could mean 5-10x gains from bottom for altcoins, depending on the pair!
A sinusoidal wave at the bottom of the chart — it reflect market sentiment cycles, with troughs (like now) often preceding altcoin season greed phases.
Why This Metric Matters
OTHERS/BTCUSD captures the flow of capital in crypto:
Bitcoin often leads bull cycles, pulling in capital first (metric drops).
When BTC’s rally cools, investors chase higher returns in altcoins (metric rises).
The Falling Wedges highlight this cycle — consolidation during Bitcoin dominance, followed by breakouts when altcoins take the spotlight.
Trading Takeaway
Monitor the 2M-1.5M Zone : A breakout here could be your green light to stack altcoins.
Cross-Check Bitcoin Dominance : A drop in BTC.D (Bitcoin Dominance) would confirm capital flowing into altcoins.
Pick Strong Projects : Look for altcoins with solid fundamentals — layer-1s, DeFi, or AI tokens could lead the charge.
What’s your take, TradingView fam? Are you gearing up for the next altseason?
Drop your favorite altcoin picks or charts in the comments — I’d love to hear your thoughts!

CHZ 50x plus tradeTraders,
Here we are again pointing out an amazing trade idea for you, the solicitors 👧🏿 and dealers 🙍🏿♂️who will likely end up transacting all of your winnings with! CHZ a great wagering project that will make you a killing this run. This one is cut and dry, we have a wedge pattern along with a possible flag that will likely play our by the end of this year!
We hope you enjoy the free trades that we have been sharing from the VIP group and look forward to seeing you enjoy these gains year round if you come check us out!
As always, stay profitable folks!
Savvy!

WELCOME TO THE BEGINNING OF ALT COIN SEASON!Traders, Hodlr's and Soon to be Liquidity (late retail buyers),
This is likely the moment we have been waiting for. Last week in our weekly VIP market update we discussed just a few things that would really show us if we just saw the bottom of the alts and if it was now time to start seeing some new local HH's and then HL's showing us a shift in trend. I had posted a few trades pointing this out. We have now at this point accomplished what we were looking for to see if we would be starting Alt coins season.
We have been watching a few things. The first being Bitcoin Dominance or CRYPTOCAP:BTC.D as this is a great chart to watch and look for reversals prior to looking at the chart of the specific alt coin against BTC to see if it also is showing it could have a rally or a pullback based on your bias on this BTC.D chart. For instance if I were to want to see maybe when XRP would likely start breaking out say that this BTC.D chart is in fact correct and the triangle trend line will end up being the top for btc dominance at around 64.4% of the total market I would go to BITSTAMP:XRPBTC to give myself some insight on confluence of market movements.
Being that we are now here at the point that I believe we will start to see money flow into alts based on this chart and others such as CRYPTOCAP:TOTAL2 , CRYPTOCAP:TOTAL3 and CRYPTOCAP:TOTALDEFI and the specific BTC pairings that I am holding by looking up the ticker of my alt coin/BTC and studying that chart I will honestly say that I am in the 90%/10% bullish on alts to bearish.
I hope this information helped you in your journey to get more information and come up with your own analysis to base your investment decisions and you become prosperous for doing soo!
Stay Profitable Folks,
Savvy!

UMA Trendline Shattered! What’s Next for Bulls?BINANCE:UMAUSDT has broken above the key trendline resistance and is now testing a minor resistance zone.
If a candle closes decisively above this marked zone, we could see a parabolic upside move in the coming sessions.
This breakout structure, paired with strong momentum, makes it a setup worth watching closely.
DYOR, NFA

Altcoin Market Update – April 24, 2025As of today, the TOTAL3 Index (excluding BTC & ETH) offers key insights into the altcoin market:
⸻
Technical Overview:
• 1D: -1.54% → Minor pullback
• 1W: +6.37% → Bullish momentum
• 1M: -4.14% → Mid-term correction
• 6M: +32.94% → Strong growth
#TOTAL3 remains above $790B, a critical support. Holding this level is vital for future altcoin rally targets like $1.16T and beyond.
Bullish divergence on the TOTAL3/BTC chart hints at altcoins gaining strength over BTC.
⸻
Fundamentals:
• The global crypto market cap is $3.03T
• BTC & ETH dominate, but TOTAL3 reflects altcoin potential
⸻
Summary:
Altcoin market remains optimistic, with solid long-term signals. Keep an eye on support zones and momentum indicators for your trading strategy.

$HBAR Near Key Resistance: Will the Bull Flag Explode?CRYPTOCAP:HBAR is trading within a bull flag on the 2-day chart, holding just below a key resistance zone that was previously support. The 100 EMA is also acting as a dynamic barrier here.
A breakout above $0.188 with strong volume could trigger the next bullish leg.
But if resistance holds, a short-term pullback might follow.
DYOR, NFA

Beautiful TA played out. That was initiation for many Alt LONGsLook at this TA from 2 days ago, then you will understand my Alt LONGs.
Despite BTC D. made higher highs, but Alts moved up too.
7.5 % till now🎯 👌 😎
In Update, I will paste the Alts LONGs ;).
Original TA from 2 days ago:
Follow for more ideas/Signals.💲
Just donate some of your profit to Animal rights or other charity :)✌️

SEI Trend Reversal? Breakout + Higher Low ConfirmedNYSE:SEI has broken above the key descending resistance line, signaling a shift in momentum after an extended downtrend. The price also rebounded strongly from the support zone marked in the chart, forming a clear higher low.
Currently, SEI is pushing through a critical zone where support previously flipped into resistance, now testing the 50 EM as the next challenge.
If the price can hold above this zone and close with strength, the next leg up could target $0.30–$0.50, as shown on the chart.
DYOR, NFA

Reversal Pattern in Play – Will AVAX Flip Bullish?CRYPTOCAP:AVAX is showing signs of a potential reversal after forming a double bottom near the $17 zone. It’s currently testing a key resistance trendline along with a minor horizontal resistance around $19.50–$20.50.
A successful breakout and close above this zone could trigger bullish momentum toward $22+. However, rejection here may lead to another dip back toward support.
Price action is tightening, so a decisive move is likely soon.
DYOR, NFA

BTC.D Wave 5 is formingWe are now in the final wave of the btc.d market share
The black V wave is in the final stage
In my opinion, btc.d is in the red wave 4 and is expected to have another red uptrend to complete 5 waves and at the same time, it will also have 5 black V waves
If all the waves are complete, we will have a btc.d break and the altcoin season will take place
We can see that altcoin is at the bottom and is recovering, this uptrend is likely to increase (because btc.d is decreasing wave 4) then btc.d goes up to the red wave 5 as analyzed above, the altcoin will test the possible double bottom pattern (with some strong coins that can slightly recover to the 50% fibonacci and then go up)
to go up, the weaker ones can have triple bottoms
Anyway, we are at the end of btc.d and it is also the altcoin season that is about to begin

$OTHERS is the correction over? All is in the Chart!Check the yellow arrows and lines— CRYPTOCAP:OTHERS (all altcoins excluding the top 10) is following a correction pattern similar to CRYPTOCAP:BTC and the $SPX500.
📉 On the 1W timeframe, the MACD is overbought and currently in the middle of a correction. This typically signals a bounce in the coming weeks.
🕰️ If we compare this to the previous cycle, it appears we're at the early stage of what could become an altseason. Back then, it took around 10 weeks after this point to see the real breakout.
🗓️ Based on that, I forecast:
May: first major pump
July–August: consolidation
September–October: final leg up
Despite recent announcements from Trump, the 1W chart has not significantly changed—everything is progressing as expected.
📊 You can verify this macro alignment with my other analyses:
🔗 SPX500 (trendline shows bottom around Sept 2025 at 4700):
🔗 CRYPTOCAP:TOTAL (crypto market macro view):
🔗 CRYPTOCAP:BTC (warning posted on Feb 5, 2025):
📈 Everything is aligning—traditional markets, Bitcoin, and altcoins.
