Bitcoin -> Massive Back And ForthHello Traders and Investors ,
my name is Philip and today I will provide a free and educational multi-timeframe technical analysis of Bitcoin 💪
A couple of months ago Bitcoin perfectly retested and already rejected the previous cycle high from 2018 and also the 0.786 fibonacci level so the recent rally was quite expected.
Furthermore you can also see that weekly market structure is bullish with Bitcoin creating higher highs and higher lows so there is no reason why Bitcoin should actually reject the previous resistance zone once again towards the downside.
Looking at the daily timeframe you can see that Bitcoin is still stuck in between support and resistance so I am now just waiting for a clear breakout towards the upside before I also then favor another bullish continuation setup.
Keep in mind: Don't get caught up in short term moves and always look at the long term picture; building wealth is a marathon and not a quick sprint 📈
Thank you for watching and I will see you tomorrow!
My previous analysis of this asset:
Altcoinseason

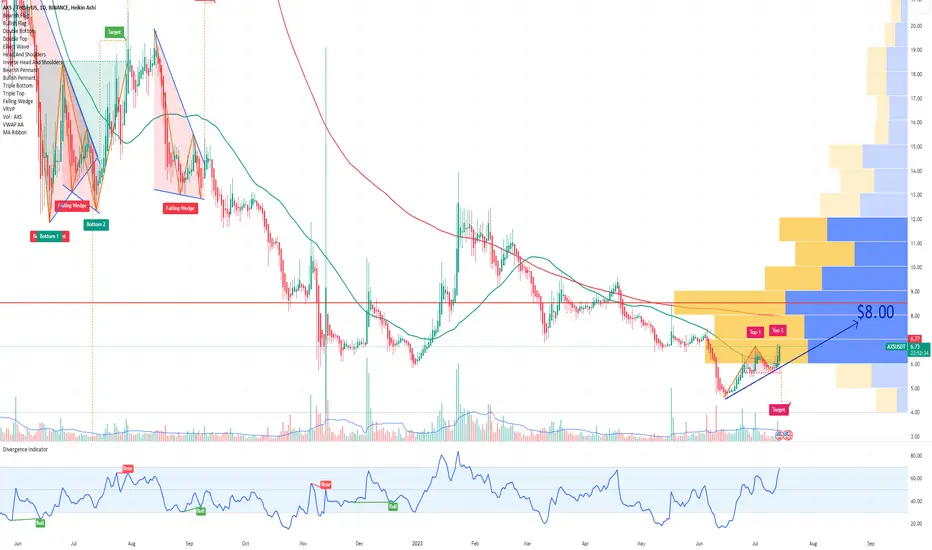
AXS Axie Infinity and the Altcoin Season ThesisIf you haven`t sold the speculative bubble:
Then you should know that the recent developments in the cryptocurrency market, particularly the favorable court ruling for Ripple Labs, signal an optimistic start to a new altcoin season.
With the federal judge ruling that some of Ripple's sales of the XRP token do not fully meet the definition of a securities offering, it instills confidence in the altcoin space.
This ruling brings clarity to the regulatory landscape and alleviates concerns surrounding XRP, leading to major cryptocurrency exchanges, including Coinbase, relisting the token. The reintroduction of XRP to these platforms demonstrates growing acceptance and renewed interest in this altcoin.
The anticipation surrounding the approval of a spot bitcoin ETF in the United States adds to the positive sentiment in the market.
The successful launch of a previously approved ETF in Europe further reinforces the upward trend for altcoins.
The recent court ruling that declared XRP as not a security sets a precedent that could potentially benefit other cryptocurrencies currently classified as securities by the SEC. In the SEC's case against Binance, they designated 10 cryptocurrencies, including BNB, BUSD, SOL, ADA, MATIC, ATOM, SAND, MANA, AXS, and COTI, as securities.
Additionally, in the SEC's lawsuit against Coinbase, they named 13 cryptocurrencies, reinforcing their stance on SOL, ADA, MATIC, SAND, and AXS, and adding CHZ, FLOW, ICP, NEAR, VGX, and NEXO to the list.
This development showcases the increasing institutional acceptance of cryptocurrencies and creates a ripple effect across the market, providing a boost for various altcoins, including AXS Axie Infinity, for which my price target is $8.00.
Looking forward to read your opinion about it!
MANA Decentraland and the Altcoin Season ThesisIf you haven`t sold MANA here:
Then you should know that the recent developments in the cryptocurrency market, particularly the favorable court ruling for Ripple Labs, signal an optimistic start to a new altcoin season.
With the federal judge ruling that some of Ripple's sales of the XRP token do not fully meet the definition of a securities offering, it instills confidence in the altcoin space.
This ruling brings clarity to the regulatory landscape and alleviates concerns surrounding XRP, leading to major cryptocurrency exchanges, including Coinbase, relisting the token. The reintroduction of XRP to these platforms demonstrates growing acceptance and renewed interest in this altcoin.
The anticipation surrounding the approval of a spot bitcoin ETF in the United States adds to the positive sentiment in the market.
The successful launch of a previously approved ETF in Europe further reinforces the upward trend for altcoins.
The recent court ruling that declared XRP as not a security sets a precedent that could potentially benefit other cryptocurrencies currently classified as securities by the SEC. In the SEC's case against Binance, they designated 10 cryptocurrencies, including BNB, BUSD, SOL, ADA, MATIC, ATOM, SAND, MANA, AXS, and COTI, as securities.
Additionally, in the SEC's lawsuit against Coinbase, they named 13 cryptocurrencies, reinforcing their stance on SOL, ADA, MATIC, SAND, and AXS, and adding CHZ, FLOW, ICP, NEAR, VGX, and NEXO to the list.
This development showcases the increasing institutional acceptance of cryptocurrencies and creates a ripple effect across the market, providing a boost for various altcoins, including MANA Decentraland, for which my price target is $0.50.
Looking forward to read your opinion about it!

SAND Sandbox and the Altcoin Season ThesisIf you haven`t sold SAND here:
or bought it back here:
Then the recent developments in the cryptocurrency market, particularly the favorable court ruling for Ripple Labs, signal an optimistic start to a new altcoin season.
With the federal judge ruling that some of Ripple's sales of the XRP token do not fully meet the definition of a securities offering, it instills confidence in the altcoin space.
This ruling brings clarity to the regulatory landscape and alleviates concerns surrounding XRP, leading to major cryptocurrency exchanges, including Coinbase, relisting the token. The reintroduction of XRP to these platforms demonstrates growing acceptance and renewed interest in this altcoin.
The anticipation surrounding the approval of a spot bitcoin ETF in the United States adds to the positive sentiment in the market.
The successful launch of a previously approved ETF in Europe further reinforces the upward trend for altcoins.
The recent court ruling that declared XRP as not a security sets a precedent that could potentially benefit other cryptocurrencies currently classified as securities by the SEC. In the SEC's case against Binance, they designated 10 cryptocurrencies, including BNB, BUSD, SOL, ADA, MATIC, ATOM, SAND, MANA, AXS, and COTI, as securities.
Additionally, in the SEC's lawsuit against Coinbase, they named 13 cryptocurrencies, reinforcing their stance on SOL, ADA, MATIC, SAND, and AXS, and adding CHZ, FLOW, ICP, NEAR, VGX, and NEXO to the list.
This development showcases the increasing institutional acceptance of cryptocurrencies and creates a ripple effect across the market, providing a boost for various altcoins, including SAND Sandbox, for which my price target is $0.60.
Looking forward to read your opinion about it!

ATOM Cosmos and the Altcoin Season ThesisThe recent developments in the cryptocurrency market, particularly the favorable court ruling for Ripple Labs, signal an optimistic start to a new altcoin season.
With the federal judge ruling that some of Ripple's sales of the XRP token do not fully meet the definition of a securities offering, it instills confidence in the altcoin space.
This ruling brings clarity to the regulatory landscape and alleviates concerns surrounding XRP, leading to major cryptocurrency exchanges, including Coinbase, relisting the token. The reintroduction of XRP to these platforms demonstrates growing acceptance and renewed interest in this altcoin.
The anticipation surrounding the approval of a spot bitcoin ETF in the United States adds to the positive sentiment in the market.
The successful launch of a previously approved ETF in Europe further reinforces the upward trend for altcoins.
The recent court ruling that declared XRP as not a security sets a precedent that could potentially benefit other cryptocurrencies currently classified as securities by the SEC. In the SEC's case against Binance, they designated 10 cryptocurrencies, including BNB, BUSD, SOL, ADA, MATIC, ATOM, SAND, MANA, AXS, and COTI, as securities.
Additionally, in the SEC's lawsuit against Coinbase, they named 13 cryptocurrencies, reinforcing their stance on SOL, ADA, MATIC, SAND, and AXS, and adding CHZ, FLOW, ICP, NEAR, VGX, and NEXO to the list.
This development showcases the increasing institutional acceptance of cryptocurrencies and creates a ripple effect across the market, providing a boost for various altcoins, including ATOM Cosmos, for which my price target is $11.15.
Looking forward to read your opinion about it!

MATIC Polygon and the Altcoin Season ThesisIf you haven`t sold MATIC here:
Then the recent developments in the cryptocurrency market, particularly the favorable court ruling for Ripple Labs, signal an optimistic start to a new altcoin season.
With the federal judge ruling that some of Ripple's sales of the XRP token do not fully meet the definition of a securities offering, it instills confidence in the altcoin space.
This ruling brings clarity to the regulatory landscape and alleviates concerns surrounding XRP, leading to major cryptocurrency exchanges, including Coinbase, relisting the token. The reintroduction of XRP to these platforms demonstrates growing acceptance and renewed interest in this altcoin.
The anticipation surrounding the approval of a spot bitcoin ETF in the United States adds to the positive sentiment in the market.
The successful launch of a previously approved ETF in Europe further reinforces the upward trend for altcoins.
The recent court ruling that declared XRP as not a security sets a precedent that could potentially benefit other cryptocurrencies currently classified as securities by the SEC. In the SEC's case against Binance, they designated 10 cryptocurrencies, including BNB, BUSD, SOL, ADA, MATIC, ATOM, SAND, MANA, AXS, and COTI, as securities.
Additionally, in the SEC's lawsuit against Coinbase, they named 13 cryptocurrencies, reinforcing their stance on SOL, ADA, MATIC, SAND, and AXS, and adding CHZ, FLOW, ICP, NEAR, VGX, and NEXO to the list.
This development showcases the increasing institutional acceptance of cryptocurrencies and creates a ripple effect across the market, providing a boost for various altcoins, including MATIC Polygon, for which my price target is $0.95.
Looking forward to read your opinion about it!

ADA Cardano and the Altcoin Season ThesisIf you haven`t sold ADA here:
Then the recent developments in the cryptocurrency market, particularly the favorable court ruling for Ripple Labs, signal an optimistic start to a new altcoin season.
With the federal judge ruling that some of Ripple's sales of the XRP token do not fully meet the definition of a securities offering, it instills confidence in the altcoin space.
This ruling brings clarity to the regulatory landscape and alleviates concerns surrounding XRP, leading to major cryptocurrency exchanges, including Coinbase, relisting the token. The reintroduction of XRP to these platforms demonstrates growing acceptance and renewed interest in this altcoin.
The anticipation surrounding the approval of a spot bitcoin ETF in the United States adds to the positive sentiment in the market.
The successful launch of a previously approved ETF in Europe further reinforces the upward trend for altcoins.
The recent court ruling that declared XRP as not a security sets a precedent that could potentially benefit other cryptocurrencies currently classified as securities by the SEC. In the SEC's case against Binance, they designated 10 cryptocurrencies, including BNB, BUSD, SOL, ADA, MATIC, ATOM, SAND, MANA, AXS, and COTI, as securities.
Additionally, in the SEC's lawsuit against Coinbase, they named 13 cryptocurrencies, reinforcing their stance on SOL, ADA, MATIC, SAND, and AXS, and adding CHZ, FLOW, ICP, NEAR, VGX, and NEXO to the list.
This development showcases the increasing institutional acceptance of cryptocurrencies and creates a ripple effect across the market, providing a boost for various altcoins, including ADA Cardano, for which my price target is $0.45.
Looking forward to read your opinion about it!

ALT-SEASON or NOT ? ALT-SEASON or NOT ? So how do we understand this? Altseason
To understand this, I checked the whole market by doing very detailed study. I share the charts that I find important on the subject.
The most important charts are:
1-) Btc Dominance
2-)Eth/btc
3-)Eth/usd
4-) Total2, Total3 marketcap
5-)Others dominance
6-)Others marketcap
7-)BTC/USD
8-)XRP/BTC
9-)LTC/BTC
I recommend you to check all charts to fully understand. And thank you
1-) Btc Dominance
First one, btc dom. I dont except impossible levels like 60-70. Looks like we have come to end of the road 🗡 ready >>>waterfall
2-)Eth/btc
The rise of ETH means the rise of altcoins. Strong Eth= strong altcoins
ETH/BTC Most important chart imo. We have to save green line !
3-) ETH/USD
ETH/USD
4-) Total2 marketcap/ exclude btc
Total3 marketcap/ exclude btc and eth
5-)Others marketcap 1w
6-) Others Dominance 1w
7-) BTC(USD
8-) XRP/BTC
9-)LTC/BTC
Conclusion : I think the real rise of altcoins will be in 2024. This does not mean that we will not see any increase in 2023. But my main strategy is to collect in 2023 and sell at the end of 2024.
These charts are more meaningful when they come together and form a whole.

BTCShowing a clear break of major support and resistance. Take out the highs of $31,000 and we likely going straight rocket to $40K

BITCOIN dominance update best time to buy altcoins when btc domiance is above 55%.
Hello Traders, here is the full analysis for this pair, let me know in the comment section below if you have any questions, the entry will be taken only if all rules of the strategies will be satisfied. I suggest you keep this pair on your watchlist and see if the rules of your strategy are satisfied. Please also refer to the Important Risk Notice linked below.
best time to buy altcoins when btc domiance is above 55%

How to invest in altcoins if you are a beginner?Altseason is the moment when the big players have taken profits from bitcoin and now the capital is flowing from bitcoin to altcoins! You must understand that not all altcoins will be profitable in the same way!
No need to focus on specific dates and try to predict the future. Your task is to adapt to the market order flow.
The first wave of momentum is buying with big capital! No one here believes in growth yet!
The last wave will be the shortest since it will already be a period of greed with a great news background so that even the latest skeptic would believe that he will become a millionaire thanks to cryptocurrency! It will be time to exit the market
When is the alt season?
Phase 1: Bitcoin
Cash flows are directed to the main cryptocurrency Bitcoin
Phase crossing | Ethereum is starting to fill up with smart money capital. The second cryptocurrency is rapidly trying to catch up and overtake Bitcoin. Ultimately, the growth of Ethereum is much more intense.
Phase 2: Ethereum
Ethereum outperforms Bitcoin. Gradually, the hype begins to rise.
Phase crossing | The flow of money is directed to highly liquid alts, alcoins with the highest capitalization. Major purchases are taking place.
Phase 3: Highly liquid altcoins
After Ethereum identified the first cryptocurrency, highly capitalized altcoins show parabolic growth.
Phase crossing | Regardless of capitalization, some altcoins with good fundamentals show tremendous growth.
Phase 4: Altseason
High-cap alts have finished their vertical growth and are starting to lose ground relative to their peaks, but since they have outpaced Bitcoin and Ethereum in terms of growth, it seems to many that this will continue. Euphoria reigns all around, memes about Lambo and millions are everywhere, the smell of phantom wealth is in the air. Medium and low capitalized assets have the same trend.
Pump Altcoin Trends
But sometimes it also works in the opposite direction, like this year with Pepe Coin
In order to make a decision on investing in any project, you need to conduct research. Most of the information on the coin you are interested in can be found on the website, in technical documents, main analytics platform, social networks of both the project itself and different kinds of communities connected
A very important point is how to fix profit!
Let's say you allocated capital and bought 5 altcoins!
First, bitcoin begins to grow and correction begins
Then one of your altcoins makes a profit and you can fix part of the profit in bitcoin, that is, sell the altcoin not in usdt but in btc
You do not need to wait for a correction on this altcoin to enter again!
You can invest the second part of the profit by additionally accumulating a larger volume in an altcoin that has not yet shown results and is in accumulation
In parallel, bitcoin may also begin to grow, so you increase the profit that you have already recorded
Step by step you can increase your initial deposit just following the trend!

The ROAD to DOGE Dogecoin - A monthly time analysis
- 35 month Decline / Consolidation Period
- Current D/C period ends in April 2024
- Whether the ATH from prior cycle is reached or not,
time will tell. That will require lower pennant exit.
- Upper pennant breach, get in.
My prior TOTAL 2 and TOTAL 3 analysis of the altcoin market suggested altcoin season would not start until between Dec 2023 and Mar 2024. We now have a chart for DOGE that suggests a good window for entry of a trend would be April 2024. You can really see why so many pundits are requesting you to hold back on Altcoin allocation until later in the cycle when probability is in your favor.
Nothing is guaranteed here. We are looking for more probable outcomes and time patterns can help us time the trade with less risk.
IMPORTANT TO REMEMBER THAT DOGE IS ONE OF THE FEW PROOF OF WORK CHAINS THATS BROKEN OFF FROM BTC WITH A LONG HISTORY OF PROOF OF WORK WITH LITECOIN AND A FEW OTHERS. DO NOT WRITE IT OFF. AS SILLLY AS IT IS, ITS SILLINESS SELLS AND ITS BACKED BY A PROOF OF WORK ALGO THATS STOOD THE TEST OF TIME AND RESULTED IN BTC BECOMING THEE GREATEST ASSET OF THE DECADE. PAY ATTENTION TO PROOF OF WORK COMMODITIES, THEY WILL NEVER BE SECURITIES.
PUKA

Total 3 Bull Market in Jan - Mar 2024Total 3 - Altcoins (minus BTC & ETH)
A different "perspective" to yesterdays chart.
Yesterdays chart suggested TOTAL 2 (Altcoins minus BTC) has a probability of breaking out in Dec 2023.
The TOTAL 3 (Alts minus BTC/ETH) chart suggests we could break out later between Jan - Mar 2024. This would make sense as BTC and ETH are typically first movers, and are followed by the altcoin market.
Its important to understand that these charts help gauge timing a long term trade in altcoins. The charts only provide a rough time frame of a probability of a break out into a new secular bull market between Dec 2023 - Mar 2024. All this offers is a probable time window. I would hope it would help you sit on your cash until we have some confirmation of price direction within a historically reasonable time frame, as illustrated in the charts.
PUKA.

PHB Chinese Narrative to $6Hi guys !
Since Chinese narrative is around the corner
Here is the AMEX:PHB one of the biggest coin for Chinese narrative seasooooon!
Based on my T.A
AMEX:PHB is currently on Ascending Broadening Wedge, that targeting the next resistance which is located around $3 to $6
with this Volume at the major support, Chinese narrative season and the fundamental of this coin I am really confident on this one
Thank me later if you profit from here...
Buy me something!
HAHAHAH charot!
Godluck! trade responsibly

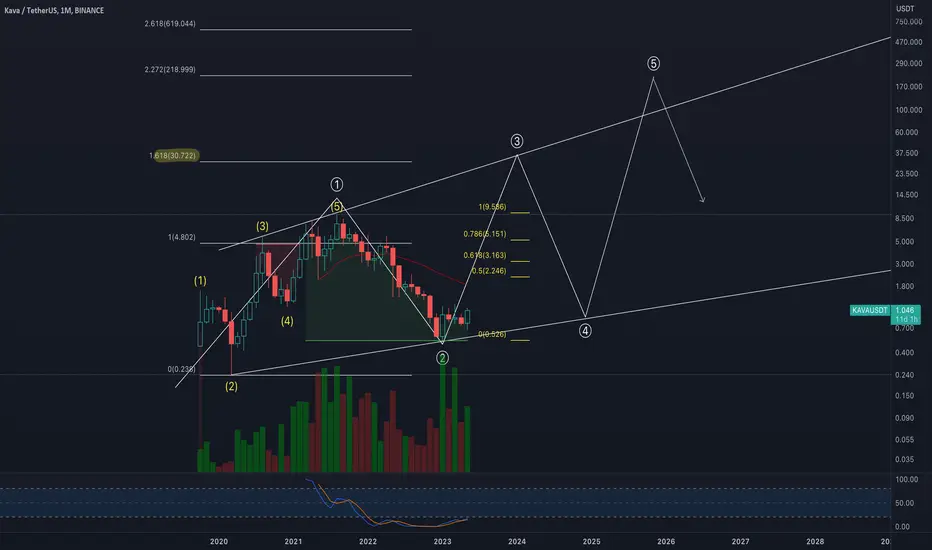
KAVAI have kava bottomed in an expanding diagonal wave 2 back in Oct 2022. Now we slow gind into W3 around $30
BTC D Simple Analysis - Altseason StartBasically, bitcoin's dominance was rejected at a historic high, this could perfectly mean the beginning of another altseason, the ideal was from now on for bitcoin to remain at the same levels or rise while its dominance goes down, I fully believe that dominance may reach 40-41% again, and that many altcoins will rise in the coming weeks.

ID riding highour 7-star premium buy signal just caught ID bull-run this morning. Hope we will have a smooth sail upwards. Expecting 1$ and above. Stop losse below that blue VWAP line.
text with me for the premium indiator
Free version is here

Altseason 2023 is going to start in coming days. Be ready. Hi dear community and my lovely followers.
I will be in short. I want you to inform that be ready for Altseason 2023 which is going to start in coming days. It will be wild.
As you see Total 2 on weekly log chart has broken the main diagonal resistance/ weekly falling wedge/ and it is going to break pink zone which is one of the strongest horizontal resistance.
As soon as it will be flipped, All altcoins will explode in a crazy way making x5-x10. Bellow you can see also Total 2 weekly regular chart, where Descending triangle was broken and retested successfully. The only thing we need is "flip the main horizontal resistance and the party will start.
Also pay attention to Weekly RSI which has also broken the main diagonal resistance with retest and it is above 50 level, so huge momentum is coming to altcoins market)))
BTW BTCD hit 48% main resistance which is again sign that it will be rejected because of altcoins hard pump.
Pay attention to updates bellow this analysis I'm going to post other charts as well.
Don't forget to like, comment and follow please. I'll appreciate your support.

📈Ready for altcoins to move up?📉CRYPTOCAP:BTC.D
Hello traders, I hope you have had a profitable week.✋
First, pay attention to the previous analysis of the Bitcoin Dominance Index.👌
The Bitcoin Dominance Index is approaching the important level of 48.48. Despite the possibility of being rejected below this level, if the price of Bitcoin stays at a certain level or grows, the altcoins in the market can experience an upward movement of 20-40%.
Ethereum price targets were identified in a separate analysis.
Please share ideas and leave a comment,
let me know what's your idea.
CrazyS

Is the altcoins season is going to take place?This is my opinion about the possible altcoins season. This narrative is just wild out of nowhere. The statistic and data that I got seems not supporting it as of now. The altcoins short term rally was only because of the BTC's pump. There isn't any source of fresh fund entering the altcoins market yet and the BTC's pair on the altcoins are moving in the lower high and lower low structure in majority. Enjoy the video analysis!

I smell an altcoin season comingBitcoin dominance is at the top of this range that it's been stuck in since May '21 and seemingly turning back down. A bunch of the alts just printed weekly trigger waves or bullish divergences as well. I smell an altcoin season incoming!

ETHBTC plan for AltcoinsSquiggles on ETHBTC chart for accumulating strong altcoins with longterm hold in mind.

BTC.D - Altcoin Season Getting Closer ❗️Hello TradingView Family / Fellow Traders. This is Richard, also known as theSignalyst.
📌 BTC.D has been stuck inside a weekly range for for almost two years.
After rejecting the lower bound of the range, BTC.D has been overall bullish trading inside the rising broadening wedge pattern in green.
📉 However, BTC.D is currently approaching the upper bound of the range, and upper green trendline acting as a non-horizontal resistance.
That's why we are speculating Altcoins to gain strength after a couple of days / weeks.
For now, as long as BTC.D is trading higher , BTC would be dominant and outperforming almost all altcoins.
What do you think? Will BTC.D reject the red resistance or break it upward? and why?
📚 Always follow your trading plan regarding entry, risk management, and trade management.
Good luck!
All Strategies Are Good; If Managed Properly!
~Rich
