Altcoin Season in May/June 2025First proper Altcoin Season -> 1 Year, -62% for BTC Dominance (Alts Crush BTC)
Second proper Altcoin Season -> 6 months, -44% for BTC Dominance (Alts Crush BTC again)
Third proper Altcoin Season (upcoming) -> 2-3 months, -20-25% for BTC Dominance (Alts will outperform BTC)
Diminishing returns for Altcoins, because there is not much utility for Altcoins as of now
ETH -> underwhelming performance in the last 2 years, thus gthe eneral altcoin market suffers
Mantra, memecoins, Luna, FTT , and many other scams affect the market, More people just buy BTC and forget and don't touch alts
Altcoinseason

Yellow Ket Gearing For A Breakout Amidst Symmetrical Triangleyellow ket coin ($KET) a token created under the Avax ecosystem is set for a breakout move amidst a symmetrical triangle pattern on the 4-hour price chart.
Should the asset break from the Ceiling of the symmetrical triangle, a bullish campaign will be materialise with a 100% surge in sight albeit $KET has to be listed on major exchanges to fuel the hype of the memecoin.
Similarly, on a bearish scenario, a break below the symmetrical triangle could also send $KET to a nosedive- leading to a selling spree.
About yellow ket
YellowCatDAO sets itself apart by integrating cutting-edge AI-driven trading mechanisms with a community-centered governance model. At its core, the project leverages an AI agent capable of executing trades across multiple blockchain networks, making it a pioneer in cross-chain AI trading. Unlike typical trading bots, this AI agent not only focuses on profitability but also strategically reinvests gains into the project’s treasury to ensure sustainable growth and support ongoing initiatives.
yellow ket Metric
The live yellow ket price today is $0.184953 USD with a 24-hour trading volume of $5,874,478 USD. Yellow ket is down 3.78% in the last 24 hours, with a market cap of not available. The circulating supply is not available and the max. supply is not available.

Breaking: Story Coin ($IP) Tanked 14% Today The price of Story coin ( NYSE:IP ) has recently dipped 14% for the past 24 hours but recent price action indicates build up momentum to reclaim loss grounds.
Story coin ( NYSE:IP ) a Layer 1 (L1) blockchain designed to serve as the foundation for intellectual property (IP) on the internet. It enables creators to register, license, and monetize their IP assets seamlessly. By leveraging blockchain technology, Story provides a transparent and efficient framework for IP attribution, licensing, and commercialization.
Technical Outlook
As of the time of writing, NYSE:IP is up 1.27%. the asset is trying to bounced off of the support point with momentum building as hinted by the RSI at 47, NYSE:IP is getting ready for a breakout to the 38.2% fib level.
Story Price Live Data
The live Story price today is $3.88 USD with a 24-hour trading volume of $118,805,575 USD. Story is down 7.65% in the last 24 hours. The current CoinMarketCap ranking is #62, with a live market cap of $1,040,840,390 USD. It has a circulating supply of 268,456,342 IP coins and the max. supply is not available.

Breaking: Raydium ($RAY) Reclaims $2 PivotRaydium's ( NASDAQ:RAY ) which is an automated market maker (AMM) and liquidity provider built on the Solana blockchain for the Serum decentralized exchange (DEX)'s native token has reclaimed the $2 pivot albeit the crypto market is in a general market correction.
The asset surge 6%, and is gearing up for a breakout to the $3 resistant as a breakout above the $2.3 region would cement the grounds for a bullish continuation move to the $3 point.
Unlike any other AMMs, Raydium provides on-chain liquidity to a central limit orderbook meaning that funds deposited into Raydium are converted into limit orders which sit on Serum’s orderbooks.
With the RSI at 60, Raydium is poised for the breakout move as momentum builds up.
However, should NASDAQ:RAY fail to pull up the stunt, a consolidation move to the $1.8 support point will be vehemently tested.
Raydium Price Live Data
The live Raydium price today is $1.99 USD with a 24-hour trading volume of $98,068,751 USD. Raydium is up 1.71% in the last 24 hours, with a live market cap of $578,910,409 USD. It has a circulating supply of 290,814,662 RAY coins and a max. supply of 555,000,000 RAY coins.

Breaking: MANTRA coin ($OM) Nosedived Nearly 100% Today MANTRA, a Security first RWA Layer 1 Blockchain, capable of adherence and enforcement of real world regulatory requirements that is Built for Institutions and Developers, offering a Permissionless Blockchain for Permissioned applications saw its native token Mantra Coin ( CRYPTOCAP:OM ) plummeted 94% today amidst falling out of a bearish symmetrical triangle.
The bloodbath came as a shock as days ago it was sitting on a market cap of $6 Billion and major deals were iterated, including a $1 Billion tokenization pact with DAMAC.
However, the main trigger was an allegedly suspicious 3.9M CRYPTOCAP:OM deposited (linked to team wallets) to OKX, fueling sell-off fears.
Key Allegations
Team controls ~90% supply – raising manipulation concerns.
Undisclosed OTC deals – tokens reportedly sold at 50% discounts.
Exchange liquidations – forced closures worsened the crash.
However, Binance CEO Said:
"OM CRYPTOCAP:OM 90% price crash was due to massive cross-exchange liquidations, tokenomics changes, and large token dumps".
In response to an X post, the Mantra team said:
"we want to assure you that MANTRA is fundamentally strong. Today’s activity was triggered by reckless liquidations, not anything to do with the project. One thing we want to be clear on: this was not our team. We are looking into it and will share more details about what happened as soon as we can."
Technical Outlook
As of the time of writing, CRYPTOCAP:OM is down 28.6% according to the 4 hour price chart. the asset is showing signs of a reversal but the diamond hands are weak prior the extreme token sell-off as hinted by the RSI at 11.51, this is extremely oversold with a possible reversal lurking around the corner, should the team figure out the cause of the bloodbath, CRYPTOCAP:OM might reclaim $1 zone and then possibly the $5 price point.
With the market cap presently $697 million, CRYPTOCAP:OM has enough strength for a bounce back after the mainstream crypto market might have digest the news.
MANTRA Price Live Data
The live MANTRA price today is $0.719974 USD with a 24-hour trading volume of $2,499,155,492 USD. MANTRA is down 88.55% in the last 24 hours. The current CoinMarketCap ranking is #81, with a live market cap of $697,898,136 USD. It has a circulating supply of 969,337,399 OM coins and the max. supply is not available.

Solana Surges Nearly 8% As Janover Pivots to Solana Treasury The price of Solana ( CRYPTOCAP:SOL ) famously known as the ethereum killer has surged nearly 8% today as Commercial property platform Janover pivots to Solana treasury strategy, stock surges 1,100% as investors rush in prior the news.
Janover has invested over $9.6 million into Solana (83,000+ SOL) as part of a new digital asset treasury strategy, with plans to stake its holdings and run validators to generate onchain revenue.
The move follows a $42 million funding round and has triggered a 1,100% surge in Janover’s stock price as the company positions itself as a transparent, publicly traded vehicle for crypto exposure.
Solana has lost grip of the $120 pivot for the past 2 weeks, but reclaimed the zone today currently trading at $120.54 per $SOL.
The daily price chart shows Solana has been trading within an enclose rectangular zone with the Resistant and support points slightly above each other. For Solana, a break above the $170 zone could pave way for a move to the $200- $270 zone. Similarly, a break below the $100 zone could be catastrophic for Solana.
However, the RSI shades a bit of a light at the end of the tunnel as it stands at 47, which is prime for a reversal.

Core Surge 12% Today Amidst Breaking Out From Falling WedgeThe Price of Satoshi Core ( MIL:CORE ) a L1 blockchain that is compatible with Ethereum Virtual Machine (EVM), saw a 12% uptick today after it broke out of a falling wedge pattern, eyeing a 50% surge amidst broader crypto momentum.
Satoshi core ( MIL:CORE ) since listing has been thriving lately and manage to withstand the sellers even after mainnet airdrop tokens were distributed. Core blochain has been thriving lately that it keeps striving to solve the blockchain trilemma in the crypto world.
Further accrediting to MIL:CORE 's authenticity, data from DeFilama shows about $545.2 Million has been locked in Total Value Lock (TVL) in the CORE ecosystem. This fundamental shows a growing interest and trust in the CORE ecosystem.
Technical Outlook
As of the time of writing, MIL:CORE is up 3% consolidating after the brief 12% sojourn. The 4-hour price chart shows a tendency for MIL:CORE to pull a 50% stunt in the short term as the market stabilizes. The RSI at 67 further hints at a trend continuation pattern as traders are looking for a clear-cut entry on the MIL:CORE chart.
What Is Core (CORE)?
Core (CORE) is built as an L1 blockchain that is compatible with Ethereum Virtual Machine (EVM), therefore it can run Ethereum smart contracts and decentralized applications (dApps). The Core network is powered by the “Satoshi Plus” consensus mechanism, which secures the network through a combination of delegated Bitcoin's mining hash and delegated Proof-of-Stake (DPoS). The protocol is backed by its native token, CORE.

Growth On Altcoins Is Beginning Right Now!Hello, Skyrexians!
Last week our main purpose was to catch the potential bottom for CRYPTOCAP:OTHERS.D and top for Bitcoin dominance. While the BTC.D has not still flashed the reversal signal, but altcoins did. So, we have a chance that reversal is coming, but don't be so optimistic on that, we need to see some extra confirmations anyway.
Let's take a look at the daily chart. Here we can see the 5 Elliott waves structure. Previous Elliott waves we have already looked in details in our recent analysis, today we need only wave 5. We pointed out 7-7.6% as a final target. The most likely reversal target was 7.4%, but now we are seeing good reaction from the minimal target. Yes, we have green dot signal on the Bullish/Bearish Reversal Bar Indictor . This is very strong, but let's wait at least the momentum change on the Awesome Oscillator and the opposite signal on the Bitcoin dominance.
Best regards,
Skyrexio Team
___________________________________________________________
Please, boost this article and subscribe our page if you like analysis!

Breaking: $BERA coin Dips 14% Today The price of BIST:BERA coin saw a 14% nosedived today amidst general crypto and stock market bloodbath that saw over $2.85 trillion wiped out from the US stock market today.
All this irregularities came as result of Donald Trump's Tax Tariff rates on Crypto currencies and stock shares.
For BIST:BERA , the RSI already hints at a weaker trend channel but BIST:BERA is bouncing off of the 78.6% Fibonacci retracement level that is acting as a support point for $BERA. However, should extreme selling pressure emerge, the 1-month low s will be force to act as support point for $BERA.
About Berachain
Berachain is an EVM-identical Layer 1 blockchain that introduces Proof of Liquidity (PoL), a novel consensus mechanism aligning network security with liquidity provision. The protocol operates on a unique two-token model: BERA (gas and staking token) and BGT (non-transferable governance and rewards token).
Berachain Price Live Data
The live Berachain price today is $5.93 USD with a 24-hour trading volume of $175,431,304 USD. Berachain is down 16.38% in the last 24 hours, with a live market cap of $637,052,141 USD. It has a circulating supply of 107,480,000 BERA coins and the max. supply is not available.

Breaking: $PI Dips 18% Today, Reaching New All-Time Low The price of the notable crypto asset NASDAQ:PI saw a nosedived today plummeting 18% reaching a new all time low price albeit the general crypto landscape is in a bloodbath with CRYPTOCAP:BTC dipping to $81k pivot similarly assets like CRYPTOCAP:ETH , CRYPTOCAP:SOL , $TRUMP and a whole lot of tokens saw a massive selling spree except for NYSE:FUN token that surged 55% today.
As of the time of writing, NASDAQ:PI is down 13% with the RSI at 21, this is hinting at a bullish reversal prior to the falling wedge pattern depicted in the chart. Other factors that attributed to the crypto currency and stock market downturn is the Donald Trumps' tax Tariff edict leading to Over $1.65 trillion wiped out from US stock market at open.
What Is Pi Network?
Pi Network is a social cryptocurrency, developer platform, and ecosystem designed for widespread accessibility and real-world utility. It enables users to mine and transact Pi using a mobile-friendly interface while supporting applications built within its blockchain ecosystem
Pi Price Live Data
The live Pi price today is $0.568544 USD with a 24-hour trading volume of $437,786,014 USD. Pi is down 16.31% in the last 24 hours. The current CoinMarketCap ranking is #27, with a live market cap of $3,862,744,520 USD. It has a circulating supply of 6,794,101,040 PI coins and a max. supply of 100,000,000,000 PI coins.
Breaking: Filecoin's USDFC Now on SushiSwap $FIL To Surge 250%The Filecoin's -backed stablecoin $USDFC has extended its services to the Sushiswap platform where users can now swap USDFC seamlessly on SushiSwap, making it easier than ever to access!
Furthermore, by providing liquidity to the FIL/USDFC pool, you can earn fee income.
This strategic move by Filecoin ( LSE:FIL ) is set to make LSE:FIL go parabolic in the coming week with an anticipated 250% surge in the horizon.
As of the time of writing, Filecoin ( LSE:FIL ) is down 6.24% losing the $3 pivot currently down to $2.66. The asset is approaching oversold levels as hinted by the RSI at 37.60. However, the daily chart pattern depicts a symmetrical triangle, a breakout above the ceiling of the triangle could cement the grounds for the 250% surge.
What Is Filecoin (FIL)?
Filecoin is a decentralized storage system that aims to “store humanity’s most important information.” The project raised $205 million in an initial coin offering (ICO) in 2017, and initially planned a launch date for mid-2019. However, the launch date for the Filecoin mainnet was pushed back until block 148,888, which is expected in mid-October 2020.
Filecoin Price Live Data
The live Filecoin price today is $2.67 USD with a 24-hour trading volume of $171,672,956 USD. Filecoin is down 6.34% in the last 24 hours. The current CoinMarketCap ranking is #47, with a live market cap of $1,728,274,124 USD. It has a circulating supply of 647,135,072 FIL coins and the max. supply is not available.

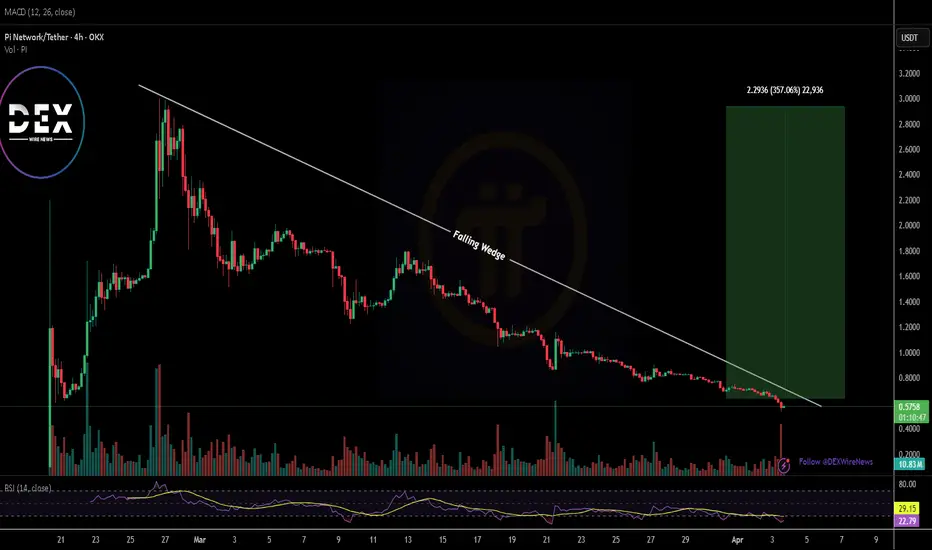
Just In: $PI Dips 6% Losing The $1 Pivot- Is There Still Hope?The price of the crypto currency NASDAQ:PI saw s noteworthy dip today, down by 6% approaching All time Low (ATL). With massive selling pressure, NASDAQ:PI has lose the $1 pivot to the bears.
However, with the appearance of a falling wedge, it clearly hints at an impending bullish reversal on the horizon with a speculated 350% surge albeit the crypto is having its own fair share of the marker's volatility.
With the RSI at 31 further hinting at a trend reversal, a breakout might be lurking around the corners.
Pi Price Live Data
The live Pi price today is $0.678989 USD with a 24-hour trading volume of $213,832,968 USD. Pi is down 5.03% in the last 24 hours. The current CoinMarketCap ranking is #26, with a live market cap of $4,612,460,558 USD. It has a circulating supply of 6,793,134,138 PI coins and a max. supply of 100,000,000,000 PI coins.

Breaking: $EOS Surged 20% Today Amidst a Falling Wedge PatternBuilt and integrated in the Binance Smart chain (BSC) NYSE:EOS coin spiked 20% today amidst a falling wedge pattern with technical patterns indicating a second legged up with a 180% surge in sight.
With the RSI at 79 momentum is increasing and the bulls are striving to push this altcoin to the $1 pivot. The asset is already trading above key moving averages, and with the daily candle stick depicting a bullish Harumi pattern, a trend continuation might be imminent. However, there might be short term correction to cool off before picking liquidity up.
What Is EOS Network?
The EOS Network is an open-source blockchain platform that prioritizes high performance, flexibility, security, and developer experience. As a third-generation blockchain platform powered by the EOS virtual machine, EOS has an extensible WebAssembly engine for deterministic execution of near fee-less transactions.
EOS is the market's most scalable, divisible, and programmable digital currency. EOS is a Delegated Proof of Stake (DPoS) network where stakeholders have the authority to select node operators. EOS is fully decentralized power doesn't reside in the hands of block miners, but rather all parties involved in the EOS Network.
EOS Price Live Data
The live EOS price today is $0.832481 USD with a 24-hour trading volume of $749,481,793 USD. EOS is up 19.40% in the last 24 hours, with a live market cap of $1,295,646,252 USD. It has a circulating supply of 1,556,368,173 EOS coins and a max. supply of 2,100,000,000 EOS coins.

Market Moves & Token Trends – Analysis with Me!Hi everyone, I hope you're all having a fantastic weekend!
To receive a token analysis , please follow the format below and leave your request in the comment section:
Example:
Project Name: Bitcoin
Token Symbol: BTC
Important Notes:
I will analyze a maximum of 20 tokens.
Each follower is allowed to submit one analysis request.
Once submitted , your token analysis will be shared directly below your comment .
Looking forward to your requests! 😊
If you found this helpful, please hit the ✅ Like Button ✅ (It fuels my energy) 💪 and Share it with your friends! Let’s grow together! 🙏😊
Wishing you health, wealth, and success! 🚀💸

Ripple Partners with Chipper Cash To Boost Cross-Border PaymentsRipple partners with Chipper Cash to expand cross-border payments in Africa, leveraging blockchain for faster, affordable transactions.
Ripple has announced a strategic collaboration with Chipper Cash to expand its payment solutions to Africa after securing a win against the US SEC earlier this week. Through Ripple Payments, the collaboration intends to foster cross border payments in the African regions.
Notably, the crypto platform’s alliance with Chipper Cash provides a fast, low-cost, and efficient payment system that unites international treaties.
Despite the partnership and important victory over the SEC, Ripples native coin ( CRYPTOCAP:XRP ) seems unbothered by the development with the asset maintaining the $2.3 price pivot. A break above the 38.2% Fibonacci retracement point might cement a bullish breakout for CRYPTOCAP:XRP with eyes set on $5 and beyond.
Similarly, in the case of a cool-off, CRYPTOCAP:XRP might find support in the 65% Fibonacci retracement level before picking liquidity up albeit the RSI is at 48 which is a strong sign of a bullish reversal lurking around the corners.
XRP Price Live Data
The live XRP price today is $2.35 USD with a 24-hour trading volume of $2,950,161,398 USD. XRP is down 0.54% in the last 24 hours. The current CoinMarketCap ranking is #4, with a live market cap of $137,073,610,487 USD. It has a circulating supply of 58,205,697,378 XRP coins and a max. supply of 100,000,000,000 XRP coins.

Trading opportunity for AMP AMPUSDTBased on technical factors there is a Buy position in :
📊 AMPUSDT
🔵 Buy Now or by Breakout
🪫Stop loss 0.003700
🔋Target 0.006000
📏 R/R 3,5
💸RISK : 1%
We hope it is profitable for you ❤️
Please support our activity with your likes👍 and comments📝

Altcoins Can Explode In 2025 [READ CAREFULLY]Hello, Skyrexians!
It's time to update our CRYPTOCAP:OTHERS.D idea. In fact nothing changed still. We don't have the growth confirmation, but let's put together all facts which tell us that this growth can happen soon.
Let's take a look at the weekly time frame. We can see that Bullish/Bearish Reversal Bar Indicator gave us the green dot signal. This signal is unconfirmed. For confirmation we need breakout of 9% level. Much better if candle will be closed above it. This fact can finish the huge ABC correction which has been started after the previous altcoin season. This reversal bar has the great angle with alligator which is another one sign of soon trend change. All these signals can bring the dominance above 20%. In this case we will see massive gains on altcoins.
Best regards,
Skyrexio Team
___________________________________________________________
Please, boost this article and subscribe our page if you like analysis!

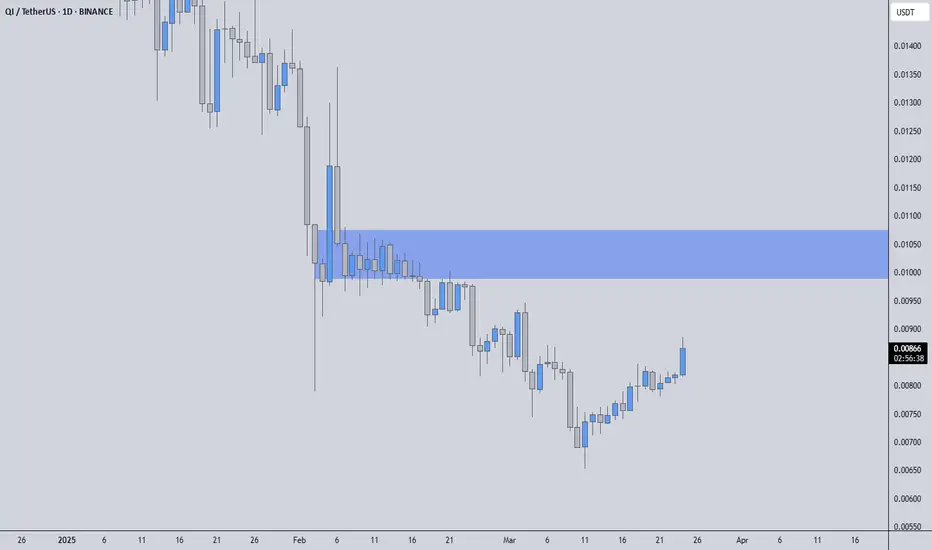
QIUSDT – MASSIVE %284 VOLUME SPIKE!🔥 Key Level Alert: The blue box is a huge resistance zone—we are at a critical decision point. Blind entries = bad trades. Smart entries = profits.
📊 How I’m Approaching This:
✅ Volume Surge = Increased Interest – But where is price heading?
✅ Blue Box = Key Resistance – If we reject, I’ll look for LTF breakdowns + CDV confirmations to short.
✅ Break & Retest? If we push above with volume and confirm on the retest, I’ll flip long instead.
💡 Trading Like a Pro:
I never insist on a short just because it "looks high." If the price breaks up with momentum, I adjust my bias and ride the trend. Flexibility is what separates winners from losers.
🚀 Follow for next-level, no-nonsense trading insights. The market moves, I move smarter. 🔥
I keep my charts clean and simple because I believe clarity leads to better decisions.
My approach is built on years of experience and a solid track record. I don’t claim to know it all, but I’m confident in my ability to spot high-probability setups.
If you would like to learn how to use the heatmap, cumulative volume delta and volume footprint techniques that I use below to determine very accurate demand regions, you can send me a private message. I help anyone who wants it completely free of charge.
I have a long list of my proven technique below:
🎯 ZENUSDT.P: Patience & Profitability | %230 Reaction from the Sniper Entry
🐶 DOGEUSDT.P: Next Move
🎨 RENDERUSDT.P: Opportunity of the Month
💎 ETHUSDT.P: Where to Retrace
🟢 BNBUSDT.P: Potential Surge
📊 BTC Dominance: Reaction Zone
🌊 WAVESUSDT.P: Demand Zone Potential
🟣 UNIUSDT.P: Long-Term Trade
🔵 XRPUSDT.P: Entry Zones
🔗 LINKUSDT.P: Follow The River
📈 BTCUSDT.P: Two Key Demand Zones
🟩 POLUSDT: Bullish Momentum
🌟 PENDLEUSDT.P: Where Opportunity Meets Precision
🔥 BTCUSDT.P: Liquidation of Highly Leveraged Longs
🌊 SOLUSDT.P: SOL's Dip - Your Opportunity
🐸 1000PEPEUSDT.P: Prime Bounce Zone Unlocked
🚀 ETHUSDT.P: Set to Explode - Don't Miss This Game Changer
🤖 IQUSDT: Smart Plan
⚡️ PONDUSDT: A Trade Not Taken Is Better Than a Losing One
💼 STMXUSDT: 2 Buying Areas
🐢 TURBOUSDT: Buy Zones and Buyer Presence
🌍 ICPUSDT.P: Massive Upside Potential | Check the Trade Update For Seeing Results
🟠 IDEXUSDT: Spot Buy Area | %26 Profit if You Trade with MSB
📌 USUALUSDT: Buyers Are Active + %70 Profit in Total
🌟 FORTHUSDT: Sniper Entry +%26 Reaction
🐳 QKCUSDT: Sniper Entry +%57 Reaction
📊 BTC.D: Retest of Key Area Highly Likely
📊 XNOUSDT %80 Reaction with a Simple Blue Box!
I stopped adding to the list because it's kinda tiring to add 5-10 charts in every move but you can check my profile and see that it goes on..
ETHUSD – Bullish Quasimodo + iH&S Breakout | Upside Targets!Ethereum (ETHUSD) has completed a textbook bullish Quasimodo pattern in confluence with an Inverse Head & Shoulders (iH&S) on the 15-minute timeframe. Price has broken out with strong bullish momentum, and the structure suggests more upside ahead.
📊 Technical Breakdown
1. Quasimodo Pattern
A well-defined Quasimodo reversal formed at the swing low, providing early signs of a bullish trend shift.
This pattern combines a higher low and reclaimed structure—offering an excellent base for trend continuation.
2. Inverse Head & Shoulders
Left Shoulder, Head, and Right Shoulder clearly structured with neckline breakout confirmed.
Breakout above neckline resulted in a 5.38% rally into minor resistance.
3. Bull Flag Formation
A short consolidation just below the recent highs resembles a bull flag, typically a continuation signal.
Breakout from the flag would trigger the next leg toward the final target.
🎯 Targets
Minimum Target: 2,121.41 — aligns with neckline projection.
Final Target: 2,229.90 — 6.27% projected move based on iH&S measured move.
📌 Trade Idea
Entry Zone: On bull flag breakout above 2,093
Stop Loss: Below 2,060 (flag low support)
TP1: 2,121
TP2: 2,229
🔎 Key Confluences
Pattern Breakouts ✅
Strong Momentum ✅
Clean Structure & Price Geometry ✅
ETH bulls have reclaimed short-term control. If momentum sustains, the upside targets are well within reach.

ACXUSDT – Resistance Zones Marked on the Chart!
“Key levels ahead—will resistance hold or will we see a breakout?”
🔥 Key Insights:
✅ Resistance Zones Clearly Defined – Watch for strong reactions.
✅ Rejection = Short Setup – Only with LTF breakdown + CDV confirmation.
💡 The Smart Plan:
Focus on LTF (15M & 1H) Price Action – Breakout or rejection will be clear there.
Use CDV & Volume Profile – Don’t trade blindly, follow the data.
Let the Market Show the Way – We react, not predict.
“Patience + Smart Entries = Winning Trades—watch the chart, trade the plan!” 📉
A tiny part of my runners:
🎯 ZENUSDT.P: Patience & Profitability | %230 Reaction from the Sniper Entry
🐶 DOGEUSDT.P: Next Move
🎨 RENDERUSDT.P: Opportunity of the Month
💎 ETHUSDT.P: Where to Retrace
🟢 BNBUSDT.P: Potential Surge
📊 BTC Dominance: Reaction Zone
🌊 WAVESUSDT.P: Demand Zone Potential
🟣 UNIUSDT.P: Long-Term Trade
🔵 XRPUSDT.P: Entry Zones
🔗 LINKUSDT.P: Follow The River
📈 BTCUSDT.P: Two Key Demand Zones
🟩 POLUSDT: Bullish Momentum
🌟 PENDLEUSDT.P: Where Opportunity Meets Precision
🔥 BTCUSDT.P: Liquidation of Highly Leveraged Longs
🌊 SOLUSDT.P: SOL's Dip - Your Opportunity
🐸 1000PEPEUSDT.P: Prime Bounce Zone Unlocked
🚀 ETHUSDT.P: Set to Explode - Don't Miss This Game Changer
🤖 IQUSDT: Smart Plan
⚡️ PONDUSDT: A Trade Not Taken Is Better Than a Losing One
💼 STMXUSDT: 2 Buying Areas
🐢 TURBOUSDT: Buy Zones and Buyer Presence
🌍 ICPUSDT.P: Massive Upside Potential | Check the Trade Update For Seeing Results
🟠 IDEXUSDT: Spot Buy Area | %26 Profit if You Trade with MSB
📌 USUALUSDT: Buyers Are Active + %70 Profit in Total
🌟 FORTHUSDT: Sniper Entry +%26 Reaction
🐳 QKCUSDT: Sniper Entry +%57 Reaction
📊 BTC.D: Retest of Key Area Highly Likely
I stopped adding to the list because it's kinda tiring to add 5-10 charts in every move but you can check my profile and see that it goes on..

BBUSDT – Blue Box Support, Red Box Resistance! “Key levels in play—will buyers defend, or will resistance hold strong?”
🔥 Key Insights:
✅ Blue Box = Support Zone – If buyers step in, it’s a great reaction area.
✅ Red Box = Resistance Zone – A breakout or rejection will decide the next move.
✅ LTF Breakouts & CDV Confirmations Are a Must – No confirmation, no trade.
💡 The Smart Plan:
Watch Blue Box for Buy Reactions – But only with CDV & LTF structure shifts.
Red Box is a Key Resistance – A clean breakout = bullish. A rejection = short opportunity.
Patience Wins – We wait for confirmation, not emotions.
“The market will decide—we just trade with the right signals!” 📈🔥
A tiny part of my runners:
🎯 ZENUSDT.P: Patience & Profitability | %230 Reaction from the Sniper Entry
🐶 DOGEUSDT.P: Next Move
🎨 RENDERUSDT.P: Opportunity of the Month
💎 ETHUSDT.P: Where to Retrace
🟢 BNBUSDT.P: Potential Surge
📊 BTC Dominance: Reaction Zone
🌊 WAVESUSDT.P: Demand Zone Potential
🟣 UNIUSDT.P: Long-Term Trade
🔵 XRPUSDT.P: Entry Zones
🔗 LINKUSDT.P: Follow The River
📈 BTCUSDT.P: Two Key Demand Zones
🟩 POLUSDT: Bullish Momentum
🌟 PENDLEUSDT.P: Where Opportunity Meets Precision
🔥 BTCUSDT.P: Liquidation of Highly Leveraged Longs
🌊 SOLUSDT.P: SOL's Dip - Your Opportunity
🐸 1000PEPEUSDT.P: Prime Bounce Zone Unlocked
🚀 ETHUSDT.P: Set to Explode - Don't Miss This Game Changer
🤖 IQUSDT: Smart Plan
⚡️ PONDUSDT: A Trade Not Taken Is Better Than a Losing One
💼 STMXUSDT: 2 Buying Areas
🐢 TURBOUSDT: Buy Zones and Buyer Presence
🌍 ICPUSDT.P: Massive Upside Potential | Check the Trade Update For Seeing Results
🟠 IDEXUSDT: Spot Buy Area | %26 Profit if You Trade with MSB
📌 USUALUSDT: Buyers Are Active + %70 Profit in Total
🌟 FORTHUSDT: Sniper Entry +%26 Reaction
🐳 QKCUSDT: Sniper Entry +%57 Reaction
📊 BTC.D: Retest of Key Area Highly Likely
I stopped adding to the list because it's kinda tiring to add 5-10 charts in every move but you can check my profile and see that it goes on..

$LINA Set For 7000% Surge Amidst a Bullish Symmetrical TriangleLina a decentralized delta-one asset protocol capable of instantly creating synthetic assets with unlimited liquidity that opens traditional assets like commodities, forex, market indices and other thematic sectors to cryptocurrency users by supporting the creation of “Liquids” — Linear’s synthetic asset tokens, is set for a massive surge with a speculated 7,000% surge in the long run amidst a bullish symmetrical triangle that has been forming since for over 3 years now.
The token is currently oversold as seen by the RSI at 22, but this only makes the story interesting. Despite GETTEX:LINA down 45% today tanking hard amidst the markets volatility, GETTEX:LINA is offering early entry for traders to capitalise on this oversold territory and lack of momentum to kickstart a bullish renaissance.
With a market cap of $9.84M and listings on major exchanges like Binance, Bybit, Kucoin, MEXC, Houbi, etc. This is a good enough sign to capitalize on this opportunity presented by this altcoin.
Linear Finance Price Live Data
The live Linear Finance price today is $0.001174 USD with a 24-hour trading volume of $39,622,410 USD. Linear Finance is down 35.68% in the last 24 hours, with a live market cap of $9,043,949 USD. It has a circulating supply of 7,703,149,626 LINA coins and a max. supply of 10,000,000,000 LINA coins.

Just In: $ORCA Surged Nearly 300% Today Amidst a Falling Wedge Orca ( LSE:ORCA ) one of the first general-purpose AMMs launched on Solana where users can swap assets, provide liquidity, and earn yield through an easy-to-use interface saw its native token ( LSE:ORCA ) spike nearly 300% today amidst a bullish pennant that has been formed on the first week of December 2024.
This steep falling wedge that has occurred last year led to LSE:ORCA losing about 78% of market value, causing a liquidity sweep and low demand for LSE:ORCA which made the token to undergo about 3 months of consolidation phases.
As of the time of writing, LSE:ORCA has cool-off consolidating to the $0.0214 support point with the Relative Strength Index (RSI) at 62 this is a healthy state for LSE:ORCA to form a demand territory for buyers to step in.
Orca Price Live Data
The live Orca price today is $2.89 USD with a 24-hour trading volume of $554,878,139 USD. Orca is up 83.76% in the last 24 hours, with a live market cap of $161,365,451 USD. It has a circulating supply of 55,776,561 ORCA coins and the max. supply is not available.
