PENGUUSDT – Blue Box Looks Good, But Be Careful!“Hype alone is NOT a strategy confirmation is everything! Blue box is a potential entry, but fundamentals matter.”
🔥 Key Insights:
✅ Blue Box = Possible Support – But we don’t rush in blindly.
✅ News-Driven Pumps Are Risky – If you haven’t heard, Google "PENGU ETF" and catch up.
✅ Only Trading with Confirmation – CDV, LTF breakouts, volume profile NO exceptions!
💡 The Smart Plan:
If Structure Confirms → Long from Blue Box – We trade levels, not emotions.
If Fake Pump → Stay Away – News pumps dump hard if there’s no real support.
Volume & CDV Must Align – Real buyers must show up, or we pass.
“No confirmation, no trade! We stay smart while others get caught in FOMO.” 🚀🔥🐧
A tiny part of my runners;
💼 STMXUSDT: 2 Buying Areas
🐢 TURBOUSDT: Buy Zones and Buyer Presence
🌍 ICPUSDT.P: Massive Upside Potential | Check the Trade Update For Seeing Results
🟠 IDEXUSDT: Spot Buy Area | %26 Profit if You Trade with MSB
📌 USUALUSDT: Buyers Are Active + %70 Profit in Total
🌟 FORTHUSDT: Sniper Entry +%26 Reaction
🐳 QKCUSDT: Sniper Entry +%57 Reaction
Altcoinseason

BANANAUSDT – 344% Volume Surge at Key Resistance! “Big volume, big levels—but we don’t FOMO, we wait for confirmation!”
🔥 Key Insights:
✅ 344% Volume Spike – Something is brewing, but is it real?
✅ Major Resistance Zone – This level decides the next big move.
✅ Confirmation is Everything – No breakout? No trade.
💡 The Smart Plan:
Wait for a Clean Break & Retest – No confirmation, no entry.
Watch CDV & Volume Profile – If buyers are serious, we see it here.
LTF Breakout = Green Light – Structure > Hype, always.
“Volume is explosive, but resistance is strong. We wait, confirm, and strike smart!” 🔥
A tiny part of my runners;
🌊 WAVESUSDT.P: Demand Zone Potential
🟣 UNIUSDT.P: Long-Term Trade
🔵 XRPUSDT.P: Entry Zones
🔗 LINKUSDT.P: Follow The River
📈 BTCUSDT.P: Two Key Demand Zones

PDAUSDT – Liquidity Grab & Rejection! Watching for Shorts🚨 PDAUSDT – Liquidity Grab & Rejection! Watching for Shorts 🚨
“Classic move—liquidity swept, rejection confirmed. Now, we hunt for the breakdown!”
🔥 Key Insights:
✅ Liquidity Cleared – No more excuses for price to push higher.
✅ Resistance Holding Strong – Sellers stepping in, rejection in play.
✅ LTF Breakdown = Entry Signal – We wait for structure, not emotions.
💡 The Game Plan:
Monitor 1H Downward Breakouts – Confirmed weakness = sniper short entries.
CDV & Volume Profile Must Align – Smart money must support the move.
Retest of Broken Support = Ideal Short – Precision matters, no chasing.
“Patience wins. If the structure confirms, we pull the trigger—clean & calculated!” 🚨🔥📉
A tiny part of my runners;
💼 STMXUSDT: 2 Buying Areas
🐢 TURBOUSDT: Buy Zones and Buyer Presence
🌍 ICPUSDT.P: Massive Upside Potential | Check the Trade Update For Seeing Results
🟠 IDEXUSDT: Spot Buy Area | %26 Profit if You Trade with MSB
📌 USUALUSDT: Buyers Are Active + %70 Profit in Total
🌟 FORTHUSDT: Sniper Entry +%26 Reaction
🐳 QKCUSDT: Sniper Entry +%57 Reaction

1000CHEEMSUSDT – 2500% Volume Surge!1000CHEEMSUSDT – 2500% Volume Surge! Watching the Blue Boxes Closely
“A 2500% volume increase is NOT a joke—something BIG is happening! But smart entries matter.”
🔥 Key Insights:
✅ Massive Volume Surge – This is where real moves start.
✅ Two Strong Support Zones Marked (Blue Boxes) – These are the ideal reaction points.
✅ Patience = Profit – Jumping in blindly is how people get wrecked. Wait for confirmation!
💡 The Smart Plan:
Watch for LTF Market Structure Breaks at Blue Boxes – A reaction here = smart money stepping in.
CDV & Volume Profile Must Align – If buyers show real strength, we take action.
No Confirmation? No Entry. Discipline Pays!
“We trade setups, not emotions. Let price come to us, confirm, and then we strike!” 🚀🔥
A tiny part of my runners;
🌊 WAVESUSDT.P: Demand Zone Potential
🟣 UNIUSDT.P: Long-Term Trade
🔵 XRPUSDT.P: Entry Zones
🔗 LINKUSDT.P: Follow The River
📈 BTCUSDT.P: Two Key Demand Zones

Alts- Will they drop further? (+name your alt)In my early February analysis on altcoins , I noted that while a bounce was likely after the sharp drop triggered by Trump’s initial tax remarks, the $1.3T level would act as strong resistance.
I expected another decline once this resistance was confirmed— which is exactly what happened, as the market reached that level and began to drop again.
After multiple tests of the rising trendline that began in October 2023, last week saw a breakdown, with price finding support just above $900B (an important level as we can see from the posted chart).
But was that the full extent of the drop?
In my view, we are far from being in the clear, and further declines seem likely. Technically, the rising trendline has been broken, and the recent rebound appears to be corrective rather than the start of a sustained recovery.
As long as the price remains below the $1.15T–$1.2T zone, I see a high probability of the market
breaking under 900B zone support and reaching $700B in the coming months.

ALTCOINS TO WATCH - INSANE VOLUME SPIKE! BIG MOVE LOADING?🚀 VICUSDT – INSANE VOLUME SPIKE! BIG MOVE LOADING? 🚀
“This is not just a volume increase. This is a 3,061% SPIKE. Smart money is moving—are you paying attention?”
🔥 Key Points:
✅ Massive Volume Surge – This isn’t retail noise. Someone BIG is making a move.
✅ Blue Boxes = Strong Support – But don’t just buy blindly!
✅ CDV & LTF Breakouts = Must-Have Confirmation – We only enter when the market tells us it’s ready.
💡 The Game Plan:
Watch lower time frame (LTF) breakouts for entry triggers.
If CDV confirms, we have a high-probability trade.
No confirmation? No trade. Simple.
“The market doesn’t wait. The best setups don’t last. Be early, be smart, and execute like a pro.” 🔥🔥🔥
I keep my charts clean and simple because I believe clarity leads to better decisions.
My approach is built on years of experience and a solid track record. I don’t claim to know it all, but I’m confident in my ability to spot high-probability setups.
If you would like to learn how to use the heatmap, cumulative volume delta and volume footprint techniques that I use below to determine very accurate demand regions, you can send me a private message. I help anyone who wants it completely free of charge.
I have a long list of my proven technique below:
🎯 ZENUSDT.P: Patience & Profitability | %230 Reaction from the Sniper Entry
🐶 DOGEUSDT.P: Next Move
🎨 RENDERUSDT.P: Opportunity of the Month
💎 ETHUSDT.P: Where to Retrace
🟢 BNBUSDT.P: Potential Surge
📊 BTC Dominance: Reaction Zone
🌊 WAVESUSDT.P: Demand Zone Potential
🟣 UNIUSDT.P: Long-Term Trade
🔵 XRPUSDT.P: Entry Zones
🔗 LINKUSDT.P: Follow The River
📈 BTCUSDT.P: Two Key Demand Zones
🟩 POLUSDT: Bullish Momentum
🌟 PENDLEUSDT.P: Where Opportunity Meets Precision
🔥 BTCUSDT.P: Liquidation of Highly Leveraged Longs
🌊 SOLUSDT.P: SOL's Dip - Your Opportunity
🐸 1000PEPEUSDT.P: Prime Bounce Zone Unlocked
🚀 ETHUSDT.P: Set to Explode - Don't Miss This Game Changer
🤖 IQUSDT: Smart Plan
⚡️ PONDUSDT: A Trade Not Taken Is Better Than a Losing One
💼 STMXUSDT: 2 Buying Areas
🐢 TURBOUSDT: Buy Zones and Buyer Presence
🌍 ICPUSDT.P: Massive Upside Potential | Check the Trade Update For Seeing Results
🟠 IDEXUSDT: Spot Buy Area | %26 Profit if You Trade with MSB
📌 USUALUSDT: Buyers Are Active + %70 Profit in Total
🌟 FORTHUSDT: Sniper Entry +%26 Reaction
🐳 QKCUSDT: Sniper Entry +%57 Reaction
📊 BTC.D: Retest of Key Area Highly Likely
I stopped adding to the list because it's kinda tiring to add 5-10 charts in every move but you can check my profile and see that it goes on..

VGXUSDT – Resistance in Play! Breakout Incoming?🚀 VGXUSDT – Resistance in Play! Breakout Incoming? 🚀
“This is a textbook setup—when resistance flips into support, that’s where the real move begins!”
🔥 Key Levels to Watch:
✅ VGX is testing resistance – A breakout could bring serious momentum.
✅ Blue Box = Key Breakout Zone – If price clears this area, we’re looking at a potential shift in structure.
✅ Retest is the Golden Entry – Smart traders wait for the perfect moment, and that’s the retest.
💡 The Plan:
Breakout Above Blue Box = Bullish Signal
Retest & CDV Confirmation = High-Probability Entry
No Breakout? No Trade! We Don’t Chase.
“Opportunities like this don’t wait—stay sharp, react fast, and position yourself like a pro!” 🚀🔥
I keep my charts clean and simple because I believe clarity leads to better decisions.
My approach is built on years of experience and a solid track record. I don’t claim to know it all, but I’m confident in my ability to spot high-probability setups.
If you would like to learn how to use the heatmap, cumulative volume delta and volume footprint techniques that I use below to determine very accurate demand regions, you can send me a private message. I help anyone who wants it completely free of charge.
I have a long list of my proven technique below:
🎯 ZENUSDT.P: Patience & Profitability | %230 Reaction from the Sniper Entry
🐶 DOGEUSDT.P: Next Move
🎨 RENDERUSDT.P: Opportunity of the Month
💎 ETHUSDT.P: Where to Retrace
🟢 BNBUSDT.P: Potential Surge
📊 BTC Dominance: Reaction Zone
🌊 WAVESUSDT.P: Demand Zone Potential
🟣 UNIUSDT.P: Long-Term Trade
🔵 XRPUSDT.P: Entry Zones
🔗 LINKUSDT.P: Follow The River
📈 BTCUSDT.P: Two Key Demand Zones
🟩 POLUSDT: Bullish Momentum
🌟 PENDLEUSDT.P: Where Opportunity Meets Precision
🔥 BTCUSDT.P: Liquidation of Highly Leveraged Longs
🌊 SOLUSDT.P: SOL's Dip - Your Opportunity
🐸 1000PEPEUSDT.P: Prime Bounce Zone Unlocked
🚀 ETHUSDT.P: Set to Explode - Don't Miss This Game Changer
🤖 IQUSDT: Smart Plan
⚡️ PONDUSDT: A Trade Not Taken Is Better Than a Losing One
💼 STMXUSDT: 2 Buying Areas
🐢 TURBOUSDT: Buy Zones and Buyer Presence
🌍 ICPUSDT.P: Massive Upside Potential | Check the Trade Update For Seeing Results
🟠 IDEXUSDT: Spot Buy Area | %26 Profit if You Trade with MSB
📌 USUALUSDT: Buyers Are Active + %70 Profit in Total
🌟 FORTHUSDT: Sniper Entry +%26 Reaction
🐳 QKCUSDT: Sniper Entry +%57 Reaction
📊 BTC.D: Retest of Key Area Highly Likely
I stopped adding to the list because it's kinda tiring to add 5-10 charts in every move but you can check my profile and see that it goes on..

$OTHERS seems to have reached the bottom,Has CRYPTOCAP:OTHERS Finally Bottomed? Is It Time for Altcoins to Recover?
CRYPTOCAP:OTHERS has been struggling with a bearish double top and a negative divergence, leading to a massive sell-off. The altcoin index (excluding the top 10 cryptos) lost half of its market cap, bottoming out at $255B—a critical support level.
Breaking below this support would be a disastrous scenario. However, signs of recovery are emerging:
✅ RSI is at the bottom, indicating a potential rebound.
✅ MACD (daily) has made a bullish crossover, hinting at momentum shift.
These signals suggest the bleeding might be over, and capital could soon flow back into riskier altcoin assets.
DYOR!

WARNING! Big Dump For Altcoins Will Start Tomorrow!Hello, Skyrexinans!
Couple of weeks ago we also warned you on the weekend that on the next week can start the huge dump on the crypto market and on altcoins especially. Today we received the red alert again that we have to be ready for the drop which will start tomorrow.
Let's take a look at the daily chart. Here we can see that price has already completed 4 waves of 5 of the Elliott waves cycle. Wave 4 is the triangle shaped, that's why it has not even reached the 0.38 Fibonacci retracement. In our opinion it's finished and now it's time for the wave 5, which has the target approximately at 7%. When we will see divergence with AO and green dot on the Bullish/Bearish Reversal Bar Indicator it can be the historical moment when the price will show us the reversal.
Best regards,
Skyrexio Team
___________________________________________________________
Please, boost this article and subscribe our page if you like analysis!

EGLD: Is There a Chance for Another Rally? Elliott Wave AnalysisEGLD / MultiversX: We saw a five-wave decline into the support area back in September 2023. Since then, the price has struggled to rally impulsively and has largely failed to participate in the broader bullish market. While it's still holding long-term support at $13.35, which is a positive sign, the short-term structure doesn't provide much confidence for an imminent upside reversal.
A recovery bounce is due, but for any meaningful rally to take shape, we need to see a break above $25.55. That would be the first indication that a low might be in. However, from there, we’d have to analyze the structure closely to determine whether it aligns with the yellow scenario or the more bearish orange scenario.
At this stage, there are no clear patterns suggesting a move to all-time highs. The white scenario remains speculative and is not the preferred view, though it's still valid, which is why it remains on the chart. Between yellow and orange, I remain neutral for now. The short-term trend is still down, and until $25.55 is broken, there's no confirmation of a low being in place.

Breaking: Ethena ($ENA) Surged 21% Today- What Next?The synthetic dollar protocol built on Ethereum that will provide a crypto-native solution for money that is not reliant on traditional banking system infrastructure, alongside a globally accessible dollar-denominated savings instrument native token Ethena ( MIL:ENA ), saw its price surge by a whooping 21% today amidst the three white crow pattern that appeared on the daily price chart hinting at increased buying pressure.
Ethena, weeks back was down losing almost half of value, bulls took advantage of the dip and capitalize on the oversold nature of MIL:ENA , presently placing the RSI at 58 which is neither overbought nor oversold but hints at a continuous buying pressure.
In the case of a market pull back, MIL:ENA might find support in the 78.6% fib retracement level, similarly, a break above the 1-month high could pave way for a new resistance point with massive influx of buyers in the long term.
Ethena Price Live Data
The live Ethena price today is $0.439498 USD with a 24-hour trading volume of $758,695,169 USD. We update our ENA to USD price in real-time. Ethena is up 16.02% in the last 24 hours, with a live market cap of $1,416,695,330 USD. It has a circulating supply of 3,223,437,500 ENA coins and the max. supply is not available.

SOL formed Weekly H&S, Pump Potential Could Be HugeLast time, I shared an analysis predicting that CRYPTOCAP:SOL could drop to $131 to form the second right shoulder of a massive Head and Shoulders Bottom. (I’ve included the related publications for you to check.)
That drop has played out recently, and COINBASE:SOLUSD has hit the target.
The weekly Head and Shoulders Bottom on BINANCE:SOLUSDT looks perfect, with two dips on each shoulder and nearly identical drop sizes.
If this pattern holds, the upside potential is massive—breaking $1,000 could just be a matter of time (and that might even be a conservative target).
But, please always set a stop-loss for your trades—there are no guarantees in any scenario.
🔴 Read my signature & publications for more info you don’t want to miss.
🔥 for more future "guesses" like this!

CRVUSDT Long after Liquidity SweepPrice Action & Range:
The price has been in a downtrend, forming a range low and a range high.
There is a clear liquidity curve, showing a gradual decline in price before stabilizing.
The price recently tested the range low, where manipulation occurred (highlighted in grey).
A potential bullish reversal is anticipated, aiming toward the range high.
Key Levels:
Range Low: The lowest price level in the marked range, acting as strong support.
Range High: The highest price level in the marked range, acting as resistance.
Two intermediate target levels are indicated.
Manipulation Zone:
A grey box at the range low signifies market manipulation, likely a stop-hunt or liquidity grab before a move up.
Future Price Projection:
An upward arrow suggests a forecasted price increase toward the range high.
1M Candle Overview:
The right side of the chart includes a monthly (1M) candlestick, showing significant volatility with a large wick.
Summary:
The chart suggests that CRV is currently at a strong support level, and after a manipulation event, the price is expected to rally towards the range high.
The analysis aligns with a liquidity-based trading strategy, aiming to capture the next big move.

OTHERS - Bullish PhaseOthers now at 250B, considering that the Bitcoin price could still drop..there are still at least 250B more to pour into Others.
Apr - May looks promising for some altcoins.
Thank you,
This is not a trading advice.
St.Gex

COREUSD - Bullish PhaseCore is a new project, market loves this project in a new cycle.
Tokenomic are good.
Partnerships are important.
In case that euphoria enters in the market we can even see a new ATH.
Thank you,
St.Gex
This is not a trading advice!

CAKEUSD - Bullish PhasePancake Swap was a used App lsat cycle.
Backed by Binance.
Small Market Cap.
~70% of Total supply unlocked.
Time to jump soon.
This is not a trading advice.
Thanks.
St.Gex

THETAUSD - Bullish PhaseTHETA is a good project with nice partners.
Tokenomics are great.
There are few chances that the project would reach again same ATH as last cycle but still it s ~ 7x
This is not a trading advice.
Thanks
St.Gex

QNTUSD - Bullish PhaseGood tokenomics.
Medium caps entering a bullphase.
QNT is at a good level.
Thank you,
St.Gex
Not a trading advice!

TWTUSD - Bullish Phase TWT - Backed by Binance
TrustWallet App known and used.
400 Market Cap - 1B Fully Diluted
Good tokenomics.
Good Listings.
Thank you,
St.Gex

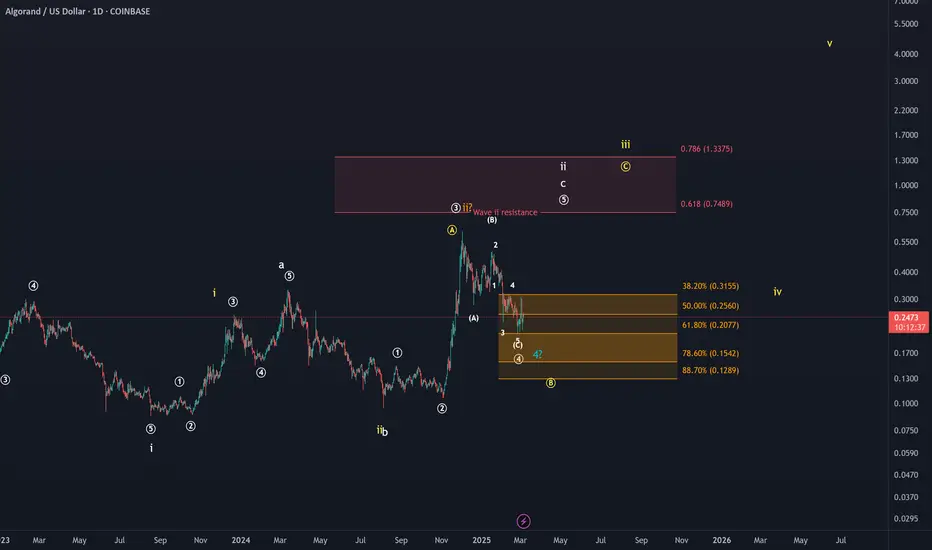
ALGO (Algorand) Altcoin Analysis. One More High in this Cycle?ALGO: The price is currently testing the 61.8% retracement level, which is the last relevant support level for wave 4 in the white scenario. While the idea of a fourth wave pullback will not be invalidated below this level, other interpretations will become more likely. The orange scenario allows for the interpretation that a long-term price top has been established, but this is currently not yet seen as preferred scenario. A wider wave B correction would be a likely alternative, should the price break below $0.20. However, due to the questionable chart context, such as a 5-wave move down into the 2023 lows, I do not expect new all-time highs to be reached in this cycle.
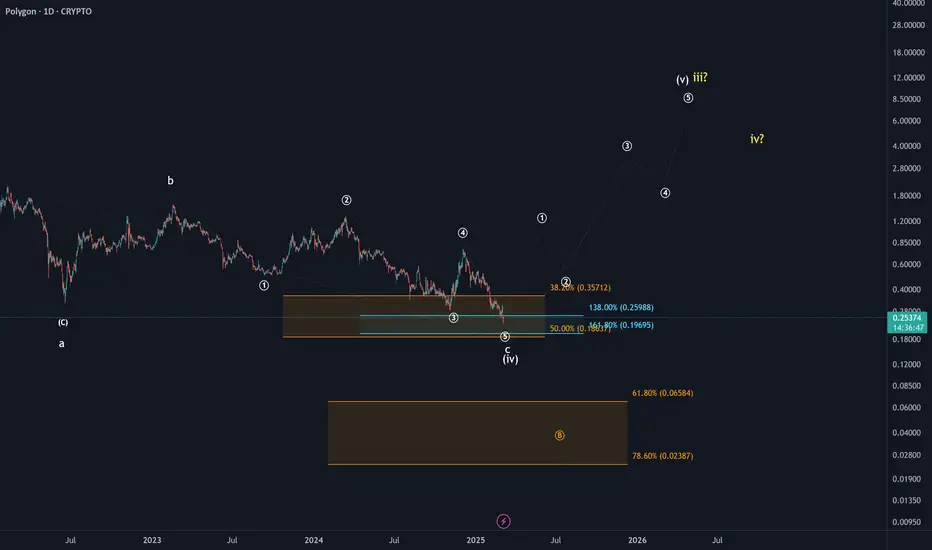
POL: Key Support Holding or Deeper Correction Ahead?POL: From a price perspective, the pullback into support between $0.186 and $0.357 aligns well with the idea of a fourth wave within a larger upside impulse. However, the prolonged nature of this retracement reduces confidence in that outlook. Given the complexity of the correction and the broader position within the crypto cycle, a break of support and a deeper correction remain plausible. In that scenario, a test of the $0.023 - $0.065 region could come into play. It may be prudent to wait for a clear confirmation of a local low before turning bullish on this chart again.
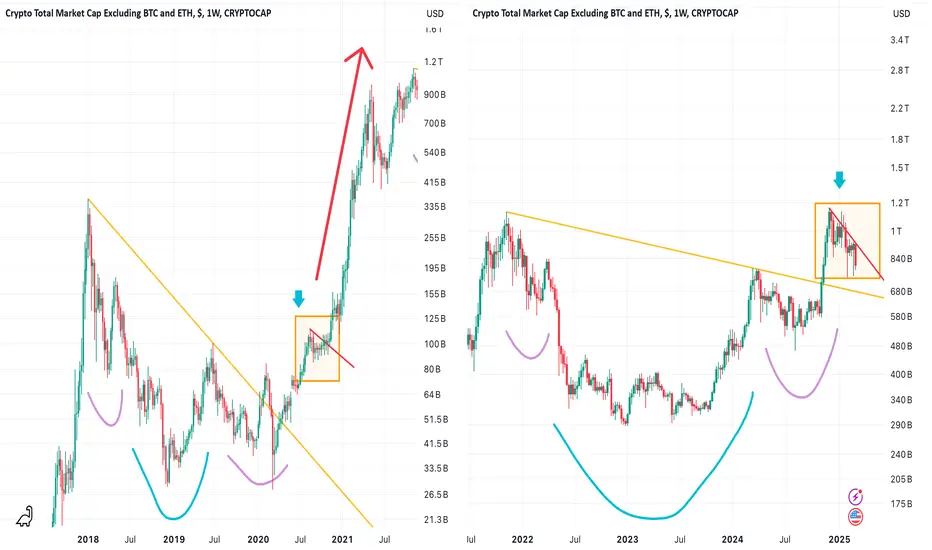
Potential Pattern for Altseason 20252020 Altcoin Season Bull Run:
Large Head & Shoulders Bottom ➡︎ Pullback ➡︎ Breakout of Downtrend Line → Massive Pump
Current Situation:
Large Head & Shoulders Bottom ➡︎ Pullback ➡︎ ❓
Do you still believe in the bull market?
Leave a comment!
🔴 Read my signature & publications for more info you don’t want to miss.
🔥 for more future "guesses" like this!
BATUSD - Bullish Phase StartsHello,
Altcoin season starts,
BAT is already listed on Grayscale, it can be compliant for an ETF also.
Good Fundamentals,
Thanks,
St Gex
