Smoking Chicken Fish Bottom Smoking Chicken Fish has just stop hunted its all time lows . This could be a bottom for this coin . It needs to hold above the white line
Altcoinseason

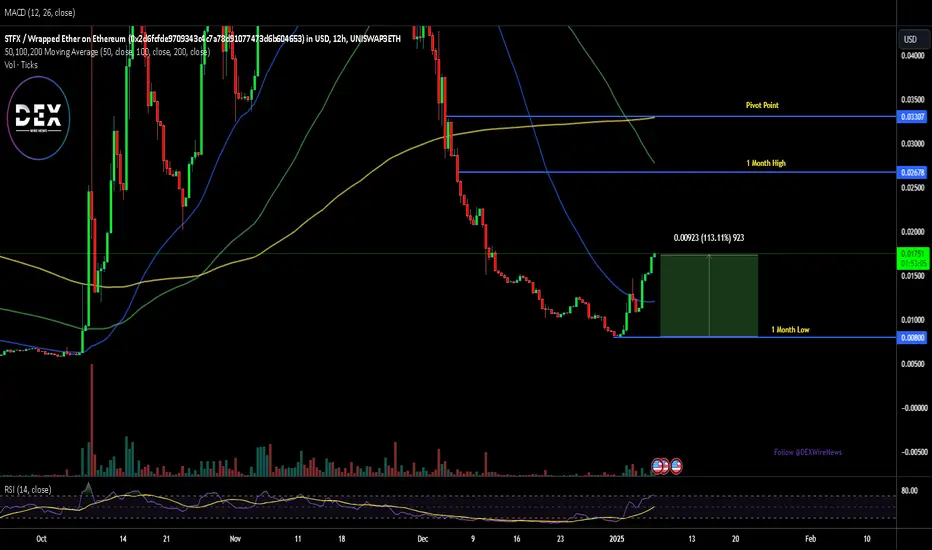
$STFX Up 116% in 7 Days—Is This the Next Big ETH Utility Token?The Ethereum-based memecoin $STFX has captured the attention of the crypto market, surging an impressive 116% over the past week. As the native token of the innovative STFX platform, $STFX combines the allure of DeFi functionality with the simplicity of memecoins, offering a unique proposition to traders and investors alike. With a hard-capped supply of 1 billion tokens and a current market capitalization of $11.2 million, $STFX may be positioned for explosive growth, both technically and fundamentally.
What Makes $STFX Unique?
$STFX powers the STFX platform, a decentralized ecosystem that introduces Single Trade Vaults (STVs). These DeFi vaults enable traders to propose trading strategies, raise funds from other users, and execute trades collaboratively. This model not only democratizes trading but also aligns incentives for both traders and investors.
Currently, $STFX operates across multiple blockchains, broadening its reach and usability. Despite its growing adoption, the token remains relatively under the radar, as it has not yet listed on any decentralized exchanges (DEXs) apart from MEXC. This presents a golden opportunity for early adopters to enter the market before institutional players and larger investors potentially drive up demand.
Technical Analysis
The daily price chart for $STFX indicates a bullish engulfing pattern—a strong reversal signal suggesting continued upward momentum. Complementing this, the Relative Strength Index (RSI) sits at 71.80, signaling bullish strength without entering extreme overbought territory.
Key technical levels include:
- Resistance: The pivot point lies above the one-month high, hinting at a potential breakout to higher price levels.
- Support: In the event of a correction, immediate support can be found at the one-month low of $0.008.
This technical setup suggests that $STFX may continue its upward trajectory, potentially breaching its previous highs as bullish momentum builds.
Growth Potential
With a current market cap of just $11.2 million, $STFX offers significant upside potential. If the token achieves a market cap of $50 million to $100 million—a realistic target given its innovative use case and growing popularity—early investors could see substantial returns.
The token’s unique utility within the STFX platform adds intrinsic value. As more traders adopt Single Trade Vaults and the platform gains traction, demand for $STFX is likely to increase. Additionally, the token’s hard-capped supply ensures scarcity, which could further drive price appreciation.
The Opportunity for Early Investors
$STFX’s limited presence on exchanges provides a window of opportunity for retail investors to accumulate the token before broader adoption occurs. With institutional interest in DeFi continuing to grow, $STFX’s innovative model could attract significant attention, potentially driving its market cap to new heights.
As of this writing, $STFX is trading within a bullish trend, up 13% on the day. For those looking to capitalize on its momentum, now might be the time to take a closer look at this emerging token.
Conclusion
The combination of $STFX’s innovative utility, strong technical indicators, and low market cap creates a compelling case for early investment. While risks remain—including the potential for short-term corrections—the long-term prospects for $STFX appear promising. As the platform’s adoption grows and the token gains visibility, $STFX could very well become a standout player in the Ethereum and DeFi ecosystems.
Investors should keep a close eye on $STFX’s technical and fundamental developments as it continues to carve out its niche in the rapidly evolving crypto landscape.
Altcoins by the Example of FIL and BTCThis chart compares the price structure of FIL (left) with BTC (right) from 2015/2016 to highlight similarities in price behavior.
The key observation is the accumulation phase where the price trades within a defined zone for an extended period, eventually breaking out with significant volume, indicating strength and demand.
After breaking out, the price typically retraces into an orange zone, a phase where many participants get burned due to their unrealized gains being lost quickly, often causing panic and liquidation. This retracement is frequently mistaken for a "suckers rally."
However, this orange zone marks the re-accumulation phase , where smart money enters again before the real price expansion begins. The current chart shows similar price behavior to what we saw in BTC in 2015/2016. Despite differences in liquidity and volume back then, the same pattern is visible.
As for a potential selling point, we are looking at May 2025 , although it's difficult to predict the exact peak of altcoins during this phase. The FIL chart essentially represents the broader altcoin market, as most altcoins exhibit similar structures and price movements.

Altcoins Have Broken Out - In Case You Didn't Notice.Crypto Fam,
In case you didn't notice, altcoins have officially broken out of our bearish descending wedge. I am expecting 2025 to be a bull year and through April you should really see some massive pumping take place, especially with high MC memecoins.
Don't forget that my cycle theory is different this bull market but so far has proven correct. That is: BTC is bullish first often in sync with Solana, Solana Memecoins, and often accompanied by AI based alts/memecoins. The we see other memecoins pumping with continued strength from AI based coins. And finally we see the OG classic ALT follow the train. This seems to be the trend. I don't expect anything different this year.
As it pertains to ALTS on this chart, you can see I have drawn some resistance right around 1.13T MC. I would expect some pause here and maybe a slight pullback before the bulls gain enough momentum to break through. Then onward and upward we should proceed through April. I'll re-assess the macro outlook for all of crypto at this point.
✌️ Stew

Ada breaking up out of a Bull pennant.Target for the pennant hound be around $1.86 . I also noticed the.bitcoin dominance chart’s 200ma looks like its finally flipping back to resistance which if so will increase the probability of ADA hitting this pennant target as well as alt season finally officially starting. *not financial advice*

PROSUSDT Analysis: Key Demand ZoneThe blue box on PROSUSDT is not just any region; it’s a carefully identified high-potential demand zone . This area could provide a strong reaction and is worth monitoring closely.
Key Points:
Strategic Demand Zone: Blue box highlighted as a significant area for potential reactions.
Follow-Up Required: Active monitoring is essential to capitalize on opportunities.
Confirmation Indicators: I will use CDV, liquidity heatmaps, volume profiles, volume footprints, and upward market structure breaks on lower time frames for validation.
Learn With Me: If you want to master how to use CDV, liquidity heatmaps, volume profiles, and volume footprints to pinpoint accurate demand zones, just DM me. I’d be happy to guide you!
Reminder: Always consider current market conditions when making decisions. Careful risk management and meaningful levels are key to success.
If you think this analysis helps you, please don't forget to boost and comment on this. These motivate me to share more insights with you! Wishing everyone success in their trades.
If you think this analysis helps you, please don't forget to boost and comment on this. These motivate me to share more insights with you!
I keep my charts clean and simple because I believe clarity leads to better decisions.
My approach is built on years of experience and a solid track record. I don’t claim to know it all, but I’m confident in my ability to spot high-probability setups.
If you would like to learn how to use the heatmap, cumulative volume delta and volume footprint techniques that I use below to determine very accurate demand regions, you can send me a private message. I help anyone who wants it completely free of charge.
My Previous Analysis (the list is long but I think it's kinda good : )
🎯 ZENUSDT.P: Patience & Profitability | %230 Reaction from the Sniper Entry
🐶 DOGEUSDT.P: Next Move
🎨 RENDERUSDT.P: Opportunity of the Month
💎 ETHUSDT.P: Where to Retrace
🟢 BNBUSDT.P: Potential Surge
📊 BTC Dominance: Reaction Zone
🌊 WAVESUSDT.P: Demand Zone Potential
🟣 UNIUSDT.P: Long-Term Trade
🔵 XRPUSDT.P: Entry Zones
🔗 LINKUSDT.P: Follow The River
📈 BTCUSDT.P: Two Key Demand Zones
🟩 POLUSDT: Bullish Momentum
🌟 PENDLEUSDT.P: Where Opportunity Meets Precision
🔥 BTCUSDT.P: Liquidation of Highly Leveraged Longs
🌊 SOLUSDT.P: SOL's Dip - Your Opportunity
🐸 1000PEPEUSDT.P: Prime Bounce Zone Unlocked
🚀 ETHUSDT.P: Set to Explode - Don't Miss This Game Changer
🤖 IQUSDT: Smart Plan
⚡️ PONDUSDT: A Trade Not Taken Is Better Than a Losing One
💼 STMXUSDT: 2 Buying Areas
🐢 TURBOUSDT: Buy Zones and Buyer Presence
🌍 ICPUSDT.P: Massive Upside Potential | Check the Trade Update For Seeing Results
🟠 IDEXUSDT: Spot Buy Area | %26 Profit if You Trade with MSB
📌 USUALUSDT: Buyers Are Active + %70 Profit in Total
🌟 FORTHUSDT: Sniper Entry +%26 Reaction
🐳 QKCUSDT: Sniper Entry +%57 Reaction
📊 BTC.D: Retest of Key Area Highly Likely
I stopped adding to the list because it's kinda tiring to add 5-10 charts in every move but you can check my profile and see that it goes on..

Binance’s Cease of Support for DYDX on Ethereum Raises ConcernsBinance’s recent announcement to end support for DYDX token deposits and withdrawals via the Ethereum (ERC20) network has triggered ripples across the cryptocurrency market. Effective February 12, 2025, this move has sparked debates about market stability, liquidity challenges, and the future prospects of DYDX, which is closely tied to the decentralized dYdX exchange.
Implications of Binance’s Decision
On December 31, Binance announced it will discontinue CRYPTOCAP:DYDX token transactions on the Ethereum (ERC20) network. While the exchange clarified that DYDX transactions would remain supported through other networks on its platform, the move has raised concerns among investors and traders. Notably, deposits made via the ERC20 network after the February 12 deadline will not be credited, creating potential risks of asset loss for users unaware of the changes.
This decision aligns with Binance’s ongoing efforts to optimize its network offerings, but it has sparked questions about the impact on DYDX’s liquidity and market position. Historically, Binance’s support decisions have significantly influenced token dynamics, with the recent addition of Phala Network (PHA) and dForce (DF) tokens leading to notable price surges.
In contrast, DYDX’s price reacted negatively to the announcement, dipping 2% to trade at $1.48. The token’s market cap currently stands at $1 billion, with a 24-hour trading volume of $37 million. This downturn underscores the sensitivity of the market to such announcements, especially for tokens heavily reliant on major exchange listings.
Technical Analysis
From a technical perspective, CRYPTOCAP:DYDX is showing signs of potential recovery despite the bearish sentiment. The token’s Relative Strength Index (RSI) currently hovers at 42, approaching the oversold region. This indicates a potential buying opportunity for traders anticipating a rebound.
Key support is identified at its 1-month low of $1.447, a critical level to watch for further price stability. On the upside, a reversal could see resistance at the 38.2% Fibonacci retracement level, a pivotal point for traders eyeing short-term gains.
In the broader context, DYDX’s 24-hour price range of $1.447 to $1.558 highlights a narrow trading window, suggesting cautious market activity. The dYdX exchange’s robust futures trading volume—$231 million over the past 24 hours—shows continued engagement, with BTC/USD and ETH/USD pairs leading at $94 million and $46 million, respectively. This robust trading activity provides a foundation for potential recovery, contingent on improved sentiment.
Market Dynamics and Future Outlook
Binance’s decision reflects a broader trend of network optimizations among major exchanges. While this strategy aims to streamline operations and enhance user experience, it inevitably impacts specific tokens. The divergence in market responses—DYDX’s dip versus the rally of tokens like PHA and DF—underscores the importance of exchange support in shaping token trajectories.
For CRYPTOCAP:DYDX , the coming weeks will be critical. The token’s ability to maintain liquidity and attract traders despite reduced support on Ethereum will determine its resilience. Investors should closely monitor updates from Binance and the dYdX exchange, as well as technical indicators like RSI and Fibonacci retracement levels, for informed decision-making.
Conclusion
Binance’s withdrawal of DYDX support on Ethereum highlights the evolving dynamics of crypto exchanges and their influence on token performance. While the immediate impact has been a price dip, DYDX’s technical setup suggests potential recovery opportunities. As the February 2025 deadline approaches, traders and investors must adapt to the changing landscape, leveraging both fundamental insights and technical analysis to navigate the market effectively.

DIAUSDT Analysis: Volume Spike with a Strong Demand ZoneDIAUSDT Analysis: Volume Spike with a Strong Demand Zone
Daily Volume Increase: DIAUSDT shows a significant 96% spike in daily volume, indicating heightened interest.
Volume-to-Market Cap Ratio: The 60% ratio suggests active trading relative to its market cap.
Blue Box Entry Zone: The blue box is identified as a meaningful demand zone for potential entries.
Confirmation Checklist:
Before entering, I will look for confirmations using:
Cumulative Delta Volume (CDV)
Liquidity Heatmap
Volume Profile
Volume Footprint
Upward Market Structure Breaks on Lower Time Frames
Additional Insights:
DIAUSDT is showing strong signals, but risk management remains crucial, especially in volatile markets. Entries in the blue box should be approached with confirmation for the best risk-to-reward ratio.
Learn Advanced Techniques:
Want to master entries like this? DM me to learn how to utilize CDV, liquidity heatmaps, volume profiles, and volume footprints effectively.
Final Thoughts:
The blue box provides a great entry opportunity for DIAUSDT. Stay patient and precise. Good luck trading!
If you think this analysis helps you, please don't forget to boost and comment on this. These motivate me to share more insights with you!
I keep my charts clean and simple because I believe clarity leads to better decisions.
My approach is built on years of experience and a solid track record. I don’t claim to know it all, but I’m confident in my ability to spot high-probability setups.
If you would like to learn how to use the heatmap, cumulative volume delta and volume footprint techniques that I use below to determine very accurate demand regions, you can send me a private message. I help anyone who wants it completely free of charge.
My Previous Analysis (the list is long but I think it's kinda good : )
🎯 ZENUSDT.P: Patience & Profitability | %230 Reaction from the Sniper Entry
🐶 DOGEUSDT.P: Next Move
🎨 RENDERUSDT.P: Opportunity of the Month
💎 ETHUSDT.P: Where to Retrace
🟢 BNBUSDT.P: Potential Surge
📊 BTC Dominance: Reaction Zone
🌊 WAVESUSDT.P: Demand Zone Potential
🟣 UNIUSDT.P: Long-Term Trade
🔵 XRPUSDT.P: Entry Zones
🔗 LINKUSDT.P: Follow The River
📈 BTCUSDT.P: Two Key Demand Zones
🟩 POLUSDT: Bullish Momentum
🌟 PENDLEUSDT.P: Where Opportunity Meets Precision
🔥 BTCUSDT.P: Liquidation of Highly Leveraged Longs
🌊 SOLUSDT.P: SOL's Dip - Your Opportunity
🐸 1000PEPEUSDT.P: Prime Bounce Zone Unlocked
🚀 ETHUSDT.P: Set to Explode - Don't Miss This Game Changer
🤖 IQUSDT: Smart Plan
⚡️ PONDUSDT: A Trade Not Taken Is Better Than a Losing One
💼 STMXUSDT: 2 Buying Areas
🐢 TURBOUSDT: Buy Zones and Buyer Presence
🌍 ICPUSDT.P: Massive Upside Potential | Check the Trade Update For Seeing Results
🟠 IDEXUSDT: Spot Buy Area | %26 Profit if You Trade with MSB
📌 USUALUSDT: Buyers Are Active + %70 Profit in Total
🌟 FORTHUSDT: Sniper Entry +%26 Reaction
🐳 QKCUSDT: Sniper Entry +%57 Reaction
📊 BTC.D: Retest of Key Area Highly Likely
I stopped adding to the list because it's kinda tiring to add 5-10 charts in every move but you can check my profile and see that it goes on..

BURGERUSDT Analysis: Strong Buy ZonesThe green line and blue box are highlighted as excellent buying opportunities for BURGERUSDT.
Key Insights:
Buy Zones: Both the green line and the blue box represent carefully selected areas with significant demand potential.
Market Positioning: Entering around these levels could offer a favorable risk-reward setup.
Patience and Confirmation: Wait for confirmation before executing trades to enhance success probability.
Confirmation Checklist:
Before taking a position, I will confirm using:
Cumulative Delta Volume (CDV)
Liquidity Heatmap
Volume Profile
Volume Footprint
Upward Market Structure Breaks on Lower Time Frames
Learn Advanced Trading Techniques:
Want to learn how to identify and trade these zones? DM me for insights on tools like CDV, liquidity heatmaps, and volume profiles.
Final Words:
Stay disciplined, manage your risk, and trade wisely. Best of luck in your trading journey!
If you think this analysis helps you, please don't forget to boost and comment on this. These motivate me to share more insights with you!
I keep my charts clean and simple because I believe clarity leads to better decisions.
My approach is built on years of experience and a solid track record. I don’t claim to know it all, but I’m confident in my ability to spot high-probability setups.
If you would like to learn how to use the heatmap, cumulative volume delta and volume footprint techniques that I use below to determine very accurate demand regions, you can send me a private message. I help anyone who wants it completely free of charge.
My Previous Analysis (the list is long but I think it's kinda good : )
🎯 ZENUSDT.P: Patience & Profitability | %230 Reaction from the Sniper Entry
🐶 DOGEUSDT.P: Next Move
🎨 RENDERUSDT.P: Opportunity of the Month
💎 ETHUSDT.P: Where to Retrace
🟢 BNBUSDT.P: Potential Surge
📊 BTC Dominance: Reaction Zone
🌊 WAVESUSDT.P: Demand Zone Potential
🟣 UNIUSDT.P: Long-Term Trade
🔵 XRPUSDT.P: Entry Zones
🔗 LINKUSDT.P: Follow The River
📈 BTCUSDT.P: Two Key Demand Zones
🟩 POLUSDT: Bullish Momentum
🌟 PENDLEUSDT.P: Where Opportunity Meets Precision
🔥 BTCUSDT.P: Liquidation of Highly Leveraged Longs
🌊 SOLUSDT.P: SOL's Dip - Your Opportunity
🐸 1000PEPEUSDT.P: Prime Bounce Zone Unlocked
🚀 ETHUSDT.P: Set to Explode - Don't Miss This Game Changer
🤖 IQUSDT: Smart Plan
⚡️ PONDUSDT: A Trade Not Taken Is Better Than a Losing One
💼 STMXUSDT: 2 Buying Areas
🐢 TURBOUSDT: Buy Zones and Buyer Presence
🌍 ICPUSDT.P: Massive Upside Potential | Check the Trade Update For Seeing Results
🟠 IDEXUSDT: Spot Buy Area | %26 Profit if You Trade with MSB
📌 USUALUSDT: Buyers Are Active + %70 Profit in Total
🌟 FORTHUSDT: Sniper Entry +%26 Reaction
🐳 QKCUSDT: Sniper Entry +%57 Reaction
📊 BTC.D: Retest of Key Area Highly Likely
I stopped adding to the list because it's kinda tiring to add 5-10 charts in every move but you can check my profile and see that it goes on..

LEVERUSDT Analysis: Strong Demand Zone IdentifiedThe blue box on the chart marks a significant demand zone , presenting a favorable opportunity for buyers.
Key Insights:
Demand Zone Potential: The blue box is a carefully chosen area with high potential for a market reaction, identified using techniques like volume footprint, liquidity heatmaps, and cumulative delta volume.
Entry Strategy: This zone aligns well for a potential buy setup if confirmation signals appear.
Market Context: Current market conditions demand patience and precise entries.
Confirmation Checklist:
Before taking a position, I will confirm using:
Cumulative Delta Volume (CDV)
Liquidity Heatmap
Volume Profile
Volume Footprint
Upward Market Structure Breaks on Lower Time Frames
Learn Trading Techniques:
Interested in learning how to identify and trade demand zones effectively? DM me for training on using CDV, liquidity heatmaps, volume profiles, and other professional tools.
Final Words:
Discipline and risk management are crucial in this volatile market. Stick to the plan and trade wisely. Best of luck!
If you think this analysis helps you, please don't forget to boost and comment on this. These motivate me to share more insights with you!
I keep my charts clean and simple because I believe clarity leads to better decisions.
My approach is built on years of experience and a solid track record. I don’t claim to know it all, but I’m confident in my ability to spot high-probability setups.
If you would like to learn how to use the heatmap, cumulative volume delta and volume footprint techniques that I use below to determine very accurate demand regions, you can send me a private message. I help anyone who wants it completely free of charge.
My Previous Analysis (the list is long but I think it's kinda good : )
🎯 ZENUSDT.P: Patience & Profitability | %230 Reaction from the Sniper Entry
🐶 DOGEUSDT.P: Next Move
🎨 RENDERUSDT.P: Opportunity of the Month
💎 ETHUSDT.P: Where to Retrace
🟢 BNBUSDT.P: Potential Surge
📊 BTC Dominance: Reaction Zone
🌊 WAVESUSDT.P: Demand Zone Potential
🟣 UNIUSDT.P: Long-Term Trade
🔵 XRPUSDT.P: Entry Zones
🔗 LINKUSDT.P: Follow The River
📈 BTCUSDT.P: Two Key Demand Zones
🟩 POLUSDT: Bullish Momentum
🌟 PENDLEUSDT.P: Where Opportunity Meets Precision
🔥 BTCUSDT.P: Liquidation of Highly Leveraged Longs
🌊 SOLUSDT.P: SOL's Dip - Your Opportunity
🐸 1000PEPEUSDT.P: Prime Bounce Zone Unlocked
🚀 ETHUSDT.P: Set to Explode - Don't Miss This Game Changer
🤖 IQUSDT: Smart Plan
⚡️ PONDUSDT: A Trade Not Taken Is Better Than a Losing One
💼 STMXUSDT: 2 Buying Areas
🐢 TURBOUSDT: Buy Zones and Buyer Presence
🌍 ICPUSDT.P: Massive Upside Potential | Check the Trade Update For Seeing Results
🟠 IDEXUSDT: Spot Buy Area | %26 Profit if You Trade with MSB
📌 USUALUSDT: Buyers Are Active + %70 Profit in Total
🌟 FORTHUSDT: Sniper Entry +%26 Reaction
🐳 QKCUSDT: Sniper Entry +%57 Reaction
📊 BTC.D: Retest of Key Area Highly Likely
I stopped adding to the list because it's kinda tiring to add 5-10 charts in every move but you can check my profile and see that it goes on..

EDUUSDT Analysis: Key Demand ZoneThe blue box in EDUUSDT marks a high-value demand zone , making it a strong candidate for potential entry points.
Key Highlights:
Blue Box Significance: This zone is carefully identified using CDV, liquidity heatmaps, volume profiles, and volume footprints , ensuring precision and reliability.
Risk Management: The general market conditions are still volatile. It's essential to confirm entries with upward market structure breaks on lower time frames.
Patience Pays Off: Waiting for a meaningful reaction within the blue box could lead to better opportunities.
Learn My Techniques: Want to master tools like CDV, liquidity heatmaps, volume profiles, and volume footprints to identify accurate zones? DM me, and I'll teach you step by step!
Support and Motivate: If you find this analysis valuable, please boost and comment. Your encouragement inspires me to share more insights!
If you think this analysis helps you, please don't forget to boost and comment on this. These motivate me to share more insights with you!
I keep my charts clean and simple because I believe clarity leads to better decisions.
My approach is built on years of experience and a solid track record. I don’t claim to know it all, but I’m confident in my ability to spot high-probability setups.
If you would like to learn how to use the heatmap, cumulative volume delta and volume footprint techniques that I use below to determine very accurate demand regions, you can send me a private message. I help anyone who wants it completely free of charge.
My Previous Analysis (the list is long but I think it's kinda good : )
🎯 ZENUSDT.P: Patience & Profitability | %230 Reaction from the Sniper Entry
🐶 DOGEUSDT.P: Next Move
🎨 RENDERUSDT.P: Opportunity of the Month
💎 ETHUSDT.P: Where to Retrace
🟢 BNBUSDT.P: Potential Surge
📊 BTC Dominance: Reaction Zone
🌊 WAVESUSDT.P: Demand Zone Potential
🟣 UNIUSDT.P: Long-Term Trade
🔵 XRPUSDT.P: Entry Zones
🔗 LINKUSDT.P: Follow The River
📈 BTCUSDT.P: Two Key Demand Zones
🟩 POLUSDT: Bullish Momentum
🌟 PENDLEUSDT.P: Where Opportunity Meets Precision
🔥 BTCUSDT.P: Liquidation of Highly Leveraged Longs
🌊 SOLUSDT.P: SOL's Dip - Your Opportunity
🐸 1000PEPEUSDT.P: Prime Bounce Zone Unlocked
🚀 ETHUSDT.P: Set to Explode - Don't Miss This Game Changer
🤖 IQUSDT: Smart Plan
⚡️ PONDUSDT: A Trade Not Taken Is Better Than a Losing One
💼 STMXUSDT: 2 Buying Areas
🐢 TURBOUSDT: Buy Zones and Buyer Presence
🌍 ICPUSDT.P: Massive Upside Potential | Check the Trade Update For Seeing Results
🟠 IDEXUSDT: Spot Buy Area | %26 Profit if You Trade with MSB
📌 USUALUSDT: Buyers Are Active + %70 Profit in Total
🌟 FORTHUSDT: Sniper Entry +%26 Reaction
🐳 QKCUSDT: Sniper Entry +%57 Reaction
📊 BTC.D: Retest of Key Area Highly Likely
I stopped adding to the list because it's kinda tiring to add 5-10 charts in every move but you can check my profile and see that it goes on..

Strong Alt Coins Season on the Horizon!
The total altcoin market cap has reached its previous all-time high (ATH) level of $1.15 trillion and faced rejection at the resistance level. Currently, the price is consolidating below the resistance line. A breakout above this level could generate bullish sentiment, potentially leading to a strong altcoin season following the $1.15 trillion resistance breakout.

ZKUSDT: Precision Demand Zone – Blue Box for High-Probability EnZKUSDT is presenting an excellent opportunity for traders with the blue box identified as a prime demand zone . This level has been meticulously analyzed, offering the most rational entry point for those aiming to trade with precision and strategy.
Why the Blue Box?
Carefully Selected Zone: The blue box is derived using advanced tools such as volume footprint, volume profile, cumulative delta volume (CDV), and liquidity heatmaps . It represents a key area where buyers are likely to step in.
Confirmation Process: Before entering, I will confirm the setup using CDV, liquidity heatmaps, volume profiles, volume footprints (to ensure buyer presence), and upward market structure breaks in lower time frames . This ensures a high-probability trade.
Calculated Strategy: The blue box stands out as the most logical entry for managing risk while seeking strong upside potential.
What’s Next?
With the blue box as a foundation, this setup provides a blend of risk management and potential reward. It’s a chance to trade strategically, avoiding impulsive decisions and focusing on precision.
Let’s Engage!
If this analysis helps you, please boost and share your thoughts in the comments! Your support motivates me to continue sharing high-quality insights.
Learn My Methods – Free of Charge!
Want to trade with this level of precision? DM me to learn how I use CDV, liquidity heatmaps, volume profiles, and volume footprints to pinpoint demand zones. I’m happy to teach these techniques completely free – let’s succeed together!
If you think this analysis helps you, please don't forget to boost and comment on this. These motivate me to share more insights with you!
I keep my charts clean and simple because I believe clarity leads to better decisions.
My approach is built on years of experience and a solid track record. I don’t claim to know it all, but I’m confident in my ability to spot high-probability setups.
If you would like to learn how to use the heatmap, cumulative volume delta and volume footprint techniques that I use below to determine very accurate demand regions, you can send me a private message. I help anyone who wants it completely free of charge.
My Previous Analysis (the list is long but I think it's kinda good : )
🎯 ZENUSDT.P: Patience & Profitability | %230 Reaction from the Sniper Entry
🐶 DOGEUSDT.P: Next Move
🎨 RENDERUSDT.P: Opportunity of the Month
💎 ETHUSDT.P: Where to Retrace
🟢 BNBUSDT.P: Potential Surge
📊 BTC Dominance: Reaction Zone
🌊 WAVESUSDT.P: Demand Zone Potential
🟣 UNIUSDT.P: Long-Term Trade
🔵 XRPUSDT.P: Entry Zones
🔗 LINKUSDT.P: Follow The River
📈 BTCUSDT.P: Two Key Demand Zones
🟩 POLUSDT: Bullish Momentum
🌟 PENDLEUSDT.P: Where Opportunity Meets Precision
🔥 BTCUSDT.P: Liquidation of Highly Leveraged Longs
🌊 SOLUSDT.P: SOL's Dip - Your Opportunity
🐸 1000PEPEUSDT.P: Prime Bounce Zone Unlocked
🚀 ETHUSDT.P: Set to Explode - Don't Miss This Game Changer
🤖 IQUSDT: Smart Plan
⚡️ PONDUSDT: A Trade Not Taken Is Better Than a Losing One
💼 STMXUSDT: 2 Buying Areas
🐢 TURBOUSDT: Buy Zones and Buyer Presence
🌍 ICPUSDT.P: Massive Upside Potential | Check the Trade Update For Seeing Results
🟠 IDEXUSDT: Spot Buy Area | %26 Profit if You Trade with MSB
📌 USUALUSDT: Buyers Are Active + %70 Profit in Total
🌟 FORTHUSDT: Sniper Entry +%26 Reaction
🐳 QKCUSDT: Sniper Entry +%57 Reaction
📊 BTC.D: Retest of Key Area Highly Likely
I stopped adding to the list because it's kinda tiring to add 5-10 charts in every move but you can check my profile and see that it goes on..

RADUSDT: %220 Daily Volume Spike – The Smartest Entry Revealed!RADUSDT is seeing a massive %220 daily volume spike , signaling an intense surge of activity. For those looking to capitalize on this momentum, the blue box zone represents the most rational and carefully chosen entry point.
Why This Matters:
The Blue Box Advantage: This zone has been meticulously selected using advanced tools like volume footprint, volume profile, cumulative delta volume (CDV), and liquidity heatmaps . It’s designed to pinpoint where buyers are likely to step in.
Confirmation Is Key: I will validate trades in the blue box using CDV, liquidity heatmaps, volume profiles, volume footprints (ensuring buyer presence), and upward market structure breaks in lower time frames .
Risk Management: While the opportunity is huge, the market still demands caution. Always maintain strict risk management rules.
Why Boost and Comment?
Your engagement motivates me to keep sharing such precise and actionable insights. If you find this analysis helpful, please don’t forget to boost and comment ! Let’s win together.
Want to Learn the Process?
I’m happy to teach anyone for free! DM me to learn how I use CDV, liquidity heatmaps, volume profiles, and volume footprints to find these high-probability zones.
If you think this analysis helps you, please don't forget to boost and comment on this. These motivate me to share more insights with you!
I keep my charts clean and simple because I believe clarity leads to better decisions.
My approach is built on years of experience and a solid track record. I don’t claim to know it all, but I’m confident in my ability to spot high-probability setups.
If you would like to learn how to use the heatmap, cumulative volume delta and volume footprint techniques that I use below to determine very accurate demand regions, you can send me a private message. I help anyone who wants it completely free of charge.
My Previous Analysis (the list is long but I think it's kinda good : )
🎯 ZENUSDT.P: Patience & Profitability | %230 Reaction from the Sniper Entry
🐶 DOGEUSDT.P: Next Move
🎨 RENDERUSDT.P: Opportunity of the Month
💎 ETHUSDT.P: Where to Retrace
🟢 BNBUSDT.P: Potential Surge
📊 BTC Dominance: Reaction Zone
🌊 WAVESUSDT.P: Demand Zone Potential
🟣 UNIUSDT.P: Long-Term Trade
🔵 XRPUSDT.P: Entry Zones
🔗 LINKUSDT.P: Follow The River
📈 BTCUSDT.P: Two Key Demand Zones
🟩 POLUSDT: Bullish Momentum
🌟 PENDLEUSDT.P: Where Opportunity Meets Precision
🔥 BTCUSDT.P: Liquidation of Highly Leveraged Longs
🌊 SOLUSDT.P: SOL's Dip - Your Opportunity
🐸 1000PEPEUSDT.P: Prime Bounce Zone Unlocked
🚀 ETHUSDT.P: Set to Explode - Don't Miss This Game Changer
🤖 IQUSDT: Smart Plan
⚡️ PONDUSDT: A Trade Not Taken Is Better Than a Losing One
💼 STMXUSDT: 2 Buying Areas
🐢 TURBOUSDT: Buy Zones and Buyer Presence
🌍 ICPUSDT.P: Massive Upside Potential | Check the Trade Update For Seeing Results
🟠 IDEXUSDT: Spot Buy Area | %26 Profit if You Trade with MSB
📌 USUALUSDT: Buyers Are Active + %70 Profit in Total
🌟 FORTHUSDT: Sniper Entry +%26 Reaction
🐳 QKCUSDT: Sniper Entry +%57 Reaction
📊 BTC.D: Retest of Key Area Highly Likely
I stopped adding to the list because it's kinda tiring to add 5-10 charts in every move but you can check my profile and see that it goes on..

OGUSDT %180 Daily Volume Spike | Watch Out!OGUSDT Analysis: Carefully Selected Blue Boxes
OGUSDT has seen a 182% daily volume increase , signaling heightened activity. While the chart appears volatile, I’ve marked blue boxes as logical and carefully chosen zones for potential entries.
Key Points:
Blue Boxes: These areas are determined using tools like volume footprint, volume profile, cumulative delta volume (CDV), and liquidity heatmaps .
Risk Management: Current market conditions are uncertain. Employ cautious and well-structured risk management.
Confirmation Indicators: Entries should be validated with CDV, liquidity heatmaps, volume profiles, volume footprints (with evident buyer activity), and upward market structure breaks in lower time frames .
If this analysis helps you, please don't forget to boost and comment. Your support motivates me to share more!
If you think this analysis helps you, please don't forget to boost and comment on this. These motivate me to share more insights with you!
I keep my charts clean and simple because I believe clarity leads to better decisions.
My approach is built on years of experience and a solid track record. I don’t claim to know it all, but I’m confident in my ability to spot high-probability setups.
If you would like to learn how to use the heatmap, cumulative volume delta and volume footprint techniques that I use below to determine very accurate demand regions, you can send me a private message. I help anyone who wants it completely free of charge.
My Previous Analysis (the list is long but I think it's kinda good : )
🎯 ZENUSDT.P: Patience & Profitability | %230 Reaction from the Sniper Entry
🐶 DOGEUSDT.P: Next Move
🎨 RENDERUSDT.P: Opportunity of the Month
💎 ETHUSDT.P: Where to Retrace
🟢 BNBUSDT.P: Potential Surge
📊 BTC Dominance: Reaction Zone
🌊 WAVESUSDT.P: Demand Zone Potential
🟣 UNIUSDT.P: Long-Term Trade
🔵 XRPUSDT.P: Entry Zones
🔗 LINKUSDT.P: Follow The River
📈 BTCUSDT.P: Two Key Demand Zones
🟩 POLUSDT: Bullish Momentum
🌟 PENDLEUSDT.P: Where Opportunity Meets Precision
🔥 BTCUSDT.P: Liquidation of Highly Leveraged Longs
🌊 SOLUSDT.P: SOL's Dip - Your Opportunity
🐸 1000PEPEUSDT.P: Prime Bounce Zone Unlocked
🚀 ETHUSDT.P: Set to Explode - Don't Miss This Game Changer
🤖 IQUSDT: Smart Plan
⚡️ PONDUSDT: A Trade Not Taken Is Better Than a Losing One
💼 STMXUSDT: 2 Buying Areas
🐢 TURBOUSDT: Buy Zones and Buyer Presence
🌍 ICPUSDT.P: Massive Upside Potential | Check the Trade Update For Seeing Results
🟠 IDEXUSDT: Spot Buy Area | %26 Profit if You Trade with MSB
📌 USUALUSDT: Buyers Are Active + %70 Profit in Total
🌟 FORTHUSDT: Sniper Entry +%26 Reaction
🐳 QKCUSDT: Sniper Entry +%57 Reaction
📊 BTC.D: Retest of Key Area Highly Likely
I stopped adding to the list because it's kinda tiring to add 5-10 charts in every move but you can check my profile and see that it goes on..

IQUSDT Analysis: Anticipating the Next MoveWe’ve seen incredible results from our previous analysis on IQUSDT. Check it out here: 🤖 IQUSDT: Smart Plan
Currently, the blue box appears to be the first potential reaction zone for price movements.
Key Points:
Previous Success: Our prior analysis yielded outstanding results.
Blue Box: Identified as the initial zone for potential price reaction and entry.
Confirmation Indicators: Before taking any position, I’ll confirm signals using CDV, liquidity heatmaps, volume profiles, volume footprints , and upward market structure breaks on lower time frames.
Risk Management: Be cautious and manage your risk, especially considering overall market conditions.
Learn With Me: Interested in mastering CDV, liquidity heatmaps, volume profiles, and volume footprints ? Just DM me to get started.
Support and Motivate: Found this analysis helpful? Don’t forget to boost and comment—it keeps me motivated to share more!
I keep my charts clean and simple because I believe clarity leads to better decisions.
My approach is built on years of experience and a solid track record. I don’t claim to know it all, but I’m confident in my ability to spot high-probability setups.
If you would like to learn how to use the heatmap, cumulative volume delta and volume footprint techniques that I use below to determine very accurate demand regions, you can send me a private message. I help anyone who wants it completely free of charge.
My Previous Analysis
🎯 ZENUSDT.P: Patience & Profitability | %230 Reaction from the Sniper Entry
🌊 WAVESUSDT.P: Demand Zone Potential
🟣 UNIUSDT.P: Long-Term Trade
🔵 XRPUSDT.P: Entry Zones
📈 BTCUSDT.P: Two Key Demand Zones
🌟 PENDLEUSDT.P: Where Opportunity Meets Precision
🔥 BTCUSDT.P: Liquidation of Highly Leveraged Longs
🐸 1000PEPEUSDT.P: Prime Bounce Zone Unlocked
🚀 ETHUSDT.P: Set to Explode - Don't Miss This Game Changer
🤖 IQUSDT: Smart Plan
⚡️ PONDUSDT: A Trade Not Taken Is Better Than a Losing One
🐢 TURBOUSDT: Buy Zones and Buyer Presence
🌍 ICPUSDT.P: Massive Upside Potential | Check the Trade Update For Seeing Results
🟠 IDEXUSDT: Spot Buy Area | %26 Profit if You Trade with MSB
📌 USUALUSDT: Buyers Are Active + %70 Profit in Total
🌟 FORTHUSDT: Sniper Entry +%26 Reaction
🐳 QKCUSDT: Sniper Entry +%57 Reaction
📊 BTC.D: Retest of Key Area Highly Likely
I stopped adding to the list because it's kinda tiring to add 5-10 charts in every move but you can check my profile and see that it goes on..

crv/usd crvusdtThe breakout of the descending triangle and the realization of its targets are shown on the chart

AAVE Breakout Incoming? Altcoin Sentiment Turns Bullish!AAVE/USDT is currently trading around the resistance zone, and we anticipate a breakout as the price has been holding these levels for several hours.
Additionally, the decline in BTC.D and USDT.D indicates a flow of money into altcoins, further supporting the potential for a bullish move in AAVE.
Keep an eye on the breakout for confirmation!

PYRUSDT Analysis: Active Buyers and High PotentialPYRUSDT has shown an 8% price increase in 24 hours , accompanied by an 80% daily volume spike . Buyers appear actively engaged , making the green line area and blue box strong potential entry zones. However, the current price level also offers an opportunity that shouldn’t be overlooked. This setup could deliver a high risk-reward ratio .
Key Points:
Volume Surge: An 80% daily increase highlights buyer interest.
Potential Entry Zones: Green line and blue box are valuable; current price is also a noteworthy entry.
Risk-Reward Potential: Offers a setup with significant upside potential.
Confirmation Indicators: I will use CDV, liquidity heatmaps, volume profiles, volume footprints, and upward market structure breaks on lower time frames for validation.
Learn With Me: If you want to master how to use CDV, liquidity heatmaps, volume profiles, and volume footprints to pinpoint accurate demand zones, just DM me. I’m happy to guide you!
Reminder: Be aware of the market's current state and approach it with caution. Successful trading relies on meaningful levels and robust confirmations.
If you think this analysis helps you, please don't forget to boost and comment on this. These motivate me to share more insights with you! Wishing everyone success in their trades.
If you think this analysis helps you, please don't forget to boost and comment on this. These motivate me to share more insights with you!
I keep my charts clean and simple because I believe clarity leads to better decisions.
My approach is built on years of experience and a solid track record. I don’t claim to know it all, but I’m confident in my ability to spot high-probability setups.
If you would like to learn how to use the heatmap, cumulative volume delta and volume footprint techniques that I use below to determine very accurate demand regions, you can send me a private message. I help anyone who wants it completely free of charge.
My Previous Analysis
🐶 DOGEUSDT.P: Next Move
🎨 RENDERUSDT.P: Opportunity of the Month
💎 ETHUSDT.P: Where to Retrace
🟢 BNBUSDT.P: Potential Surge
📊 BTC Dominance: Reaction Zone
🌊 WAVESUSDT.P: Demand Zone Potential
🟣 UNIUSDT.P: Long-Term Trade
🔵 XRPUSDT.P: Entry Zones
🔗 LINKUSDT.P: Follow The River
📈 BTCUSDT.P: Two Key Demand Zones
🟩 POLUSDT: Bullish Momentum
🌟 PENDLEUSDT.P: Where Opportunity Meets Precision
🔥 BTCUSDT.P: Liquidation of Highly Leveraged Longs
🌊 SOLUSDT.P: SOL's Dip - Your Opportunity
🐸 1000PEPEUSDT.P: Prime Bounce Zone Unlocked
🚀 ETHUSDT.P: Set to Explode - Don't Miss This Game Changer
🤖 IQUSDT: Smart Plan
⚡️ PONDUSDT: A Trade Not Taken Is Better Than a Losing One
💼 STMXUSDT: 2 Buying Areas
🐢 TURBOUSDT: Buy Zones and Buyer Presence
🌍 ICPUSDT.P: Massive Upside Potential | Check the Trade Update For Seeing Results
🟠 IDEXUSDT: Spot Buy Area | %26 Profit if You Trade with MSB
📌 USUALUSDT: Buyers Are Active + %70 Profit in Total
🌟 FORTHUSDT: Sniper Entry +%26 Reaction
🐳 QKCUSDT: Sniper Entry +%57 Reaction
I stopped adding to the list because it's kinda tiring to add 5-10 charts in every move but you can check my profile and see that it goes on..

PENGUUSDT Analysis: Balancing Risk and OpportunityPENGUUSDT has experienced an 85% daily volume increase , signaling rising interest. If you don’t want to miss out, the first area presents a decent entry. However, if you’re aiming to minimize risk, the lower area is a better option. Keep in mind that this coin is relatively new , making the risk higher. Personally, I risk half of my normal amount across both areas to balance opportunity and caution.
Key Points:
Volume Spike: 85% daily increase shows growing attention.
Risk Management: First area is for those who don’t want to miss out; the lower area is safer but with potentially fewer opportunities.
New Coin Warning: Higher risk due to the coin's limited history.
Confirmation Indicators: I will use CDV, liquidity heatmaps, volume profiles, volume footprints, and upward market structure breaks on lower time frames for validation.
Learn With Me: If you want to master how to use CDV, liquidity heatmaps, volume profiles, and volume footprints to find precise demand zones, just DM me. I’m happy to help!
Reminder: Be aware of the market's current state and approach it with caution. Successful trading relies on meaningful levels and robust confirmations.
If you think this analysis helps you, please don't forget to boost and comment on this. These motivate me to share more insights with you! Wishing everyone success in their trades.
I keep my charts clean and simple because I believe clarity leads to better decisions.
My approach is built on years of experience and a solid track record. I don’t claim to know it all, but I’m confident in my ability to spot high-probability setups.
If you would like to learn how to use the heatmap, cumulative volume delta and volume footprint techniques that I use below to determine very accurate demand regions, you can send me a private message. I help anyone who wants it completely free of charge.
My Previous Analysis
🐶 DOGEUSDT.P: Next Move
🎨 RENDERUSDT.P: Opportunity of the Month
💎 ETHUSDT.P: Where to Retrace
🟢 BNBUSDT.P: Potential Surge
📊 BTC Dominance: Reaction Zone
🌊 WAVESUSDT.P: Demand Zone Potential
🟣 UNIUSDT.P: Long-Term Trade
🔵 XRPUSDT.P: Entry Zones
🔗 LINKUSDT.P: Follow The River
📈 BTCUSDT.P: Two Key Demand Zones
🟩 POLUSDT: Bullish Momentum
🌟 PENDLEUSDT.P: Where Opportunity Meets Precision
🔥 BTCUSDT.P: Liquidation of Highly Leveraged Longs
🌊 SOLUSDT.P: SOL's Dip - Your Opportunity
🐸 1000PEPEUSDT.P: Prime Bounce Zone Unlocked
🚀 ETHUSDT.P: Set to Explode - Don't Miss This Game Changer
🤖 IQUSDT: Smart Plan
⚡️ PONDUSDT: A Trade Not Taken Is Better Than a Losing One
💼 STMXUSDT: 2 Buying Areas
🐢 TURBOUSDT: Buy Zones and Buyer Presence
🌍 ICPUSDT.P: Massive Upside Potential | Check the Trade Update For Seeing Results
🟠 IDEXUSDT: Spot Buy Area | %26 Profit if You Trade with MSB
📌 USUALUSDT: Buyers Are Active + %70 Profit in Total
🌟 FORTHUSDT: Sniper Entry +%26 Reaction
I stopped adding to the list because it's kinda tiring to add 5-10 charts in every move but you can check my profile and see that it goes on..

DOGS/USDT Near Oversold TerritorySEED_ALEXDRAYM_SHORTINTEREST1:DOGS /USDT is hovering near strong support at 0.0004800 after a sustained downtrend. RSI shows weak bearish momentum, with a potential for a rebound if support holds.
A breakdown below support could trigger further declines.
DYOR, NFA

Massive CRV pump coming....Go Long!!The DeFi sector is regaining momentum, and Curve's dominance in stablecoin liquidity remains unmatched. A long entry here.....Target - 5x-10x hold it till march

TOTAL3 - Altcoin Season DelayedCryptos are currently in correction mode, which could be a good time to accumulate.
TOTAL3 has an interesting setup, with the next relevant support at 765B-800B, which was the previous high in March 2024, and coincides with the daily SMMA (red line).
If we see a positive reaction in this area, we could at least retest the bearish trend line we have formed in the last few days.
I will update this idea as the setup develops.
