Bullish altcoin fractal - Total altcoin marketcap to grow 173%?Bitcoin has seen an exponential rise, and if you ask around in the crypto space, this would mean that altcoins bleed. However, I'm seeing a bullish fractal on the cards.
Bitcoin, depending on how you draw the descending channel lines, may or may not have broken out of the descending channel.
With the altcoins, it's very clear that it's broken out of the descending channel.
Also, near the start of the last altcoin boom, the 9 and 21 daily EMA crossed above the 55 EMA. Right now, the 9 EMA has already crossed and it looks like the 21 will soon follow.
The last altcoin boom lasted about 5 months, so, although past performance is not indicative of future results, could we see an altcoin season until the halving?
Altcoinstowatch


FTM/BTC Daily Entry and Targets 250% Potential gain.I'll be sharing the charts of my best picks for the upcoming bull run. Fantom is one of them and I'll start with this one. One of the most promising Altcoin on Binance is FTM. Fantom/BTC just broke below the reversal channel of a Rising wedge. We will wait for some more downside price movement and ladder in partially. No clear picture in RSI, MACD or other indicators yet. But still below the pivot point. Also trading below 50D and 21D MA.
ENTRY: 107 TO 125 (Ladder in with partial buys to average your entry) You know that no one knows the bottom. Better don't miss it, right?
Many good news are also on the table Means Fundamentals are very Strong,. This is one of my best bet for the upcoming bull run. MACD seems to have a bullish crossover soon. We will go a bit lower following a channel (Falling wedge) with a H&S Pattern. Breakout is imminent with this formation.
This is not a Financial Advise, please do your own research my ideas are for education purpose only.

Altcoin Market Bracing for Major Move - Bull Pennant?The Altcoin market has been beaten down for months, a minor relief rally at the start of 2019 has been followed by a slow grind lower for all but a select few names.
Undoubtedly the Altcoin market is poised for a major move, the direction is unclear, but the compression in this market is undeniable.
Big Picture: Left Chart
- Currently sitting at the 50 period Monthly EMA, this area acted as support during the initial bubble burst of 2018, it may act as support again, however if it fails, then it sets the Altcoins up for a major fall.
- Currently in what appears to be a bull pennant (trend continuation pattern), this pattern is likely to resolve soon, likely within no more than 2 to 3 months.
Compression: Top Right and Bottom Right Charts
- The top chart shows the weekly timeframe and highlights the current bullish divergence between the momentum indicator and the price action, this does lend SOME strength to the bullish argument.
- The bottom chart looks at the 3 day timeframe, the highlighted regions depict the prior instances of market compression and the resulting moves, this also highlights the need for caution, as these periods of compression can break in EITHER direction.
The fundamental supply and demand dynamic of the halvening, inflows of institutional money and the current extremely beaten down Altcoin market would tilt the scales in favor of the bulls, however, should this pennant break to the downside, which i would classify as a decisive close below the lower trend line AND 2 closes below the 50 period monthly EMA, then the downside could be quite dramatic.


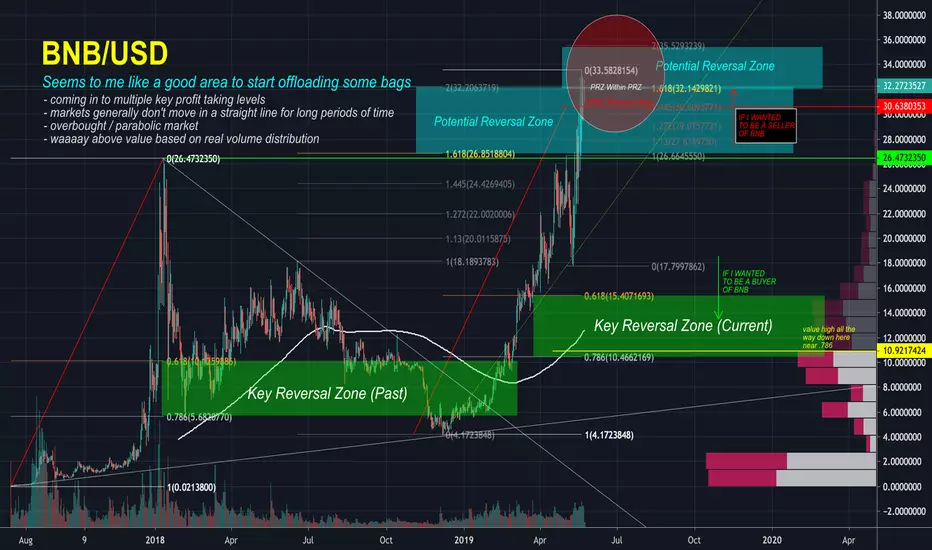
BNB Profit Taking Levels & Retracement Levels To Look For Just some quick analysis on BINANCE:BNBUSD BINANCE:BNBUSDC BINANCE:BNBUSDT
Seems to me like a pretty damn good location to start offloading some of your position.
- Coming in to multiple key profit taking levels. I.E. ABCD objectives, range extension reversal zones.
- Markets generally don't move in a straight line for long periods of time.
- Overbought / parabolic market.
- Waaaay above value based on real volume distribution. Real 'value' for this asset isn't until about $10.92 which lines up nice with a 78.6% retracement relative to the previous cycle's trough.
Not financial advice, but obviously if you're looking to make money in a market like this you really can't justify coming in and buying BNB right now. To me this looks like the end of the move more than the beginning of the move.
I'm NOT saying this is the top of the market. Not saying that at all. We could easily go higher. I'm just saying we're clearly in a parabolic market and coming in to levels where a lot of smart positions traders are selling.
If/when the market moves higher we'll need to readjust our fib levels to paint our Key Reversal Zones (green boxes) a bit larger and a bit higher.
Just my two cents. This isn't a trade setup. Just wanted to point this out on the BNB chart because its price action is quite different than all the other assets in the space.
Want to learn the basics of technical analysis, risk management, setups, and the fundamental principles of profitable trading? Check out our Level 1 course. Giving it away for free right now for Tradingview users to beta test over the next few weeks. Over 20 hours worth of content, brings you from the ground up and gets you analyzing charts like smart money.
Use discount code 'Tradingview' - learn more and get a free course preview here education.truebinary.io
Cheers,
FromTheEth
LINK FIB SPEED FAN RETRACEMENT based on RSI and market depth as well as resistance levels currently seen in the past 48 hours, this is my prediction. LINK for the next week at least has already topped.
lemme know what you think.

Altcoin bull run Cummings Soon, Altcoin MarketCap Analysis
We are doing Analysis of AltCoin MarketCap on 3 Day Timeframe.
I have Mention Support and resistance levels on Chart
Note: This is only for Educational Purpose this is not an Investment advice.
Please support the setup with your likes, comments and by following on Trading View.
Thanks
Adil Khan

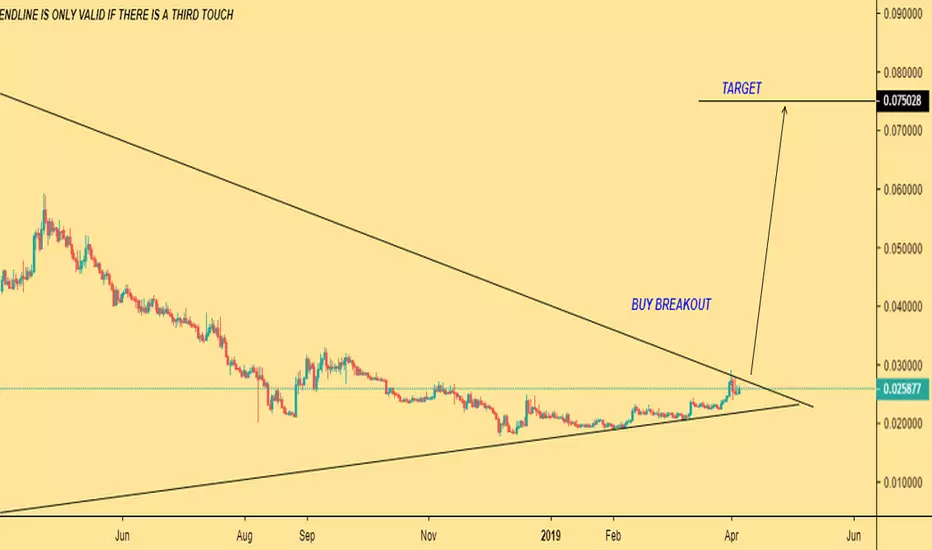
Breaking The Trend?Are we breaking the downtrend? As far as I'm concerned we have two trends to break: the one with steeper angle and another with more gentle angle. As you can see we can predict the timing of breakouts very accurately with straight lines. This graph shows that we have broke out of steeper angle trend and poked little bit of gentler one. In my book we need to haven't quite broke out of the downtrend yet. We sit on the 2017 September resistance levels which turned support in October. For that to happen we needed quite aggressive push to 6000+ and the rest is history. I'm waiting this to happen, but meanwhile I want to show you this portfolio management tool. You can see inverse correlation against other altcoins so it makes trading easier when you can track which coins are on downtrend and which are going up. It works in all time frames so it's valuable tool when it comes to trend analysis. Does not work in Binance, because apparently we TV doesn't have Binance support for this just yet. I'm working on making it support all coins. These are random coins to play with.

0x (ZRX) This is one of the more dormant alts that hasn't moved much compared to other mid-cap alts since Bitcoin price skyrocketed past $5.3k a few days ago. Expecting a good move pretty soon. Bullish Divergence and breakout of downtrend in the RSI.

SCUSD for a more complete viewSCUSD is a similar story to SCBTC, only in this pair Sia has made a lower low and has a more impressive accumulation range.
Still the short term bull flag is similar and the play similar. Break below this zone = GTFO. Otherwise it may be a fun ride.

Zilliqa ($ZIL)Clear inverse H&S and a little bullish divergence playing out here. With Zilliqa's official mainnet launch on March 31st, it's safe to say this looks primed for a leg up as it has been trending down recently.


DASHTechnically speaking it could pump, but it is all dependent on which way BTC will decide to go. Seeing momentum switch from Larger caps to Mid-cap coins, so although this setup looks good, I'm staying cautious with a tight stop on this one.

BINANCE COIN READY TO RALLY... AGAIN?This project has been one of the best preforming assets in this bear market so far. After a 3x+ move in the past few weeks/months, this coin still looks surprisingly bullish. Printing a bullish pennant and a bull flag on the RSI, it seems like Binance Coin has some gas for another leg up. After CZ, (CEO of Binance) has announced another Binance Launchpad ICO: Celer Network that will take place on 03/19/19, that you can only buy with BNB, I'm expecting some FOMO bullish movement again with the hype and great performances of the previous launchpad ICOs: Bittorrent, (pulled a 5x) and Fetch AI. Treading carefully, but this pullback can be a great entry for the next run.

ZILLIQA, WHICH WAY?one of the more quiet projects in this space. Mainnet launch by March 31st with some big news. Expecting some movement soon.
$ZIL
$BTC

Nano/BTC showing signs of bullishnessSFP formation observed on the daily, will be looking to long any retrace down to the open/close of previous daily candle and stop beneath the swing low wick. Targeting the clear S/R level marked in red

OMG 4HR Buy ZoneOMG approaching a key support level.
The purple lines are resistance/support.
The orange are the trend lines.
Here's a quick run down:
- Volume is looking good and is declining.
- MACD is looking to swing onto the bull side.
- Candles are still getting rejected to by the 10 EMA but despite that, all three of them are getting close to catching up with the 4 hr candles.
Most importantly though, the RSI tends to bounce from 25-30 and currently it's around 43 so it still has some ways to go. (I've been using RSI a lot more over the last few months as it's been very useful.)
The buy zone I've indicated between 1450 and 1370 is where I'm looking to scale in and buy some OMG.

ICX Short Term Play 4hrICX had a nice 22% bounce since the bounce from $7k. After some green days we are finally getting the pullback that is needed.
BTC is floating around $7.5k for the time being and can possibly retrace a little more around $7200.
That being said, a drop in BTC will result in a drop in alts.
This box that I've drawn is my buy zone and I have a few orders layered up.
Additionally, I'm looking to see if the candles hit the trendline which could signal a potential double bottom.
Things to add: Volume is declining signalling a potential break soon. RSI looks to bounce, historically, off the 20 or right above it.
