Ethereum Mid Week Update - Swing Long Idea📈 Market Context:
ETH remains in a healthy bullish structure. Despite the recent retracement, price action is still supported by strong demand zones on higher timeframes. No change in the overall sentiment from earlier this week.
🧾 Weekly Recap:
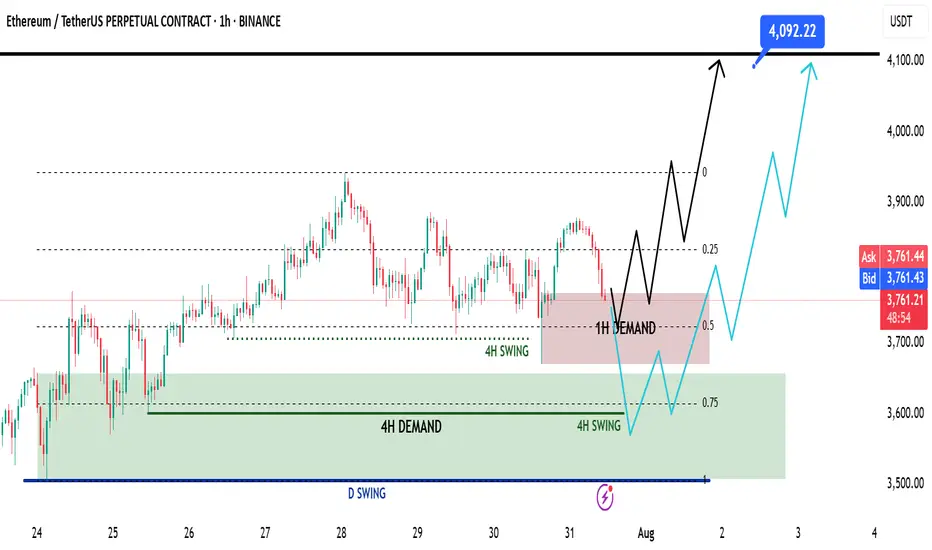
• Price rejected from the Fibonacci 0.5 EQ level — a discounted zone in my model.
• While doing so, it also ran 4H swing liquidity.
• After taking liquidity, ETH formed a 1H demand zone — a sign to look for lower timeframe confirmations for long setups.
📌 Technical Outlook:
→ Price has already tapped into the 1H demand zone.
→ From here, we have two possible scenarios:
Black scenario (ideal):
• Wait for 15M bullish break of structure (BOS).
• Enter after confirmation for long setups from 1H demand.
Blue scenario (deeper retrace):
• If no bounce from 1H demand, expect price to dip toward 0.75 Fib level (max discount).
• Watch for another liquidity run & 1H–4H demand formation.
🎯 Setup Trigger:
✅ 15M bullish BOS inside 1H or 4H demand zones
→ This would be the entry confirmation trigger for longs.
📋 Trade Management:
• Stoploss: Below the swing low of the 15M BOS
• Target: 4090$
💬 Like, follow, and drop a comment if this outlook helped — and stay tuned for more setups each week!
Altmarket
Total2 wants to inv h&s its way into completing its cup’s handleShould break above the neckline of this lemon lime colored inverse head and shoulder pattern in the upcoming 1-3 weekly candles here, and we are likely less than a week a way from the daily chart golden cross (not shown here). The breakout target from this inverse head and shoulder pattern will take price above the rimline of the larger cup and handle pattern and upon triggering the breakout from that we head to the light blue erasure move target which fro where price action currently is is about a 100% gain for the alt racket which should confirm alt season. *not financial advice*

Wyckoff Pattern- To understand trading at its core, you need to understand the Wyckoff Theory.
- Everything you need is in the chart and yes, it's simple and might look like copy-paste, but it's pure Wyckoff.
- Remember this post i made in 2021 ? check it again :
Remember, trading is like a washing machine, it shakes you up, spins you around, and pressures you to sell when you should be buying or Holding.
Not a price prediction, just a smarter way to level up your strategy.
Happy Tr4Ding !

Market3I haven’t been posting much lately simply because there’s nothing particularly interesting to say, the market has been a bit dull.
2025 should be a strong year for altcoins, as they’ve been consistently suppressed. With BTC dominance reaching 64%, which is quite significant, all attention remains on Bitcoin.
On this chart, you can see that $1.17 trillion acted as a rejection level for the crypto market (excluding BTC and ETH). Time will tell, but I anticipate a $4 trillion altcoin bull market before the end of 2025.
Remember, Fibonacci plays a crucial role in long-term market predictions.
Invest wisely and at the right time.
Happy Tr4Ding !

ALTSEASON Party like 2021 is about to start.This is the unique ratio of the crypto total market cap excluding the top 10 against Bitcoin.
The market is consolidating for 7 straight weeks after rebounding on the top of the former Triangle of the previous Cycle.
Basically it this bearish leg is almost identical to October-December 2020. This kickstarted the Altseason of 2021.
We expect a similar altcoin rally to start as in 2021.
Follow us, like the idea and leave a comment below!!

TonCoin- Eliminate the useless, keep the essential.
- imo Toncoin looks bottomed, but remember, crypto moves fast, if BTC dips, altcoins usually follow harder.
- That said, for now, I don’t see altcoins dropping further; they sound to be not far from a rock bottom.
------------------------------------------------------------------
Simple Trade Strategy :
------------------------------------------------------------------
- Buy now around 3$
- Keep some juice to DCA more around 2.30$
------------------------------------------------------------------
TP : 5.50$
SL : 1.95$
------------------------------------------------------------------
Play Wisely !
Happy Tr4Ding !

The Others UpdateThe market is testing your patience, trying to shake you out so they can buy back at a lower price. Stay strong and hold your ground.
Observe the chart carefully, a perfect double bottom was formed earlier, while now the RSI remains elevated, signaling potential strength in Altcoins.
As always, the crypto market will move faster than you can react.
Happy Tr4Ding !

$XRP sellers missing gains. Don’t fall for the “sold my XRP I’m done” posts..
Look at the RSI we’re in an over sold area heading up into the over brought area.
So really you buy the over sold and sell the over brought areas aka sell high RSI buy lower RSI.
That’s just one way to note potential entry or exit points.
CRYPTOCAP:XRP isn’t done why? CRYPTOCAP:ETH and CRYPTOCAP:BTC aren’t done.

SUI UPDATE - 12.01.2025 / Local long setup1d: sensible flow of orders to Long, looks beautiful
1h: there is synchronization with senior tf, also good!
Not a bad chart for futures
Observe the risks and think with your head!

CAKE SWING LONG IDEAI know everyone is fearful in the crypto market right now.
People are scared to buy at these lows because they believe Bitcoin will likely continue to decline. And yes, that could happen. But guess what?
BTC is sitting on daily support.
BTC dominance hit 60% and is possibly forming lower highs (check my BTC DOM analysis).
The Fear Index is at 54—people are scared.
Funding rates are extremely negative.
Most assets' RSI levels are oversold (in a bull market!).
All these factors tell me it’s the perfect time to open swing long positions while everyone else is panicking and selling their coins at the lows.
All these factors tell me it’s the perfect time to open swing long positions while everyone else is panicking and selling their coins at the lows.
Let’s look CAKE as an example:
Cake has currently hit the monthly and weekly demand zones. It has rejected the weekly demand and broken the 4H structure.
We’ve seen strong upside movement following this, confirming the second leg of the higher high formation on the 4H timeframe.
TARGETS:
TP1: $3.41
TP2: $4.02
TP3: $4.50
SL: Below $2.05 (daily close)

TAO SWING LONG IDEA I know everyone is fearful in the crypto market right now.
People are scared to buy at these lows because they believe Bitcoin will likely continue to decline. And yes, that could happen. But guess what?
BTC is sitting on daily support.
BTC dominance hit 60% and is possibly forming lower highs (check my BTC DOM analysis).
The Fear Index is at 54—people are scared.
Funding rates are extremely negative.
Most assets' RSI levels are oversold (in a bull market!).
All these factors tell me it’s the perfect time to open swing long positions while everyone else is panicking and selling their coins at the lows.
Let’s take TAO as an example:
We’ve hit a key SR level.
The election swing lows have been raided.
A 4H bullish HTF shift has occurred—this is my confirmation.
Entry: $455
SL: $355 (closing daily below)
TP: ATH - $750
Good luck! And remember: buy when they’re scared, and sell when they’re greedy.
-AS ALWAYS, MANAGE YOUR RISK-

XRP Update - 11.12.2024 / Local Long idea Formed liquidity withdrawal from below also structure change and imbalance!
Planning to work in Long on order flow!
Observe risks and think with your head!

Bonk can pump 82% if it validated the bullflag bullish breakoutNo guarantee this pattern will break out, it could also extend the consolidation and morph into a completely different pattern, but at the moment it seems the best probability is a breakout upward considering we are only 1 big chart pattern breakout into the current long awaited altcoin market uptrend. *not financial advice* Please bonk responsibly.

JITO - JTO ALTCOIN POSSIBLE SWING LONG ZONEI believe we came possible swing long zone for JTO. It is one of my favorite Solana crypto coin. I added some spot and futures positions from here.
We may see all the way up till to ATH of the coin. But i will be looking first to take profits from the purple line.
Whatever i share is not a financial advice and do not risk more than you cannot afford.

ALTCOINS The alt season has officially begun.This is a clear technical representation of the altcoin market (total capitalization excluding top 10 coins) on the 1W timeframe that shows that we are on the 3rd week of the new alt season, which is the strongest rally of the Cycle. You can see all 3 Cycles so far and the common characteristics they share.
It all starts when the previous Bull Cycle peaks and the Bear Cycle starts, which is confirmed after the price crosses under the 1W MA100. Then a prolonged accumulation phase starts and when the 1W RSI bottoms it starts forming HL. A price crossing over the 1W MA100 again, coincides with an overbought 1W RSI, which confirms the start of the new Bull Cycle. After a Bitcoin's Halving, the alts market forms a Bull Flag and when the 1W RSI hits the HL and rebounds, the alt season starts.
The chart shows that we are on this stage at the moment. This is practically one of the very last opportunities you have to buy.
## If you like our free content follow our profile to get more daily ideas. ##
## Comments and likes are greatly appreciated. ##

The Others Part 3- 6M Timeframe Simple Update:
- Divergences are the ultimate tool for timing entries.
- Think long-term—play the big picture.
- Keep DCA’ing into altcoins for stronger positioning.
- Exercice more patience and be ready for the rush.
- Buy before the moon move, sell at the moon.
Happy Tr4Ding !

A close up of the bullflag forming above c&h rimline on total2The red line is the rimline of the Total2 chart’s cup and handle pattern that I made a post about a few days ago and will link at the bottom of this post. I thought it would be a good idea to include a close up of this bull flag that is forming with that redline mostly serving as support here so it would be easier for people to see when the breakout from the cup and handle will be validated. Once we have solidified the red line as support long enough we will validate the breakout from the cup and handle. One thing that will greatly increase the probability that w will validate that breakout is by first valdating the breakout up from this smaller bullflag pattern that has been forming here, you’ll notice that we are also about to have a golden cross (when the orange line crosses above the blue line ). We are now just one to two days away max from that cross happening and I would not be surprised if the pump up from the bullflag that validates it’s breakout occurs the same day the golden cross occurs, as I have already seen that happen immediately on the golden cross in two other chart recently, and it usually tends to do so once we have entered the parabolic phase of the bull market. If we do we will simultaneously validated both the breakout from this bull flag and mostly likely validate the breakout from the more macro timeframe Cup and handle pattern as well. I will link the chart I posted a few days ago showing the full cup and handle pattern down below. We’ve already seen a slight bit of a precursor already in the market but once the cup and handle validates its breakout, it is officially alt season. *not financial advice*

The Altcoin Market Is Now Flirting With The 350 DMA ...Again!Here's what that means. A long-term view.
Traders,
The pressure is on for these altcoin bulls to run through the end of the year. However, we are flirting with disaster this time around. Here's why?
From the beginning, the 350 DMA (or 50-week MA) has always told traders whether we were in a bull market or a bear market. Though periodically, the price did stick its proverbial head above the 350 DMA during mid-cycle tops, these were always very short-lived. And it's always been the case that when we've remained above the 350 DMA for this length of time, in this case since Nov of 2023, it signaled we were in a bull run, as opposed to a mid-cycle top. Could this time be different? Well, of course. And I think from looking at the charts, it already has proven it is. This whole run is different.
I won't get into the many ways this cycle is different, but a big one has to do with how the 111 DMA is diverging from the 350x2 DMA (not pictured here). That's never happened before along with a multitude of other occurrences. So, let's explore this thought experiment a bit further. There are several outcomes that we most probably are looking at.
The first outcome could mean that this run was simply an extended mid-cycle top. If true, then this is a much longer mid-cycle top than we have ever witnessed in the history of crypto. And if that is true, the bull run that is coming will melt faces. But it probably would not arrive until next year or even 2026 and it probably means that we dip back under that 350 DMA again for a while. Nobody wants this to happen and nobody seems to be expecting this outcome. Could this then be the strongest possibility? If we anthropomorphize the market a bit, we can observe that it is rather sadistic in this regard. It always has been and probably always will be. The market just enjoys hurting the largest crowd. This is why it's often beneficial to entertain contrarian thought and not to simply dismiss it altogether.
The second outcome is not so good. It could mean that we skipped our mid-cycle top completely and that our bull run is about to end if we dip below that 350 DMA. Now, there is still hope here because we haven't done that yet. But I certainly do not like the looks of how we have been flirting with that line for these last several months. This moving average is critical! Watch it closely on both the daily (as a 350 DMA) and on the weekly (as a 50). The weekly will confirm whether we drop or not. It must be confirmed with two candle closes below on the weekly.
There is a third possibility. This is the one that I think we are all hoping for and, tbh, most are expecting. It also indicates that we skipped our mid-cycle top and are in a bull run that will not end until late this year or into the next. This would mean that we will remain above that 350 DMA (though, there could be a few candle closes below) and that we should see some new highs being made through the end of the year.
I kept our chart on the daily view as opposed to the weekly because I wanted you all to track that bullish triangle with me. Notice how we are retesting the top of it as we should after a breakout. This is technically very sound. But also notice how that 350 DMA is moving up to lend some support. What a beautiful area of confluence! But also, scary. Because if it's broken to the downside, it may indicate either another Black Swan event on the horizon OR we don't get the bull run alts were expecting.
It is do-or-die time now. Let's go.
Stew

Altcoins W pattern- Fast update
- All in graphic like always.
- if Altcoins breakout this range.
- the speed of the acceleration could be surprising.
- DYOR " W pattern ".
Happy Tr4Ding !

A non log version of total2 c&h & bullflag on the 1month chartBecause the log chart target for the entire bull flag on total2 was so astronomically high I though it ma be wise to also post a linear vhart version as I knew it would have much smaller measured move targets. So here it is.The targets on the linear version of the flag seem far more attainable for the alt market this bull run than the log chart bullflag breakout target does. I do think the log charts flag target can initially be hit but very unlikely this current bull market. *not financial advice*

Altmarket Total2 weekly log chart about to have a golden crossShown here is the channel/bullflag and the cup and handle the weekly total2 log chart’s price action has ben forming. It is now forming the handle portion of the cup and handle ad we can see we are about to experience a golden cross of the weekly 50(orange) and 200(blue) MAs in the next couple weeks or so. If the weekly 50ma can hold support then odds are good this thing can break up from its cup and handle and flag maybe by august or september. Possibly sooner possibly later but for now the breakout point of this handle and flag must remain speculative until we see a validation of a breakout. I roughly estimated a width for the handle by factoring in the weekly 50ma being able to hold support. If the weekly 50ma lost support I would then look for the monthly 50ma(not shown here ) to be the ultimate support. Some exciting targets here for the total2 alt coin market once these patterns validate their breakout. The cup and handle certainly seems like an attainable breakout target for the current bull cycle. The entire flag target seems like it could maybe potentially take 2 bull racket cycles to reach, however, If the 17 trillion target on the regular total cryptocap chart can be reached this current bull market. It’s possible that the high target on this chart could be reached this cycle too…this would likely only be if a currency like XRP, solana,link or possibly a mixture of them all suddenly took a lions share of the total market cap away from bitcoin..which seems unlikely…but if for some reason xrp was given for regulatory clarity once the sec ripple case was resolved, there is a chance all the financial institutions could start piling into it with as much ferocity as they currently have been doing with bitcoin….if so, the upper breakout target on this total2 chart could then be completely attainable in the current bull run. For now though I’m only setting my sights on the c&h target for total2. Will update the c&h target more precisely once a breakout point is established. *not financial advice*

The Others- So you have BTC.D, ETH.D and you have also " The Others".
- There's plenty of other fish in the ocean.
- This is just a Fibo analysis but a bit advanced chart.
- Make your own diligences and learn about fibonacci trading strategy.
- All Fibos retracements and extensions are annotated in the chart.
To keep it basic like always :
- the most interesting thing to follow right now in this chart is :
- " The Yellow zone making a Triangle ".
- Be confident and Hodl steady.
Happy Tr4Ding !

ALTS Exciting time to be invested in the crypto market.The altcoin market is one of the markets that deserves our attention as we close 2023 and start the new year. We have been mentioning that on numerous analyses but the current idea couldn't display it in a simpler, yet more informative way.
As you see this is the total market cap excluding Bitcoin (TOTAL2) on the 1M time-frame. The 1M MA5 (blue trend-line) is about to cross above the 1M MA20 (green trend-line) and form the first such Bullish Cross pattern since April 2020. The only time besides this one that we had such pattern formed was on February 2016. What followed after both sequences was insane parabolic rallies, what is known in the market as 'altseason'. The 1M RSI patterns of the current and the previous Cycle are identical, starting with Lower Highs and now pointing to the exact symmetrical level of April 2020 as the RSI is taking off.
Insane alt season just starting?
-------------------------------------------------------------------------------
** Please LIKE 👍, FOLLOW ✅, SHARE 🙌 and COMMENT ✍ if you enjoy this idea! Also share your ideas and charts in the comments section below! This is best way to keep it relevant, support us, keep the content here free and allow the idea to reach as many people as possible. **
-------------------------------------------------------------------------------
💸💸💸💸💸💸
👇 👇 👇 👇 👇 👇
