ALTS attempting to break the 2 year Falling Wedge!The Crypto Total Market Cap excluding Bitcoin, has been trading within a Falling Wedge pattern for the past 2 years. Being kept from breaking above the 1W MA50 (blue trend-line) for three straight weeks, it appears that as the 1W MA200 (orange trend-line) continues to support, it will start to squeeze the price action and most likely will cause a break upwards as in May 2019. First target of the Falling Wedge break-out is the 0.5 Fibonacci retracement level at 860. Alts are heating up!
-------------------------------------------------------------------------------
** Please LIKE 👍, FOLLOW ✅, SHARE 🙌 and COMMENT ✍ if you enjoy this idea! Also share your ideas and charts in the comments section below! **
-------------------------------------------------------------------------------
💸💸💸💸💸💸
👇 👇 👇 👇 👇 👇
Altmarket

MARKET UPDATE Hi guys, This is CryptoMojo, One of the most active trading view authors and fastest-growing communities.
Consider following me for the latest updates and Long /Short calls on almost every exchange.
I post short mid and long-term trade setups too.
Let’s get to the chart!
I have tried my best to bring the best possible outcome to this chart, Do not consider financial advice.
Hi guys, This is CryptoMojo, One of the most active trading view authors and fastest-growing communities.
Consider following me for the latest updates and Long /Short calls on almost every exchange.
I post short mid and long-term trade setups too.
Let’s get to the chart!
I have tried my best to bring the best possible outcome to this chart, Do not consider financial advice.
#BTC UPDATE
BTC is forming this big falling wedge pattern
what is a falling wedge pattern?
The falling wedge is a bullish pattern . Together with the rising wedge formation, these two create a powerful pattern that signals a change in the trend direction. Generally, a falling wedge pattern is considered a reversal pattern, although there are examples when it facilitates a continuation of the same trend.
A weekly candle close above 25k could suggest that the market is expecting a bullish trend.
So let's see how the weekly candle closes
* RSI is also sowing some bullish divergences move
#USDT.D UPDATE
We are a few hours away from the weekly close and we can literally see where the market is possibly heading. With the USDT.D bouncing back from the support line and BTC at the resistance, I would highly suggest staying away from leverage trading for now and wait for the market to cool off. If the bounce back is so good to be true then we can expect the USDT.D to reach close to 7.2% resistance. If not then 6.4% is good support for the dominance.
TOTAL 2 UPDATE
We are a few hours away from the weekly close and we can literally see where the market is possibly heading. With the USDT.D bouncing back from the support line and BTC at the resistance, I would highly suggest staying away from leverage trading for now and wait for the market to cool off. If the bounce back is so good to be true then we can expect the USDT.D to reach close to 7.2% resistance. If not then 6.4% is good support for the dominance.
This chart is likely to help you make better trade decisions if it does consider upvoting it.
I would also love to know your charts and views in the comment section.
This chart is likely to help you make better trade decisions if it does consider upvoting it.
I would also love to know your charts and views in the comment section.
Thank you

#ALT MARKETCAP Hitting a Major Resistance. What's Next ??ALT MARKEPCAP is hitting the resistance right now.
This is a threshold point for the alt market.
If the index breaks this resistance alts will pump along with BTC.
I will keep this chart updated follow me for more.
Hit the like button if you like it and share your views in the comment section.
Thank you
#PEACE

Altmarketcap usd 1 weekAltmarketcap usd 1 week
dollar mollar
hadi
to the moon
hedef 2024
dayısı ajan

ALT Market About To BreakALT Market (Excl. BTC & ETH) is looking primed for a breakout with some narrow consolidation forming for almost a month now. Expecting a large break out coming out of this symmetrical triangle. It will be very dependant on the global macro economics and announcements to dictate this next move

ALT M.CAP IS TRYING TO BREAK OUT!!Hello everyone, if you like the idea, do not forget to support with a like and follow.
Welcome to this TOTAL2 (Alt M.cap) update.
Total2 is forming a symmetrical triangle in the daily time frame. Currently, it is at the resistance trendline. Also, there is a 100MA. All we need is a close above the triangle and 100MA for a perfect breakout.
If it gives a perfect breakout then August will be very good for ALtcoins. We might see an 80-100% pump in many Alts. As of now waiting for a breakout.
Support:- $590B
If you like this idea then do support it with like and follow.
Also, share your views in the comment section.

Alt market wants to explode to 2.4 trillionIn order to do so however it must first break out o this cup and handle pattern it has been forming. Many alts at the moment including Ethereum and Tezos are in similar cup and handle patterns. Just waiting on price action to firmly break above the rimline o the cup and lip it to solidified support first before we can confirm the breakout. It could take it’s sweet time locating just under the rimline for multiple daily candles before I ally breaking above. It could be as early as tomorrows candle or it could be multiple weeks away still. Whales may very well be waiting until they see a bunch of people flipping their alt holdings into btc before they finally try to trigger the total2 c&h breakout. Either way, I don’t anticipate most alts currently in a c&h having their breakout until we see the total 2 chart confirm its breakout. My guess is we will see the breakout sooner rather than later as I anticipate the 1 day 50ma(in orange) will maintain solid support and help to lift price action above the rimline and keep it there.

Alt Market Golden Cross, Beating Consolidation TrendThe alt market is looking really bullish. The market cap reads above the consolidation trend shown above on the 15m chart, and we see a golden cross closely approaching fruition between the 180ma and the 9ma. The visible range will give us levels of guidance as we see inflow/outflow accordingly. Good luck traders!
Disclaimer: These are my opinions posted for educational and entertainment purposes only. This is not financial, nor investment advice. I hope you all make tons of money, however I am not responsible for financial loss. This is one of the most volatile markets out there. DYOR

Up before EOY...We could've expected the short term drop in prices according to where we are. Holding tight and waiting for December. Let's print the right shoulder to this massive inverse H&S. Quick breather - September is normally a down month, anyways...

Alt Market Cap Analysis - upcoming opportunitiesHello buddies, how are you?
No need to explain about Alts for what happening over the past couple of days. We had seen huge red candles on the overall market. But most of us did not even imagine that the market will fall that much. So presenting you my thought on the current Alt market cap is what am seeing right now.
- In the chart, you can spot Pitchfork which I drew from the recent top. It was presenting index can be in short term or maybe long term downtrend.
- You can closely look into the pattern, every resistance and support line was working well, price action in this pattern was so much accurate.
For now....
- In the chart, you can see one dotted trendline which was the retest point of the index before moving upward and one red trendline named 'trigger line', yes the index broke this red trendline and the current price action is above this trendline. And what is that means is the price(index) has broken its downward momentum. Technically we may see an index at the green line soon which will be the C point of a pitchfork. If the index followed this pattern as it did in the past then there's a high possibility of relief in the alt market cap. As always we trade on possibilities so make sure you keep in mind every factor of the market and trade accordingly.

TOTAL2 Updateprice in Triangle holding trend line support very well if hold above this support than it can move higher from here
190 billion should hold for next move in alt coin
breakout above or breakdown

Total2 200 Billionalt coin market is ready to blast with huge 200 Billion volume time to add all the dips and on bitcoin pump dump no need to worry about stop finally .

5 days left for the confirmation candle to close above neckline.Only 5 days until monthly candle close and it's currently still above the double bottom neckline here a monthly close above the neckline would be a very bullish outcome imo. This is the chart for the alt coin market.
Monthly Candle Closes Above the TOTAL2 Chart's Dbl Bttm NecklineThe monthly double bottom pattern on the TOTAL2(Alt Market) has finally gotten it's first monthly close above the neckline. There are 2 possible necklines here a descending one(notated by a dotted yellow line) and a horizontal one (orange yellow). Both price targets for a breakout from each neckline are listed. Not quite sure which one is more legit but we are now on our follow up confirmation candle on the monthly chart. Probability of a confirmed breakout has greatly increased here but we should be prepared for a retest of the neckline and also a smaller possibility of a fakeout just in case.

If Double Bottom confirms Alt season is officially on!we are currently retesting the neckline of this double bottom as support. If it confirms, the altmarkets total cap value has a breakout target rise of over 70%. Need to see the current weekly candle close above the neckline. It appears a weekly goldencross is on the horizonhere so that should help increase the probability of the breakout. Untilwe see where the current weekly candle closes however a fakeout is still possible. Leaning bullish enough however to mark this idea long although as always that is -not- financial advice. Thanks for reading!

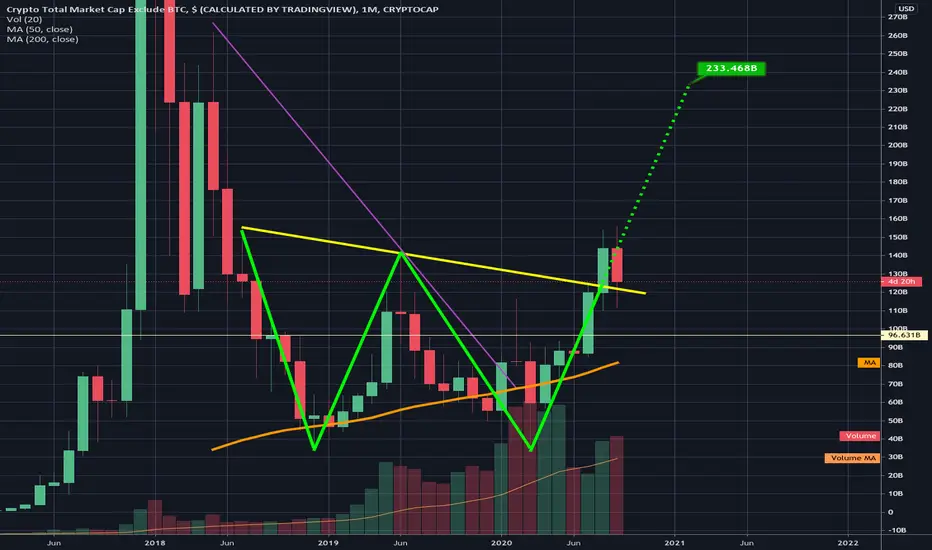
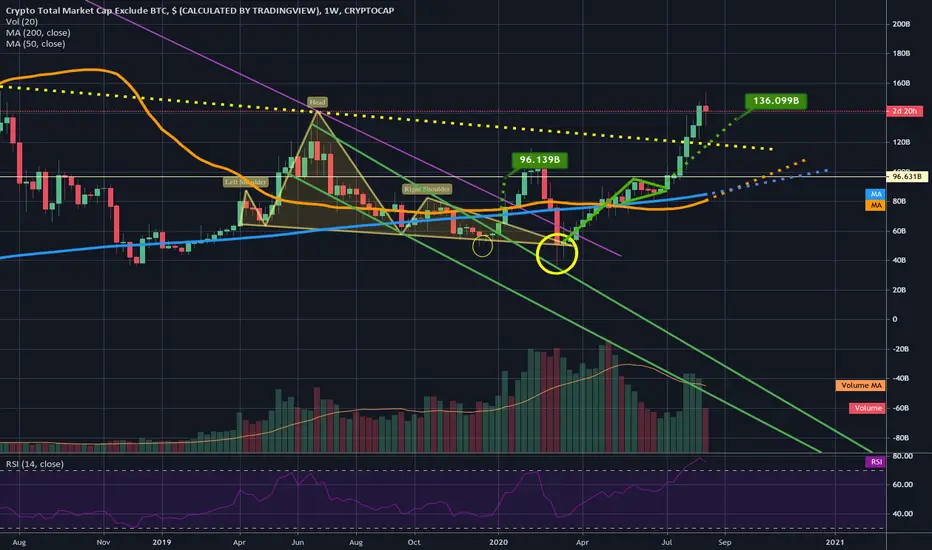
Check out my old weekly chart for the alt market.This one's TA played out like true poetry. I was on my way to post a chart of an exciting double bottom pattern on the TOTAL2 (altmarket) chart and it brought back up some charting I had done on a head and shoulders (in yellow). I was saying in previous ideas over a year ago when we originally formed this big h&s patterns that based on how illogically low the breakout target is we would definitely see this pattern end up being a fakeout which would lead to at best the end of the bear market...many times a bearish head and shoulder pattern is really a bullish falling wedge in disguise and this time was no different. So I have a yellow head and shoulders pattern and a green falling wedge drawn here overlapping eachother you can see I marked the measured move target from where we broke out of the green wedge at $96. we can also see inside the smaller yellow circle, that right before we broke up from the wedge we had price send a wick below the neckline of the h&s likely trapping a bunch of naive bears..it then slingshotted itself out of the wedge and over the breakout target plummeting back into the h&s pattern a few short weeks later for one last fakeout at the neckline (as shown in the larger yellow circle) super interesting how this fakeout candle's lower wick retested the top trendline of the green wedge with absolute precision and the body of the same candle closed perfectly on the support of the neckline. After now confirming the h&s fakeout & the falling wedge breakout simultaneously we shot up to just below the horizontal resistance at 96 but above the 200 and 50 weekly mas until we finally closed a candle above that horizontal resistance after forming a bull pennant of which had a breakout target shown here at $136...upon reaching that target we surpassed our top dotted yellow resistance and will now possible look to retest it as new solidified support. We can see we are mere weeks away from a weekly golden cross which would greatly increase the probability that we maintain the dotted yellow line as solidified support. There is now a bigger pattern on a more macro scale to focus on so immediately after I post this idea I will be posting another one with only the larger pattern which is a double bottom that will also likely trigger and lead to much more upside and a confirmed bull market altseason for the alt market.

TOTAL2 - Critical PointHello Traders!
Looking at the TOTAL2 chart, we are in a critical point, if we get rejected on the upper trendline, we might expect a pullback, or a reversal of the trend.
If you take a look at the daily chart, you can see that there has been a fiercely fight between the bears for almost 3 days on this area, and it seems that the bulls are finally winning, but lets see how it works out.
Looking at the monthly and weekly MACD they have an upward trend, what might help to overcome the 93B critical Market cap.
Hope this information is useful.
Good luck!

Xrp /// altmarket bubbleJust recently discovered this, but now its pretty obvious whats going on. this fits for other alts too. btc sure will suffer too in this drop but maybe not as much as alts (bottom at 4k?)
i was clearly too much focused on log mode in the past when the obvious is only noticeable in non log mode >.>

XRP.BTC P-Modeling Pt 18. The Crippling of TearsWelcome to the future of Technical Analysis .
This is Pt 18. Trial 1 on XRP's Global Ecosystem.
Find the "we are here" bubble.
I am most likely wrong...
I think my timing on this may be slightly off. Meh . Who cares.
but what... if..
good enough for me!
Target bottom Buy .000004
99% capitulation scenario on XRP.
HOWEVER...
On April 20th, 2020. The real fun begins and we won't stop hearing about it. (rolls eyes).
Come for the laughs, stay for the Art.
___________________
Think in Loops.
Think in Strings.
Begin to connect them.
You see weird things...
Oof. Tis so Pretty.. But is it functional?... That is the question of the day.
Bet your ass, I am shorting this again into the ground. Despite my previous failures.
Pt 1. Interesting start..
PT 11. Excellent follow thru.
PT 15. EPIC Fail.
Start here for sequential Model of this idea.
PT 16. Failed - went sideways.
PT. 17. Failed - stayed sideways.
PT 18. Is the same chart as Pt 16 & 17. The only difference is a shift in the fractal to its current location. Nothing else changed.
Failure is a necessary presupposition to success.
Laugh with me into madness.
Now for some deep thinking. Cheers.
Thanks for Pondering the Unknown with Me,
Glitch420
*Disclaimer: If you seizure prone, turn the brightness all the way up for extra eye bleed. This is financial advice.

EOS.BTC P-Modeling Pt 7. Matrix Spiral Laughs of Cajun Welcome to the future of Technical Analysis.
This is Pt 3. Trial 1 on EOS's Global Ecosystem.
Find the "we are here" bubble.
I am most likely wrong...
I think my timing on this may be slightly off. Meh. Who cares.
but what... if..
good enough for me!
Target bottom Buy .00008998
April 20th, 2020. The real fun begins.
Come for the laughs, stay for the Art.
___________________
Think in Loops.
Think in Strings.
Begin to connect them.
You see weird things...
Oof. Tis so Pretty.. But is it functional?... That is the question of the day.
Bet your ass, I am shorting this again into the ground. Despite my previous failures.
PT 2. Meh.
PT 3. Not bad..
PT 5. Failed. Hard AF.
PT 6. I did better.
Pt. 7 ... ??
Failure is a necessary presupposition to success.
Laugh with me into madness.
Now for some deep thinking. Cheers.
Thanks for Pondering the Unknown with Me,
Glitch420
*Disclaimer: If you seizure prone, turn the brightness all the way up for extra eye bleed. This is financial advice.

Ethereum gaining altcoin dominance?Hello All,
So far, as we have seen this current market, Ethereum--previously a strong performer-- has been under performing, however, it has a strong pattern here with the chance of a classic failure swing, as the second bottom could not approach the original bottom as closely. This failure swing is denoted by the yellow strokes on the chart.
There is a broadening wedge which I have been following for several months, and so far, following this pattern has been very fruitful. But, now the price action appears to be consolidating just above an important support and one of the strongest resistance trendlines for Ethereum since the move to 360. The price objective of this broadening wedge is approximately 250 which would place ETH just above a strong resistance region. We are looking for strong movements above the resistance trendline which is in magenta or purple, after there maybe a retest of the breakout, otherwise, I believe price will power through to close to 250 with very little consolidation opportunities.
Currently, there is a small flag just under the resistance, and 179 is a strong support region; there is an extremely low probability for ETH to fail this breakout, and if it does, there is a great opportunity for good risk management.
Also, giving me a like and a follow will help motivate me to post more!
Best of luck and Stay Technical!
Previous Analysis:

Total2 still leaning bullishlots of bullish pattern convergence happening on multiple timeframes here...the probability overwhelmingly favors at least a short term bull run here..but when it is this overwhelming we always have to consider a fakeout. Despite that I'm leaning long enough to mark this idea long even though a fakeout is very much still in the cards. Patience is key here. The big 3 bullish patterns are this inverse & shoulders, the bull pennant inside it's right shoulder and the impending golden cross...its also abhove key resistance lioes as well as important mas from the weekly chart. Really the most bearish thing it has going for it is that its so bullish that it could be a fakeout. Again, patience is key.
