$ETH Analysis — Correction Incoming?Summary:
After a strong ~100% rally in ETH, price hit a major resistance zone near $2734.78, triggering a significant sell-off, likely driven by algorithmic profit-taking. Now, the market is poised for a healthy correction before another potential leg up.
📉 What's Next for Ethereum?
🔍 Expecting a Correction of 7% to 25%
Based on technical structure and indicator behavior, ETH is likely to retrace to one of the two key zones:
✅ Primary Buy Zone ("Most Likely"): $2297.20
This zone aligns with previous structure support.
It’s where the price may form a higher low and resume its upward trend.
Ideal for opening a swing long with a tight risk-reward ratio.
🔥 Deeper Correction Opportunity: $1779.58
While less likely, a drop to this level would be a major long opportunity.
Aligns with historical demand and long-term support levels.
Also intersects with the yellow trendlines suggesting trend-based support zones.
📊 Why This Correction Makes Sense:
Weekly Money Flow Index (MFI) is Dropping:
MFI divergence suggests money is flowing out, weakening bullish momentum.
A trigger wave is forming, often preceding price corrections.
Algo Profit-Taking is Done:
Smart money likely exited around $2734.78 (highlighted in chart).
They’ll need to accumulate again at lower levels before the next rally.
📈 Potential Upside Targets:
If ETH respects the structure and finds support around $2297 or deeper, we could see a rally toward $3296.85 — a key Fibonacci extension and psychological level.
🧘♂️ Reminder:
No emotional entries. Let the price come to you. Trust the setup and stick to your plan.
📌 Disclaimer: This is not financial advice. Just a breakdown of my trading thesis. Always manage your risk.
ALTS

AKT/USDT Analysis💥 CSEMA:AKT - Swing Long Plan After 30% Correction 💥
AKT faced heavy selling pressure around the weekly pivot at $2.0640 , leading to a significant correction of nearly **30%**. The big question now: **Is it time to open a swing long?**
Here’s my take👇
Although we’ve already seen a 30% drop, that doesn’t mean the downside is over . For a high-conviction swing long, patience is key. I’m watching **three key levels** to build a position safely — no FOMO here.
🔹 Long Area 1 : $1.1291 (25% allocation)
🔹 Long Area 2 : $0.9722 (35% allocation)
🔹 Long Area 3 : $0.8234 (40% allocation)
💡 This is my ultimate swing long setup . Scaling in at these levels provides a better risk-reward profile rather than chasing the bounce.
But what if price only taps **Long Area 1** and then reverses? That’s fine too. The priority is **capital preservation and strategic entries**, not catching every single move.
✅ Focus: Make more with less risk
❌ Avoid: Emotional entries and overexposure
📌 Not financial advice. Do your own research. Trade safe! 🧠💰
#AKT #SwingTrade #CryptoAnalysis #TradingStrategy #DYOR #Altcoins

Altcoins The Moon AwaitsLike always, everything is clearly outlined on the charts :
- As a trader, it's crucial to follow logic and technical analysis. If you get caught up in the news and listen to everyone on Twitter, you won't last long.
- The first major altcoin rally was in 2018, pushing the market to $300 billion. This level later acted as a key support throughout the 2022–2023 bear market.
- The last all-time high for the crypto market (excluding Bitcoin and Ethereum) reached $1.15 trillion in 2021. ( blue doted vertical line )
- This all-time high was retested in December 2024, with this ATH acting as strong resistance. ( second blue doted vertical line )
- The next move could be a breakout above this resistance. According to Fibonacci projections, the altcoin market has the potential to reach $4 trillion.
While the spotlight remains on Bitcoin and ETFs, altcoins could catch up with a sudden and powerful surge, so make sure you’re not left behind.
Hodl!
Happy Tr4Ding !

ETH | New ATH on the cards | Fibonacci $7K TARGET Ethereum is gearing up towards the upside and we're seeing another resistance zone being crushed.
While BTC is trading sideways, we can expect ETH to play catch-up:
Don't miss yesterday's update on DOT:
_____________________________

DOG Main Trend. Reversal Zones 05/29/2025Logarithm. Time frame 3 days. The chart shows key reversal zones in the horizontal channel, and when exiting it. For clarity, percentages are shown from the skin reversal zone. This is convenient for understanding the risk and potential profit in long and short work. You can also work in spot from long, from key zones (more relevant, as margin trading on assets of such liquidity, is extremely destructive, due to price slippage under the market, but already on such assets by a huge percentage, for your liquidation (accumulation of liquidity-benefit of gambling addicts in general).
Now the price has hit the resistance of the internal channel, that is, the zone of the “main liquid” price movement. From the reversal, local profit is significant, therefore, when working, observe risk management and wait for a breakthrough of this resistance level (you can place a trigger order), or wait for a rollback (if there is one), for example, to the median of the channel.
The horizontal channel itself is reformatted into a potential “microphone” (what was half a year ago on bitcoin, with resistance to the 72 thousand zone, and liquidity collection 53-58).

PNUT projects to a Dollar.TWO Clear patterns
Double bottom
and a Bull Flag.
Two respective Log Projections for you to consider.
This suggest strong Solana performance is incoming and another round of #Memecoin frenzy.

ETH 2025: $3000 is Key to Escaping Ethereum's Consolidation TrapEthereum (ETH) May Remain Consolidated Throughout 2025 if it Fails to Hit $3000: Here’s Why!
May 27, 2025 – Ethereum (ETH), the world's second-largest cryptocurrency, finds itself at a critical juncture. After a period of significant volatility and notable gains, ETH's price has entered a prolonged consolidation phase. While numerous bullish signals point towards a potential surge, a formidable barrier stands at the $3000 mark. Failure to decisively conquer this level could see Ethereum locked in a sideways trading pattern throughout much of 2025, deferring hopes of a new explosive bull run. This article delves into the intricate factors dictating Ethereum's price trajectory, exploring the tug-of-war between bullish aspirations and the stubborn realities of market resistance.
Section 1: The Current State of Ethereum - A Prolonged Consolidation
As of late May 2025, Ethereum continues to trade within a defined range, struggling to make a sustained break in either direction. The price has been attempting to pierce pivotal resistance zones, with recent attempts this month failing to hold despite decent volume. Some market observers note that Ethereum is currently consolidating between the $2,400 and $2,750 range. This period of consolidation is not unusual in cryptocurrency markets, often representing a "breather" after significant price movements or a period of price discovery as market participants digest new information and sentiment.
Historical chart patterns suggest that Ethereum may have entered a crucial price range, an "accumulation zone," which could prevent a significant breakout for several months. Certain technical indicators, which help identify trends when growth rates fluctuate, show ETH price entering bands that have historically preceded consolidation periods, sometimes lasting nearly a year, before the next major bullish wave. Given that ETH has already consolidated for approximately four months, another similar period could be on the horizon if key resistance levels are not breached.
This consolidation is a focal point for investors and analysts alike. On one hand, it can be seen as a period of building strength before the next upward move. On the other, prolonged consolidation can lead to investor fatigue and a potential drift lower if bullish catalysts fail to materialize. The market is currently in a state of anticipation, closely watching for signals that could indicate the end of this sideways movement. Ethereum's price is currently hovering in the mid-$2,500s, recovering slightly after brief consolidation and respecting key support levels.
Section 2: The $3000 Hurdle - A Critical Inflection Point
The $3000 level for Ethereum is more than just a number; it represents a significant psychological and technical barrier. A decisive break above this level would likely instill strong bullish sentiment, potentially paving the way for further gains towards previous highs and beyond. Conversely, a repeated failure to surmount $3000 could confirm the strength of the resistance, leading to a loss of upward momentum and an extended period of consolidation throughout 2025.
Market sentiment often coalesces around such round numbers. A breakthrough can trigger a fear of missing out, attracting fresh capital. Failure, however, can lead to disappointment and profit-taking, reinforcing the consolidation range. As of May 2025, ETH is expected by some to trade between $2,400 and $2,900, with a monthly close above $2,750 strengthening the case for retesting $3,000 in the coming quarter. Some projections suggest ETH might hover near the $3000 resistance in the summer months, potentially seeing profit-taking before a new range is established. If ETH fails to rise above the ascending trend line it has held since mid-2022, and with technicals like a potential bearish "Death Cross" (where a shorter-term moving average crosses below a longer-term moving average on weekly charts), the price could remain restricted below $2500 for a while, making the $3000 target even more challenging in the near term.
Section 3: Bullish Signals Amidst Consolidation - The Hope for a Breakout
Despite the consolidation, several bullish signals offer hope for an eventual breakout and a more dynamic 2025 for Ethereum.
Altseason Hopes
The term "altseason" refers to a market phase where alternative cryptocurrencies (altcoins) experience significant price surges, often outperforming Bitcoin. Ethereum, as the leading altcoin, plays a crucial role in signaling or even triggering such a season.
Recent technical analysis suggests that Ethereum has reclaimed a key technical level – the mid-line of a significant channel indicator on the two-week chart. This moving average-based band tracks long-term momentum. Historically, closing above this mid-line has preceded sharp price gains for ETH and marked the start of altseasons. For instance, after surpassing this mid-line in 2020-2021, ETH rallied dramatically. A similar pattern in late 2023 saw ETH climb significantly within a year. As of May 2025, the upper band of this channel represents the next significant resistance. A breakout above this could target previous cycle highs.
The impact on the broader altcoin market has also been historically significant. The combined market cap of altcoins (excluding ETH) surged considerably over a year after Ether's close above this channel's midline in past cycles. Some analysts suggest that ETH reaching certain key levels could signal the potential onset of an alt season.
Bitcoin Dominance and Altcoin Market Cap
The prospect of a 2025 altseason is further supported by patterns related to Bitcoin dominance – Bitcoin's market share of the total crypto market capitalization. Historically, after Bitcoin halvings, Bitcoin dominance tends to drop sharply, triggering altcoin rallies. This was observed in previous post-halving periods. With the latest halving in April 2024, a similar period is approaching, and a decline in Bitcoin dominance could occur within the next few months. If this trend repeats, some market observers anticipate the altcoin market cap could surge toward substantially higher figures. A falling Bitcoin dominance implies that capital is shifting from Bitcoin to altcoins, making them the market's primary focus.
Technical Formations
Several bullish technical patterns are currently visible on Ethereum's charts:
• Ascending Triangle: Ethereum's price action has been forming an ascending triangle pattern, characterized by a horizontal resistance level and a rising support line. This pattern typically indicates that buyers are gaining strength, pushing prices to higher lows against a flat resistance. A breakout above the horizontal resistance of this pattern could lead to a significant upward move.
• Inverse Head and Shoulders: Some analysts have identified an inverse head and shoulders pattern on daily trading charts, a classic bullish reversal pattern. The neckline of this pattern is cited around the $2,700 mark. A decisive close above this level could confirm the breakout, with an immediate target of $3,000.
• Bull Flag: On the daily chart, Ethereum appears to be forming a bull flag pattern, which is a bullish continuation pattern that typically follows a strong rally. The current sideways price action forms the flag, and a breakout could lead to a significant price increase.
• Bullish Market Structure: Despite the consolidation, the broader market structure for Ethereum can still be interpreted as bullish, with the potential for consecutive higher highs and higher lows to remain intact if key support levels hold. ETH trading above its key Exponential Moving Averages (EMAs) indicates a strong technical structure.
Analyst Sentiment
Market observers are cautiously optimistic, with many eyeing the $3,000 level as the next major milestone. Some predict that if Ethereum stays above $2,550, a breakout toward higher levels is likely in the near term. Holding above $2,500 is seen as crucial. If bullish momentum persists and broader crypto sentiment remains favorable, ETH could target the $4,000–$4,500 range later in 2025. Institutional interest, evidenced by spot Ether ETFs attracting inflows and Ethereum's growing market capitalization, also underpins a positive outlook.
Section 4: The Bearish Undertones - Risks and Fragility
Despite the array of bullish signals, Ethereum's path is not without significant obstacles and inherent fragilities.
Substantial Supply Near Cost Basis
A concerning factor highlighted by on-chain data is the substantial amount of Ethereum supply acquired near the current price levels. Analysis of blockchain data indicates that a very large volume of ETH supply, valued in the tens of billions of dollars, is near its cost basis and at risk of flipping into a loss if prices dip. This creates a precarious situation. If ETH's price were to fall below these investors' average acquisition price, it could trigger a wave of selling as holders try to minimize losses or break even. This sell-side pressure could exacerbate any downward trend or prolong the consolidation phase. There is also a significant cluster of investor cost-basis distribution around the $2,800 price level, implying potential sell-side pressure as ETH approaches this zone from investors looking to offload assets near breakeven.
Stubborn Resistance Levels
Ethereum is currently coiling under significant resistance. The $2,700 level has proven to be a formidable barrier, with ETH facing rejections multiple times in May. This level represents a key hurdle for bulls. Failure to convincingly break above $2,700, and subsequently $2,800 and the ultimate $3,000 target, could see selling pressure intensify. Each failed attempt can strengthen the perception of these levels as a ceiling, encouraging more traders to sell at these points.
Macroeconomic and Market-Wide Factors
The broader cryptocurrency market is susceptible to macroeconomic headwinds. Factors such as interest rate policies from central banks, regulatory developments, and global economic stability can significantly impact investor sentiment and capital flows into riskier assets like cryptocurrencies. While some anticipate potential interest rate cuts later in 2025 which could be bullish, ongoing quantitative tightening could pose a challenge. Bitcoin's dominance, while potentially set to fall, has also surged in early 2025, overshadowing altcoins for a period and reflecting a "risk-off" environment at times. Any negative shifts in these broader conditions could dampen Ethereum's breakout prospects, regardless of its specific technical or on-chain signals.
Section 5: Why Failure to Hit $3000 Could Mean Extended Consolidation in 2025
The $3000 mark is a critical psychological and technical threshold for Ethereum. Should the cryptocurrency fail to breach this level decisively in the coming months, several factors could contribute to an extended period of consolidation throughout 2025.
• Loss of Upward Momentum: A failure to achieve a widely anticipated price target like $3000 can significantly dampen investor enthusiasm. Bullish momentum is often self-reinforcing; when it stalls at a major resistance, the energy can dissipate, leading to a more cautious or bearish sentiment. Traders who bought in anticipation of a breakout might exit their positions, adding to selling pressure.
• Strengthening of Resistance: Each time a price level like $3000 (or even preceding levels like $2,700-$2,800) successfully repels an upward advance, it becomes a more established and psychologically potent resistance zone. More market participants will view it as a ceiling, placing sell orders around it, thus making future breakouts even more difficult.
• Capital Rotation: If Ethereum's price remains stagnant while other cryptocurrencies or asset classes show more promising returns, capital may flow out of ETH. Investors are constantly seeking the best risk-adjusted returns, and a prolonged consolidation in ETH could lead them to look for opportunities elsewhere in the dynamic crypto space or even in traditional markets.
• Investor Fatigue and Profit-Taking: Extended periods of sideways movement can lead to investor fatigue. Those who have been holding ETH through the consolidation might become impatient and decide to sell, either to lock in existing profits (if any) or to free up capital for other ventures. This is particularly true for the significant portion of supply bought near current price levels, where the desire to break even can lead to selling pressure if upward momentum wanes.
• Confirmation of Historical Patterns: As mentioned earlier, historical chart patterns suggest that Ethereum can enter extended consolidation phases before major bull runs. A failure to break $3000 would align with these historical precedents, suggesting that the market might indeed be settling in for a longer period of range-bound trading.
• Impact on "Altseason" Narrative: Ethereum's performance is often seen as a bellwether for the broader altcoin market. If ETH struggles to break key resistance and enter a clear uptrend, it could delay or diminish the prospects of a widespread "altseason," further contributing to a more subdued market environment for ETH itself.
Essentially, a failure at $3000 would signal that the current buying pressure is insufficient to overcome the selling interest at that level. This equilibrium could persist for an extended period, leading to the price oscillating within a defined range as bulls and bears remain in a deadlock. Until a significant catalyst emerges – be it a major network upgrade with immediate perceived value, a shift in macroeconomic conditions, or a surge in institutional demand that overwhelms sellers – Ethereum could find itself tracing a path of consolidation through 2025.
Section 6: Scenarios for 2025
Looking ahead, Ethereum's trajectory in 2025 largely hinges on its ability to overcome the current consolidation and the critical $3000 resistance. Several scenarios could unfold:
Scenario 1: Breaching $3000 and Igniting a Bull Run
This is the optimistic scenario favored by many ETH proponents.
• The Breakout: Ethereum successfully smashes through the $2,700-$2,800 resistance zone and then decisively conquers the $3000 psychological barrier. This breakout would likely be accompanied by a surge in trading volume, confirming strong buying interest.
• Targets: Once $3000 is overcome, analysts eye targets such as $3,200, $3,500-$3,600, and previous cycle highs around $4,100. Some even more bullish long-term predictions based on chart patterns suggest significantly higher targets if momentum is sustained.
• Altseason Trigger: A strong ETH rally, particularly one driven by reclaiming key technical levels, could indeed trigger a wider altseason. This would see significant capital flow into other altcoins, potentially leading to a massive altcoin market cap surge if Bitcoin dominance concurrently falls.
• Market Sentiment: Overall market sentiment would turn decisively bullish, fueled by positive price action and the realization of long-awaited breakouts. Institutional interest would likely further increase.
Scenario 2: Failure at $3000 and Continued Consolidation Throughout 2025
This scenario represents the central thesis of this article – a prolonged period of sideways trading.
• The Rejection: Ethereum makes attempts to break $3000 (or even struggles to consistently hold above $2700-$2800) but is repeatedly met with strong selling pressure. The price fails to establish a sustained uptrend above these key levels.
• Trading Range: ETH would likely continue to trade within a familiar range, potentially bounded by support levels around $2,300-$2,500 and resistance capping gains below $3000. This range could persist for a significant portion of 2025.
• Investor Sentiment: Investor sentiment would likely become mixed and potentially frustrated. While long-term believers might continue to accumulate, shorter-term traders could become disengaged due to a lack of volatility and clear direction. The "wait-and-see" approach would dominate.
• Impact on Altcoins: A stagnant Ethereum could dampen enthusiasm for a broad altseason, leading to more selective and narrative-driven gains in the altcoin market rather than a widespread euphoric rally.
Scenario 3: A Bearish Breakdown
While many signals are bullish or neutral (consolidating), a bearish breakdown remains a possibility, especially if broader market conditions deteriorate or if key supports fail.
• Support Failure: Key support levels, such as $2,450, $2,300, or even the psychological $2,000 mark, are breached decisively. This could be triggered by the large supply near cost basis flipping into loss and causing a cascade of selling.
• Negative Catalysts: This scenario could be exacerbated by negative macroeconomic news, stringent regulatory actions, or unforeseen issues within the Ethereum ecosystem.
• Price Action: A bearish breakdown would see Ethereum enter a downtrend, potentially revisiting lower support levels from previous market cycles. Technical indicators like a "Death Cross" on weekly charts, if confirmed, would add to bearish sentiment.
• Market Sentiment: Fear and uncertainty would grip the market, leading to a flight to safety, possibly increasing Bitcoin dominance or a move towards stablecoins.
•
The most probable outcome will depend on a confluence of technical breakouts, fundamental developments within the Ethereum ecosystem (like the impact of future upgrades), institutional adoption trends, and the overarching macroeconomic environment.
Section 7: Conclusion
Ethereum stands at a pivotal moment in May 2025. The allure of a significant rally towards $4,000 and beyond, potentially heralding a new altseason, is palpable, supported by historical precedents and bullish chart patterns. However, the path is fraught with challenges, most notably the formidable psychological and technical resistance clustered around the $2,700 to $3,000 levels.
The current consolidation phase, while potentially a healthy accumulation period, also carries the risk of morphing into prolonged stagnation if upward momentum cannot be decisively seized. The significant volume of ETH supply hovering near its cost basis presents a tangible threat, where a dip could trigger further selling pressure, reinforcing the consolidation or even leading to a decline.
Therefore, the central thesis holds considerable weight: should Ethereum fail to convincingly breach the $3000 mark in the coming months, it is highly plausible that the cryptocurrency could remain locked in a consolidative pattern for much of 2025. This would test the patience of investors and potentially delay the much-anticipated fireworks of a full-blown altseason.
The cryptocurrency market is notoriously dynamic and influenced by a myriad of unpredictable factors. While technical analysis and on-chain data provide valuable insights, they are not infallible crystal balls. Investors and traders must remain vigilant, continuously reassessing the evolving landscape, managing risk, and preparing for various potential outcomes as Ethereum navigates this critical juncture. The battle for $3000 will likely define ETH's narrative for the remainder of the year.

ALTCOIN ROADMAP: REVISITED!!! Ethereum vs NvidiaOne of the most insightful ratio charts that provides a remarkable glimpse into the vitality of Altcoins and the appetite for risk is when Ethereum outshines one of the fastest rising stars in the stock market, #NVDA!
The conventional Altcoin index indicates how many of the top 100 Altcoins are outperforming #BTC.
This is indeed a valuable metric that we can rely on for identifying peaks.
However, I believe that if we broaden our perspective and examine the ETH ratio against a Tech Titan, we can truly pinpoint the timing of the banana zone. When it starts and when it is confirmed violent uptrend.
My interest in this ratio was sparked when ETH was still a proof of work coin, validated through GPUs; it seemed like a natural starting point to assess whether the ETH price was overvalued or undervalued.
Even after the transition to POS, I still think it’s worth analysing, as shown by the recent double bottom on the ratio!
The next crucial question is when we can break the multi-year downtrend to genuinely confirm the Banana zone. Because without ETH, there’s no party.
If we enter a big strong banana zone, I believe the ratio could swiftly trend towards 100, so we will be keeping a close eye on it!

BTC Dominance forecast until the end of August 2025It is a reversal now.
From now on until the end of August 2025 BTC.D will travel south. Downtrend will be in waves with major dates in the end of June and end of August 2025.
Major correction up will happen from 59.4% to 61.67%
The end of altseason will be at the level of 57.75%
Beware of major dates. Don't get driven away by profits, because the real fortunes are made in bear markets.
For more check my profile

total3 altcoins Altcoins expansion phase to continue hard
waves over short periods of time are the fuel for a new leg

TOTAL2 - Great Bullish SetupGreat position for the bulls
Weekly chart so its gonna be a long position
Bullish bounce off the MA is expected and new ATH's for ETH and BTC will come
Weekly timeframe

TOTAL2 - AltseasonMonthly observation of the alt coin market cap chart
Looks like the bulls are in for a treat
Very bullish favor
50MA has held quite well
Monthly chart

THESE ALTS can +100% | ALTSEASON PART2️⃣Altseason usually happens when BTC trades close towards a new ATH, as it is doing now, and takes some time to stall/trade sideways
Now this season is working a little differently. Usually ETH makes its way towards new highs, but we haven't seen that just yet. Ethereum has HUGE upside potential still.
It's hard to say just how high Ethereum can go, but what we do know is that it's still 88% away from the previous ATH, and due for a new one...
ENA is another alt with big upside potential, from it's previous peak its more than 200% away:
Solana has made a strong V-shaped recovery and if ETH is primed for new ATH, SOL is sure to follow:
TRUMPcoin may be memecoin, but the again so is PEPE! Still big upside after a long while of range trading here:

ALTS - Altcoins you MUST WATCH for ALTSEASON1) ONDO | BYBIT:ONDOUSDT
After some consistent higher lows, ONDO is likely on its way back towards it's previous ATH:
2) ATOM | BINANCE:ATOMUSDT
Cosmos is one of my favorites, and I'm patiently waiting for the parabolic run on this one:
3) SONIC | BYBIT:SONICUSDT
SONIC / previously FTM is trading nearly 290% away from its previous ATH, with great upside potential.
4) AAVE | BINANCE:AAVEUSDT
AAVE still has a bit to gain before reaching its previous ATH, and the parabolic run has actually already started:
5) ENA | BINANCE:ENAUSDT
IF ENA can hold it's current support, there's a huge upside awaiting this alt:
😊🧡 Please like and follow !!

BTC UpdateLooking at historical data, we’re at a similar point as in 2021 — diverging RSI, declining volume, and signs of exhaustion. The key difference now is the level of institutional involvement: hedge funds are heavily in, MicroStrategy keeps buying, and even nation-states have exposure.
Despite the bullish narrative, I believe we’re heading down.
Price action isn’t convincing — we're still trading below the January monthly candle close, volume is drying up, and RSI continues to diverge. Each 5–10% pump is followed by a sharp spike in open interest (OI), then a brutal liquidation cascade wiping out $500M–$1B. This is starting to look like a leveraged casino, not a healthy uptrend.
That said, I wouldn’t rule out a final wick toward $120K to trap late longs and suck in liquidity before the real move down.
I called the top after the January rally — they called me a madman. Still, I was right.
Mastery tends to be a funny thing, seems like on a long enough timeframe you cant lose.
Stay safe everyone.

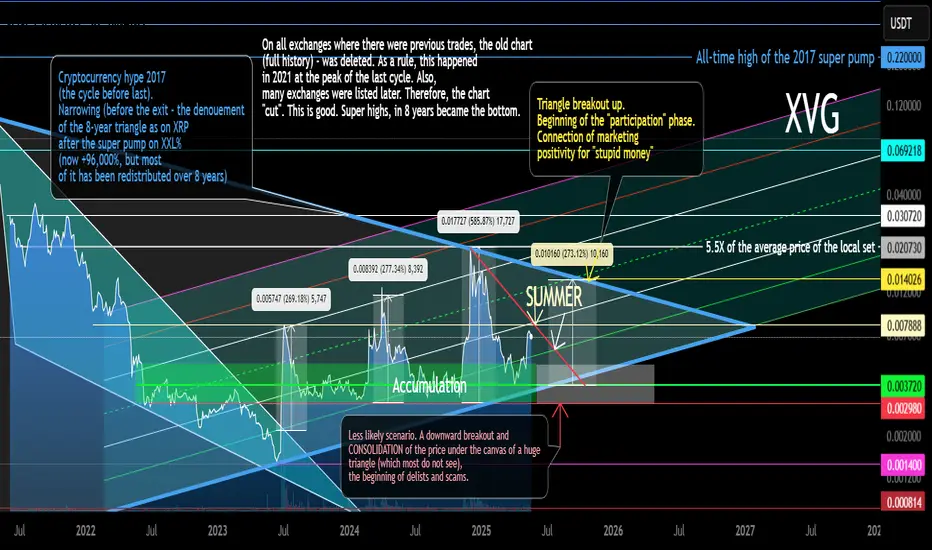
XVG Secondary Trend (Part) Triangle Resolution 8 years 05 2025Logarithm. Time frame 3 days. Linear instead of candlestick specifically for clarity. This is the longest chart history on tradingview that could be found. It does not display everything as is. Where this cryptocurrency was previously traded, the exchanges deleted the entire trading history. Listing on new exchanges does not display the whole picture. I described and showed everything on the chart. More in the channel, screenshots and comparison with XRP, here the site does not provide an opportunity to make such a comparison, as there are simply no charts of such history.
Verge (XVG) like XRP identical chart of the main trend, and the same 8-year triangle after the pumping of 2017. The only difference is that XRP came out of its triangle half a year ago, in alt season #2 of this cycle, and this cryptocurrency is still in the canvas of its triangle. But the price is gradually being driven into a corner. In alt season #3, most likely, the denouement of this story lasting 8 years will occur. More up than down (at the beginning).
Verge (XVG), like XRP, is an asset of the super pump of 2017 and the price retention is -96-98% from the super pump by hundreds of thousands of percent (I am not mistaken exactly so), which forms a huge triangle on XXX (8 years). This is all inherent in the assets of the hype of 2017: XVG XRP NEM XLM ZEC XMR DASH LTC and so on ... Some of them, over the past 2 years, have become on the path of hype (XRP XLM), and some on the path of scam (I do not want to make anti-advertisement).
Most likely, everything will repeat on XVG, as on XRP, but only at the right time, in the final alt season of this cycle. "XVG captains" do not have as much money and a powerful state behind them as XRP, to go against the market and the general trend, therefore, they need the market hype to distribute "a little higher". And so with most of these altcoins. Do not forget to get rid of them on the pump. Remember, the more down-to-earth goals, the more likely you are to earn over the long term. Observe risk and money management.
Remember, there is a big alt season ahead, provided that you are an adequate person and your goals are appropriate.
ETH + ALTSEASON | NEW All Time Highs Soon ??This would have been the first time that BTC made a new ATH during a bullish cycle, but ETH didn't - are we too hasty?
Very interesting to compare the two side by side and see that ETH has much more to gain than BTC:
The BTC new ATH update can be found here:
______________________
BINANCE:BTCUSDT BINANCE:ETHUSDT

Rounded Top Above 200MA A chart for the altcoin market showing a rounded structure forming above the 200MA on this daily chart
The 200MA will likely act as support and allow price to move higher
Still bullish for alt coins

Altcoin Market Holding Strong – Breakout on the Horizon!📈🚀 Altcoin Market Holding Strong – Breakout on the Horizon! 🌈📊
Hey Traders!
The altcoin market is gearing up for a powerful breakout! TOTAL3 (the altcoin market cap excluding BTC and ETH) is holding perfectly above the critical $893B support zone. This is exactly the kind of price action we expect before major upside explosions!
📊 Key Levels to Watch:
📍 Support Holding Strong: $893B – Bulls are defending this level with conviction.
🚀 Breakout Zone: A clear move above $900B sets the stage for a rapid surge toward $1.13 Trillion, a potential +25% rally!
✅ The structure is bullish, momentum is building, and the charts don’t lie—this market wants higher!
📚 Why This Time Feels Different:
BTC dominance is struggling at resistance—this is the perfect environment for altcoins to shine! 🌟
Real crypto projects are finally starting to show strength amid all the meme coin noise.
We’ve seen this setup before… and it led to explosive alt rallies. History may not repeat perfectly, but it sure loves to rhyme! 🎯
💬 Your Next Move:
Are you already positioned for this altseason breakout, or planning your entries now?
Which altcoins are you most bullish on for this run to $1.13T and beyond?
This is the moment serious traders wait for—don’t let it slip by! The market is loading the rocket… will you be on it when it takes off? 🚀
One Love,
The FXPROFESSOR 💙

APEX Main trend. DEX exchange Bybit. Hype and super pump 05 2025Logarithm. Time frame 1 week. Correction (descending channel, two distribution zones) after a super pump of about 1500%. All key support and resistance zones were shown, including dynamic ones.
Also showed a local target in percentage in case of exit from a local descending wedge. There is a possibility that the price will enter the mirror support zone of the previous volatility zone of the horizontal channel, or even to the median (green dotted line). Just remember this. When working with the crowd hype, remember the risks.

Altcoins are in a similar channel as in 2022–2023.I believe that as long as the interest rate stays at 4.5%, we won’t see real growth in altcoins — only short-term pumps. Rate cuts are expected to begin in the summer, but it will take some time to have an effect. I would compare the current market to both 2019 and 2022.

ALTSEASON is here!The Crypto Total Market Cap (excluding the Top 10 coins) broke above the 1D MA200 (orange trend-line) and is consolidating on an overbought 1D RSI (>70.00).
Since October 2023 when this set of conditions emerge, the long-term Channel Up starts a rally (technically its Bullish Leg). This is what in the crypto world is known as 'Altseason',which is when the lower cap coins see enormous gains relative to the top 10.
The last Bullish Leg (2024) rose by +200%. The previous one, even more. If it 'just' repeats the +200% Leg, we are looking at a market cap of $525 Billion.
The time to invest in alts is now!
-------------------------------------------------------------------------------
** Please LIKE 👍, FOLLOW ✅, SHARE 🙌 and COMMENT ✍ if you enjoy this idea! Also share your ideas and charts in the comments section below! This is best way to keep it relevant, support us, keep the content here free and allow the idea to reach as many people as possible. **
-------------------------------------------------------------------------------
💸💸💸💸💸💸
👇 👇 👇 👇 👇 👇

BTC.D is started to melting downThe MARKETSCOM:BITCOIN dominance bounced off a very critical level. It seems that the altseason is just started. The upcoming altseason will be face melting. Fill your bags with valuable alts ...
