ALTseason May Show Up In 2025We found an interesting chart, which is showing us the ratio of TOTAL3(ALTcoins) market cap against Bitcoin with ticker TOTAL3ESBTC. Well, even this chart is showing that ALTcoins may start outperforming BTC soon. It can be finishing final subwave C of (Y) of a correction in blue wave B that can cause a new strong rally into wave C, which can bring the ALTseason similar as in the beginning 2021.
Altseason

Magic Eden’s ME Token Eyes Bounce After Trump Wallet VolatilityOn June 3, , Magic Eden ( BINANCE:MEUSDT ) announced a collaboration with a project called to launch a new" Trump Wallet "
This announcement triggered a + 35% price increase , pushing the price of ME Token to approximately $1.17 .
However, shortly afterward, members of the Trump family, including Donald Trump Jr. , denied any involvement with the wallet or the project.
This resulted in a -20% price drop due to shaken investor confidence .
-----------------------------
Let’s see how ME Token is doing on the 1-hour timeframe .
ME Token is trading in the Support zone($1.03-$0.96) near the 50_SMA(Daily) .
From the Elliott Wave theory perspective, ME Token seems to have completed the main wave 3 and is currently completing the main wave 4 .
I expect ME Token to rise to at least $1.146(+15%) .
Second Target: $1.237
Note: Stop Loss = $0.95
Please respect each other's ideas and express them politely if you agree or disagree.
Magic Eden Analyze (MEUSDT), 1-hour time frame.
Be sure to follow the updated ideas.
Do not forget to put a Stop loss for your positions (For every position you want to open).
Please follow your strategy and updates; this is just my Idea, and I will gladly see your ideas in this post.
Please do not forget the ✅' like '✅ button 🙏😊 & Share it with your friends; thanks, and Trade safe.

Ethereum has reached its bottomKey support trendline should offer spring towards the next bullish wave.

$ANIME Brreakout Ahead?- BINANCE:ANIMEUSDT is breaking out of a key resistance zone after weeks of higher lows.
- If this breakout holds, a move of 200% or more toward $0.09505 could be next.
- Watch for a retest. This could be the start of something big. 👀
DYRO, NFA

HolderStat┆ADAUSD triangle breakCRYPTOCAP:ADA rebounds off the 0.666 base, slicing through a two-hour down-trend line. Stacked consolidation boxes now act as demand, and an emerging ascending channel eyes 0.75 – 0.76, maybe 0.80. Key support flip, improving momentum and bullish breakout pattern align for higher highs.

HolderStat┆ETHUSD road to the sell zoneCRYPTOCAP:ETH price ascends inside a neat channel after a trio of consolidations. The chart’s marked sell zone near 3 100 USDT aligns with upper resistance, yet current higher-low structure, breakout arrows and supportive trendline suggest bulls intend to test that ceiling soon.

HolderStat┆SOLUSD channel surferCRYPTOCAP:SOL exited a falling channel, built a clean growing channel and parked on 165 USDT support. Repetitive consolidation mid-way and a projected path to the 190 USDT level underscore continuing strength, with trendline confluence favoring upside continuation.

HolderStat┆XRPUSD rebound renaissanceCRYPTOCAP:XRP bounced off a long falling wedge, logged a labeled “rebound”, and now glides within a widening channel. Multiple consolidation pauses plus higher lows keep momentum positive; watch the 740 USDT overhead zone as resistance where breakout traders may aim next.

HolderStat┆ADAUSD coiled for new highsCRYPTOCAP:ADA has printed boxy consolidations, respected its rising base and survived a sharp pullback; price now rests on ascending support. With prior “new highs” still warm and trendline resistance nearby, the setup flags a rebound toward 0.78 amid persistent bullish price action.

Bitcoin Dominance, BTC ATH and ALT Seasons since 2017-some facts
There is little doubt now, that this Crypto cycle is very different from previous cycles and the main reason for this is the Bitcoin Dominance ( BTC.D) of the Market.
The reasons for this Dominance is complicated but we can certainly point towards the arrival of ETF's as one of the principle factors.
Corporations simply Buy Bitcoin, Hold it and Trade the ETF's - The Key Principle here being that the Coins are HELD Long term.
As we can see from the main chart, we have a key point in the BTC cycle called the Bitcoin Halving. To many extents, the explanation of this is not relevant right now.
But what you can see is how, previously, after the BTC Halving, we saw a drop in BTC.D,
This was due to the money Flow out of BTC and into ALT coins.
As more ALT coins were bought up, the demand drove the price higher and so their dominance increased, driving BTC.D down
This has not happened this cycle due to bulk buying of BTC for ETF's and BTC being Held Long term.
We can also see how , as we approached a certain time span After the Halving, we saw a sharp rise in BTC.D as we headed towards the next BTC ATH as the BTC buying picked up.
Again, this is not happening this cycle as the Bitcoins are being held long term.
What we can also see on the main chart is how we would normally be approaching a period of expected BTC ATH ( green vertical box )
And the HUGE question is, Will we get a Bitcoin ATH in this period ?
This is, to many extents, impossible to answer but as demand for Bitcoin continues and coins become harder to find, the price should continue to rise.
The tricky bit is, now, with a Bitcoin costing over 100K usd, it becomes harder to move the price. Only Corporations can afford to bulk buy.
So, again, things are different.. Retail is struggling to find a foot hold in the Bitcoin market, seeming to think that a Bitcoin is too expensive for them.....forgetting that they can buy a bit and that will also increase in price by the same %.
And so they look to the ALTs, fast volatile price rises and high returns,
This is seen very clearly in this chart that shows us when we had previous ALT seasons after the Halving
See how, after a period of time after Halving, the ALT Seasons appeared when the BTC.D dropped.
And that has simply just NOT happened this time.
It has to be said, it did try to appear. ALT season tried to happen.
See how after 210 days after halving this cycle, BTC.D did drop sharply but, it found a line of support and bounced back, Killing the ALT season dead in its tracks
There have been a lot of attempts since but the Market has been Bloody for ALTS, with sharp rise and Falls destroying confidence..... And Bitcoin continues to Rise.
So, where are we now ?
This Daily BTC.D chart may offer some ideas
BTC.D PA is currently at TOP of long Term range and finding it hard to get over that line of resistance.
BTC.D Weekly MACD , while not overbought, is curling over Bearish
BTC ATH's have previously been attained from Oversold areas as MACD Rose back higher.
The Volatility has gone and MACD is ranging smooth
SO, in conclusion, it is anybodies Guess right now if we will ever see an ALT season again.
Technically, on many fronts, we are poised, ready for it, even if it is a mini one.
But as we have seen on many occasions this cycle, Bitcoin is a very desired asset now and Demand drives price.....and so the Sell off that we need to drive an Alt season just may not occur.
One thing that is Absolutely certain though, we are highly likely to see another Bitcoin ATH
Stay safe everyone and Love one another. It is Free to do and is worth more than anything

CHILLGUY Tight Range Play – Patience Could PayCHILLGUY/USDT Analysis – 6H Chart
CHILLGUY is currently consolidating above a strong demand zone and key support line. Price is squeezing into a tight range, showing signs of buildup after the recent uptrend.
As long as the support holds, a bounce toward the mid S/R levels looks likely. A strong breakout from this zone could fuel the next leg higher.
But if price loses the demand zone, it may trigger a deeper correction.
Stay alert — a decisive move is nearing.

LPT reversed a 3-month bleed — and I caught the reset candle.This isn’t noise. This is reversal.
LPT just completed a 96-bar, -86% bleed. But price didn’t just stop randomly — it formed a rounded base and exploded straight into a 1D breaker block, clearing internal structure and printing a clean power candle.
Now? Price is retracing.
We’re back into the 1D OB at 8.31 — aligning perfectly with the 0.618 fib retracement of the entire move. This is where price pauses, not reverses. And if Smart Money is still in control, this is where the next leg builds.
Targets are layered:
9.29 (0.5) is the first inefficiency reclaim.
10.28 (0.382) is the emotional level that marks continuation.
13.01 is the liquidity pocket — and the full draw.
This isn’t about whether price “goes up.” It’s about how price delivers.
Execution structure:
🟩 Entry: 8.31–6.91 (discount into 1D OB)
🎯 Target 1: 9.29
🎯 Target 2: 10.28
🎯 Final: 13.01
❌ Invalidation: sustained close below 6.12 (break of intent)
Everyone sees the candle.
Few understand the reclaim behind it.

Quasimodo Pattern + Validator Support = Bullish Signal for ETHToday I want to analyze Ethereum ( BINANCE:ETHUSDT ) for you, many tokens are on the Ethereum network , and the increase or decrease of Ethereum directly affects most tokens.
So please stay with me.
Ethereum is trading in a Heavy Resistance zone($2,929_$2,652) near the Resistance lines and 200_SMA(Daily) . It is worth noting that Ethereum is preparing itself for a third attack on 200_SMA(Daily).
In terms of Price Action Analysis , Ethereum could start to rise with the help of the Bullish Quasimodo Pattern and break out of 200_SMA(Daily) and Resistance lines .
In terms of Elliott Wave theory , Ethereum appears to have completed a main wave 4 near Important Support lines . The structure of the main wave 4 is a Double Three Correction(WXY) . By breaking the 200_SMA(Daily) and Resistance lines , we can confirm the end of the main wave 4 .
The ETHBTC ( BINANCE:ETHBTC ) chart conditions are bullish , so it seems like investing in Ethereum could be better than Bitcoin . At least if the market falls , Ethereum is likely to be less likely to suffer a decline .
Note : Over 150,000 Ethereum validators, representing approximately 15% of the network, signaled support for increasing the gas limit from 36 million to 60 million units. This proposed change aims to enhance network capacity, reduce transaction fees, and improve scalability. While this development could positively impact ETH's price by making the network more efficient, it's essential to monitor potential technical risks and ensure that decentralization is maintained.
Note: If Ethereum touches $2,547 , we can expect further declines.
Please respect each other's ideas and express them politely if you agree or disagree.
Ethereum Analyze (ETHUSDT), 1-hour time frame.
Be sure to follow the updated ideas.
Do not forget to put a Stop loss for your positions (For every position you want to open).
Please follow your strategy and updates; this is just my Idea, and I will gladly see your ideas in this post.
Please do not forget the ✅' like '✅ button 🙏😊 & Share it with your friends; thanks, and Trade safe.

Altseason started Bullish from this chart cup and handle. Consider to see this breakout.
This ill be the start of Altseason, Bitcoin will pump .. others will follow.. 250X incoming & 15 Trillion MCAP

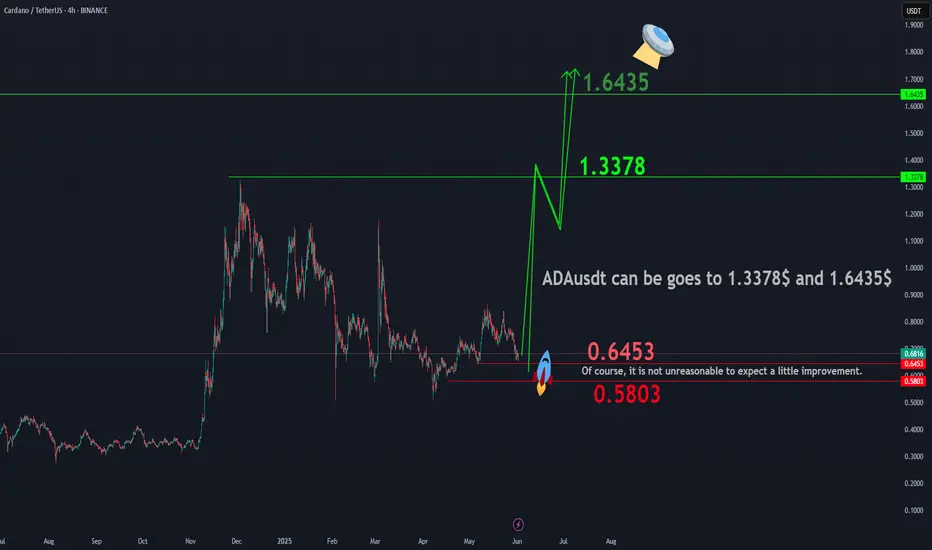
ADAUSDTBINANCE:ADAUSDT shows potential for an upward movement towards the targets of $1.3378 and $1.6435, making the current price zone attractive for long-term investment . While a correction towards $0.6453 or even $0.5803 is possible, these levels present favorable buying opportunities for investors with a long-term perspective. Even if a deeper correction occurs, the market geometry suggests that reaching the aforementioned targets is a likely outcome.
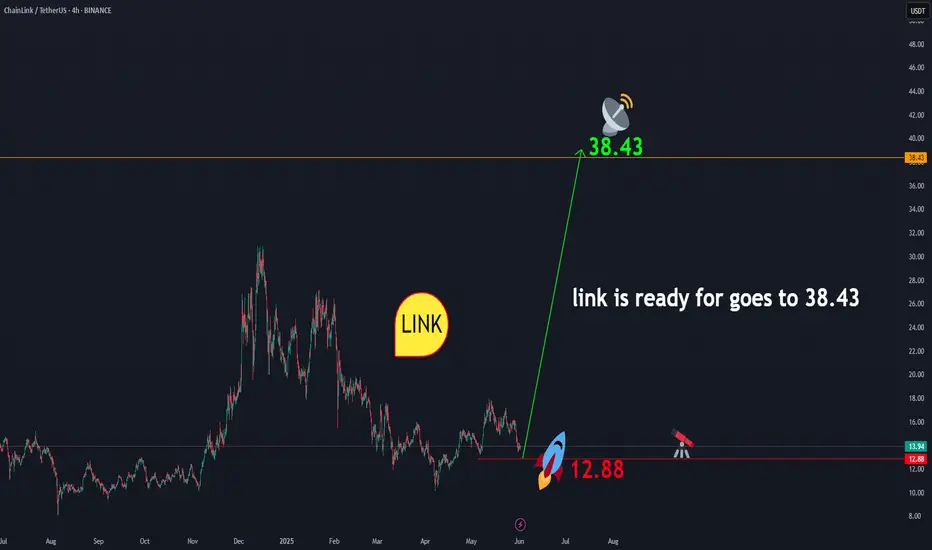
linkusdtLINK is showing readiness to initiate an upward movement towards $38.43. From the current price range of $13.93, a correction down to the $12 area is possible. This zone presents a favorable opportunity for long-term investment . In any case, according to the geometry that has formed in LINK, the price level of $38.43 is expected to be achieved. And this is certain.
BINANCE:LINKUSDT
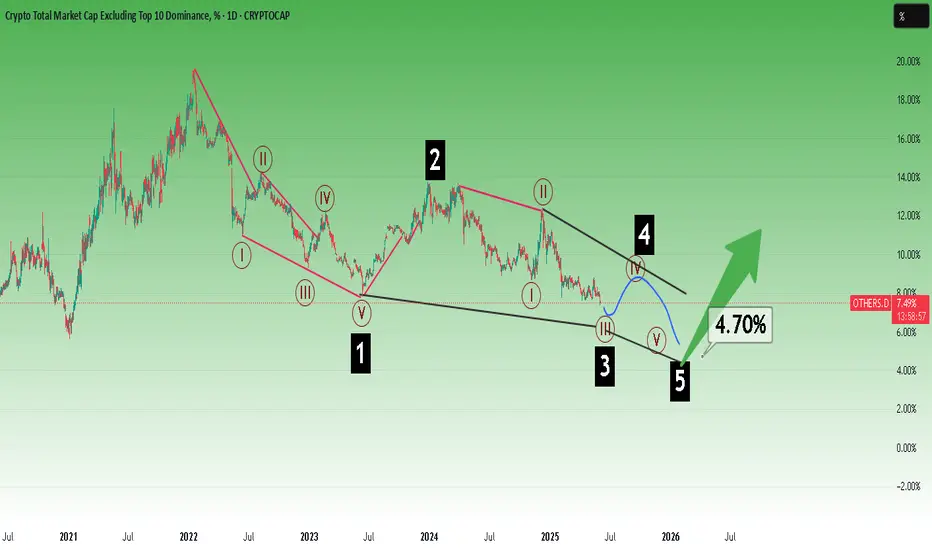
OTHERS ROADMAPTo me the view is pretty clear.
* The purpose of my graphic drawings is purely educational.
* What i write here is not an investment advice. Please do your own research before investing in any asset.
* Never take my personal opinions as investment advice, you may lose your money.
$USDT.D Rejeccted Again Altseason SignalCRYPTOCAP:USDT.D Rejected Again Altseason Signal
USDT Dominance is showing a clear rejection from the descending trendline and 200 MA, similar to the previous 16% drop.
The RSI is turning down from the overbought zone, signalling potential downside.
If this move plays out, we could see USDT.D fall toward the 4.0% zone, which is bullish for Altcoins.
DYRO, NFA

Bozo Benk – Road to Top 300
Bozo is a low-float, high-conviction breakout that’s showing all the early signs of a full-blown cycle runner. Right now, it’s flying under the radar — but that won’t last long.
coingecko: BozoBenk
Key Metrics:
Current Market Cap: $4.72M
Target Market Cap (Top 300 Range): ~$200M
Total Supply: 800M
Circulating Supply: ~400M (50% of tokens are locked)
If we hit a $200M market cap on just 400M circulating tokens, that gives a projected price of:
$200,000,000 / 400,000,000 = $0.50 per token
That's a 100x from here — and yes, that’s within striking distance in meme coin terms when a proper run begins.
Why This Isn’t Just “What If” Talk:
Low Float = High Velocity
With only 400M tokens in circulation, price impact per dollar is massive. When buyers show up, price moves fast — and that speed becomes the magnet.
Breakout Is Confirmed
After months of accumulation, Bozo just cleared its resistance zone. Volume spike. Momentum flip. Classic early-stage markup.
Reflexivity Effect
As price rises, more eyes come in. CT starts posting. Telegrams start firing signals. The crowd sees the move, and FOMO becomes self-fueling. This is how 10x becomes 50x.
Realistic Target Based on Ecosystem
$200M is not a moonshot. There are dozens of meme coins with less utility and worse structure sitting at or above that level. If capital rotates back into memes — and it always does — Bozo is positioned to ride that wave hard.
The Alpha:
This isn’t about “maybe” — it’s a perfect mix of low cap, reduced float, clean chart, and momentum fuel.
A $200M market cap on 400M circulating tokens = $0.50.
You're here at ~$0.005.
That’s the kind of asymmetry you don’t get often — and when it runs, there won't be time to chase.
Know what you hold. Trade it like you mean it.

Skeptic | Bitcoin Weekly Recap #15 Bull Run On? Altcoin Next?Hey everyone, Skeptic here! Bitcoin’s been throwing curveballs this past week—did it leave you spinning? 😵 Still unsure if the bull run’s officially on, or hunting for the perfect altcoin entry? Don’t worry, in this recap, I’m laying it all out with clear reasoning to give you a crystal-clear view of the market and help you ditch those FOMO-driven decisions. Here at Skeptic Lab , we analyze Markets with one motto: No FOMO. No hype. Just reason. We’re not like others who panic over dumps or hype every pump—we’ve got risk management , stop losses , and we stay glued to the market’s pulse. Let’s dive into the Bitcoin Weekly Recap and unpack it all! 📊
Monthly Timeframe: The Big Picture
Let’s zoom out to the last three months. The 74,000 to 82,000 range has been a rock-solid support zone for Bitcoin, with heavy shadows every time we touch it. Big shadows like that scream potential trend reversal, and right now, Bitcoin’s major trend is firmly uptrend. Until we see a clear signal for a trend change, all that noise about Bitcoin crashing to 50K or “the bull run’s over” is pure nonsense. If you hear anyone making those bold future price predictions, run the other way! Our job isn’t to predict the future—it’s to map out scenarios and have a plan when they play out. Comparing the 2022 bear market to now is flat-out silly. Why? Back then, we’d already seen massive gains, but now, we haven’t had significant growth yet—altcoins are quiet, and total market volume hasn’t spiked. The end of a trend isn’t when everyone’s scared of losses; it’s when everyone’s dreaming of becoming a millionaire and the news is pumping FOMO. 😄 So, ignore those baseless analyses and let’s get to the real stuff.
Weekly Timeframe: Momentum Check
On the weekly chart, we kicked off a solid uptrend momentum, even hitting a new all-time high. Bears tried to jump in and sell, but here’s the catch: the previous ceiling hasn’t been technically broken yet, so we haven’t gotten a clear buy signal. Why? Because support and resistance levels aren’t static—they shift over time. The longer time passes, the higher or lower these levels move, and they need updating. Right now, we got rejected after testing the ceiling because our true resistance is still intact. So, when do we get confirmation? Let’s drop to the Daily Timeframe for clarity.
Daily Timeframe: Spot Trigger
After breaking 112,000 , we’ll get the main confirmation that the last ceiling before the correction is broken, signaling the continuation of the major uptrend per Dow Theory. That’s our spot buy trigger—buy above 112,000 with a stop loss below 100,000 , giving you a 10% stop loss size. Please, manage your capital so that if you hit the stop loss, you lose no more than 3% of your total capital. Staying alive in financial markets hinges on risk management. Now, let’s hit the 4-Hour Timeframe for long and short triggers.
4-Hour Timeframe: Long & Short Setups
We had a solid upward trendline on the 4-hour chart, but it broke to the downside. When this happens, two scenarios are possible: either the uptrend’s slope has just softened with no trend change, or we’re entering a correction. My take? We’re likely heading for a time-based correction (think range-bound boxes). If we start ranging, don’t beat yourself up or pile into trades impulsively—win rates for most traders tank in range phases, and losing streaks pile up. For long positions, I suggest waiting for a break above 108,900 . That’s where we got a strong rejection and pullback last time, so we need solid confirmation to go long since bearish momentum is stronger in this phase. For shorts, 105,000 was a good level, but the next short trigger is a break below support at 101,577 . If we see a strong reaction at any level on this timeframe before that, you could short on a break there too. For breakout confirmation, indicators like SMA or RSI work, but volume is king. High volume on a break means it’s likely to continue; low volume screams fake breakout, so cut your risk there.
Bitcoin Dominance (BTC.D): Altcoin Timing
Let’s wrap up with a quick look at BTC.D to figure out if it’s time to jump into altcoins. BTC.D shows Bitcoin’s share of the total crypto market cap—the higher it is, the more liquidity flows into Bitcoin, often from altcoin sales. On the daily chart, we’re still above an upward trendline I mentioned in previous analyses, and altcoins haven’t made any real moves. When I say “moves,” I mean serious 100-500% or even 10,000% rallies , not just 10-20% pops. An altseason would be confirmed by a break of this trendline and a drop below support at 60.27. That’s when we’d expect massive altcoin gains, but it only works if Bitcoin’s already in a strong uptrend with solid market liquidity. Otherwise, don’t expect crazy altcoin pumps. The total market cap needs to be growing too for this to happen.
💬 Let’s Talk!
If this recap sparked some ideas, give it a quick boost—it means a lot! 😊 Got a pair or setup you want me to tackle next? Drop it in the comments. Thanks for joining me at Skeptic Lab—let’s grow together with No FOMO. No hype. Just reason. Keep trading smart! <3✌️

AKT/USDT Analysis💥 CSEMA:AKT - Swing Long Plan After 30% Correction 💥
AKT faced heavy selling pressure around the weekly pivot at $2.0640 , leading to a significant correction of nearly **30%**. The big question now: **Is it time to open a swing long?**
Here’s my take👇
Although we’ve already seen a 30% drop, that doesn’t mean the downside is over . For a high-conviction swing long, patience is key. I’m watching **three key levels** to build a position safely — no FOMO here.
🔹 Long Area 1 : $1.1291 (25% allocation)
🔹 Long Area 2 : $0.9722 (35% allocation)
🔹 Long Area 3 : $0.8234 (40% allocation)
💡 This is my ultimate swing long setup . Scaling in at these levels provides a better risk-reward profile rather than chasing the bounce.
But what if price only taps **Long Area 1** and then reverses? That’s fine too. The priority is **capital preservation and strategic entries**, not catching every single move.
✅ Focus: Make more with less risk
❌ Avoid: Emotional entries and overexposure
📌 Not financial advice. Do your own research. Trade safe! 🧠💰
#AKT #SwingTrade #CryptoAnalysis #TradingStrategy #DYOR #Altcoins

ETH Holding Long-Term Support – Road to $4K Open?CRYPTOCAP:ETH has successfully bounced from a long-term rising trendline that has acted as strong support since 2020. This trendline has historically triggered major bullish moves, and it’s doing its job once again.
Notably, ETH has also reclaimed the mid support/resistance level, which had previously acted as a key flip zone in past market cycles.
With both the trendline and horizontal support holding, the structure looks bullish. If momentum continues, ETH could head toward the upper resistance line, potentially targeting $4,000+ in the coming months.
The trend remains intact — this bounce could mark the start of a major leg up.

Actions Nightmare Is About To Be FinishedHello, Skyrexians!
Recently I shared this article about CRYPTOCAP:OTHERS.D where I pointed out that this chart is about to print another one lower low. Now it's happening, but this is wave 5 and now it's time to look for the altcoins bear market bottom.
Here we have 4h time frame and the internal structure of the final wave 5. Our main reversal signal can be divergence on Awesome Oscillator, and now it can happen if this drop will be decelerated. Price is inside the large green box - reversal zone. If we will see 3 rising columns on the histogram it's going to be the reveal signal with the yellow Elliott waves structure. This structure can be changed if price continues going down now without pullbacks. In this case I will recalculate waves and may be it will reach 7%. Also it shall match with BTC dominance which also has some space to go up. It shall at least retest the high at 65.5% (potential shortened wave 5).
Best regards,
Ivan Skyrexio
___________________________________________________________
Please, boost this article and subscribe our page if you like analysis!
