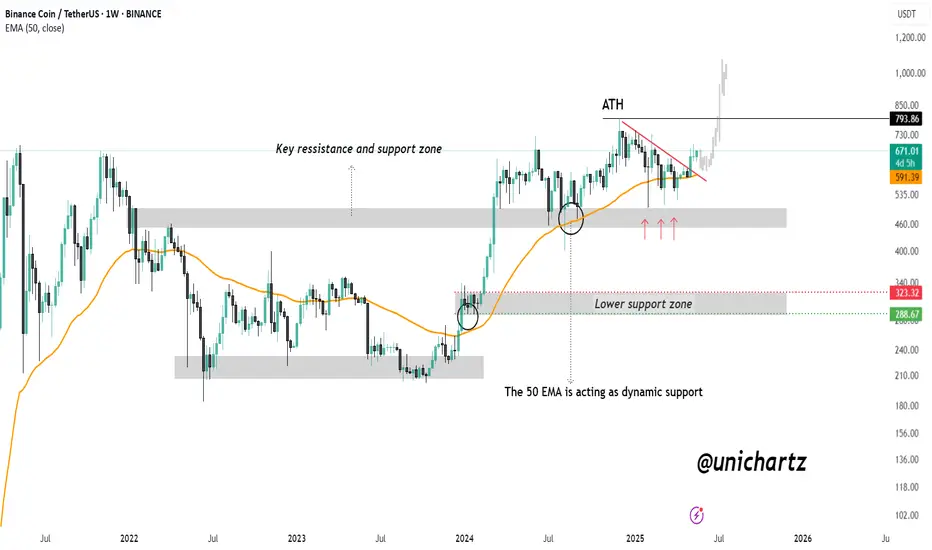
BNB Weekly Breakout: Road to $1,000?CRYPTOCAP:BNB is showing strong bullish momentum on the weekly chart. The 50 EMA is acting as a dynamic support, holding firm during multiple retests and providing a solid foundation for upward movement.
Recently, price action has broken above a key descending resistance line and successfully reclaimed a major support-resistance zone, turning it into a strong base. This area, which previously acted as a battleground for bulls and bears, is now supporting the current rally.
As long as BNB continues to hold above this zone and the 50 EMA, the structure remains bullish. With sustained momentum, a retest of the all-time high zone around $793 is likely, and a breakout above it could open the door for a move toward $1,000 and beyond.
DYOR, NFA
Altseason
SUSHI Token: A High-Potential Setup You Shouldn’t IgnoreHello everyone!
A huge opportunity has emerged on the BINANCE:SUSHIUSDT chart. I’ll break down the technical analysis for SUSHI using both the Daily and 4H timeframes , highlighting key levels and potential trade setups.
On 1D timeframe
- Price has swept the liquidity below the November 2024 low , forming an inverse Head and Shoulders pattern , which is a strong bullish reversal signal.
- Price recently broke did the May high after that retraced approximately 24% . This pullback aligned perfectly with a retest of the neckline from the inverse Head and Shoulders pattern, reinforcing its validity as a bullish setup.
On 4H timeframe
- If price breaks above $0.775 , it would serve as a confirmation of bullish momentum, suggesting a likely move toward the liquidity zone above $1.00 .
- In my opinion, if market conditions remain bullish and Bitcoin continues its upward trend, SUSHI is likely to break above the $1.00 level with ease and potentially reach the inverse Head and Shoulders target around $1.20+ .
In conclusion, SUSHI is currently showing strong bullish signals, and if the broader market gives altcoins room to run, this token has the potential to rally aggressively.
Note: SUSHI is a low-cap token with high volatility, so exercise proper risk management when trading or investing.

HolderStat┆BNBUSD digesting the wedge breakCRYPTOCAP:BNB shattered a year-long descending wedge, sprinted to 670 USDT, and now forms a pennant atop the 620 neckline. Holding 620 keeps the 700-730 target alive; drop below 600 and price risks sliding back inside the old wedge toward 560. 🔔

HolderStat┆ADAUSD trend support in focusCRYPTOCAP:ADA slid from 0.84 into the long-standing 0.72 up-trend that has anchored every rally since April. Regaining 0.78 re-targets 0.88-0.92 and eventually the 1.00 psyche level, while a daily close beneath 0.70 warns of a deeper probe toward 0.64. 🌟

HolderStat┆XRPUSD guarding the breakout lineCRYPTOCAP:XRP rocketed from a triangle breakout to 2.6 USDT, then retraced to the 2.30-2.35 confluence of breakout trendline and rising support. Higher-low structure is alive: maintain it and the measured path opens toward the 2.85-3.00 resistance band. A decisive candle under 2.25 would neutralise near-term upside. 📈

HolderStat┆SOLUSD retesting the supportCRYPTOCAP:SOL has ridden a well-behaved growth channel since early April. After rejection at 180 USDT, price tests the channel spine around 165, which also marks the April breakout node. Defend it and the upper rail near 195-200 beckons; lose 160 and eyes shift to the lower boundary close to 150.

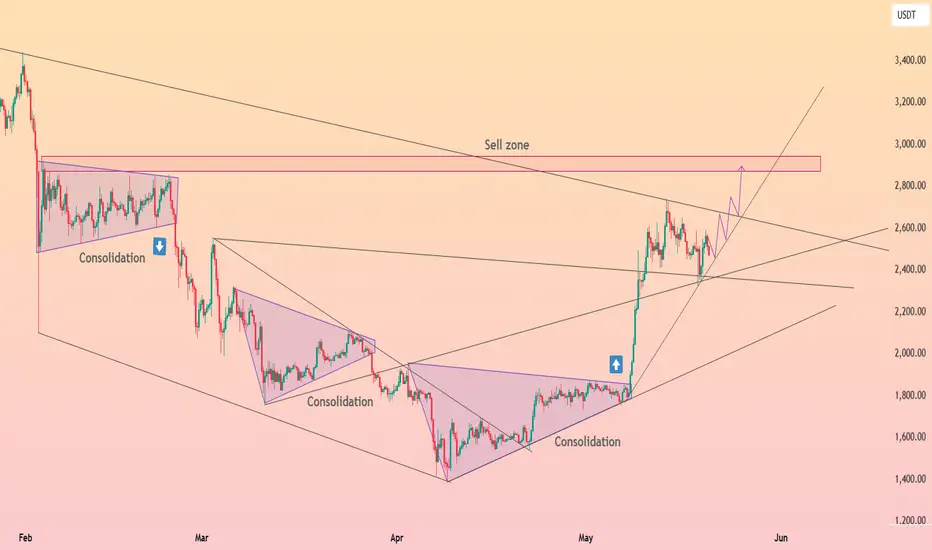
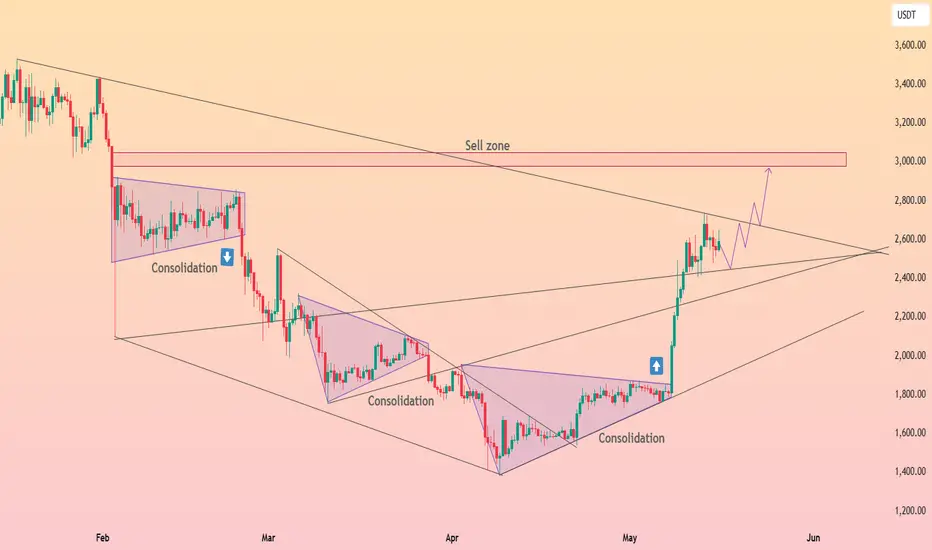
HolderStat┆ETHUSD reboundedCRYPTOCAP:ETH exploded out of its multi-month falling wedge, racing from 1.8 k to 2.7 k. It now straddles the broken wedge roof plus a fresh rising guide at 2.45-2.50 k. Hold that shelf and the chart still projects into the 2.9-3.0 k sell zone; slip beneath 2.35 k and bulls will likely regroup at deeper support near 2.2 k. 🎯
THESE ALTS can +100% | ALTSEASON PART2️⃣Altseason usually happens when BTC trades close towards a new ATH, as it is doing now, and takes some time to stall/trade sideways
Now this season is working a little differently. Usually ETH makes its way towards new highs, but we haven't seen that just yet. Ethereum has HUGE upside potential still.
It's hard to say just how high Ethereum can go, but what we do know is that it's still 88% away from the previous ATH, and due for a new one...
ENA is another alt with big upside potential, from it's previous peak its more than 200% away:
Solana has made a strong V-shaped recovery and if ETH is primed for new ATH, SOL is sure to follow:
TRUMPcoin may be memecoin, but the again so is PEPE! Still big upside after a long while of range trading here:

IOUSDT: Inverse Head & Shoulders Breakout – The Reversal is RealBINANCE:IOUSDT has just completed a textbook Inverse Head and Shoulders pattern, one of the most reliable reversal setups in technical analysis. After a prolonged downtrend that left the asset oversold and undervalued, the market has begun to shift. We’ve now seen a clean breakout above the neckline and a healthy retracement back to it. A classic confirmation signal that often precedes strong bullish moves.
This shift is further supported by the emergence of higher highs and higher lows on the smaller timeframes, suggesting that bullish momentum is building. With the downtrend now exhausted, BINANCE:IOUSDT looks poised to begin a new uptrend that could offer solid upside potential for early entrants.
As always, risk management is key. While the pattern setup is strong, it’s crucial to place stop losses just below the right shoulder or neckline to protect against unexpected volatility. The market doesn’t offer guarantees, but this setup offers high-probability conditions worth paying attention to.
BINANCE:IOUSDT Currently trading at $0.98
Buy level : Above $0.95
Stop loss : Below $0.76
Target : $2.65
Max leverage 3x
Always keep stop loss
Follow Our Tradingview Account for More Technical Analysis Updates, | Like, Share and Comment Your thoughts

ALTS - Altcoins you MUST WATCH for ALTSEASON1) ONDO | BYBIT:ONDOUSDT
After some consistent higher lows, ONDO is likely on its way back towards it's previous ATH:
2) ATOM | BINANCE:ATOMUSDT
Cosmos is one of my favorites, and I'm patiently waiting for the parabolic run on this one:
3) SONIC | BYBIT:SONICUSDT
SONIC / previously FTM is trading nearly 290% away from its previous ATH, with great upside potential.
4) AAVE | BINANCE:AAVEUSDT
AAVE still has a bit to gain before reaching its previous ATH, and the parabolic run has actually already started:
5) ENA | BINANCE:ENAUSDT
IF ENA can hold it's current support, there's a huge upside awaiting this alt:
😊🧡 Please like and follow !!

XRP vs XVG 8 Year Triangle Fractal Comparison 05 2025Logarithm. Time frame 1 month. Linear chart for clarity. Two cryptocurrencies of the super hype of altcoins in 2017 (the final alt season of the cycle before last). XRP is ahead of XVG. The structures are similar, but if XVG breaks through the triangle upwards like on XRP, then work with the first target, observing risk management. You can leave 5-10% of the position for the second target, but this is not necessary. As for XRP, everything is as before... local update in the XRP idea.
XVG Secondary trend (part) Resolution of the triangle 8 years 05 2025
XRP/USD Main trend 28 07 2022

THETA Token Is In A Larger Flat CorrectionTheta Token with ticker THETAUSD made a deeper retracement in the last year, but it’s actually still above 2023 lows, so it can still be a larger regular 3-3-5 A-B-C flat correction in play. After recent projected five-wave impulse into wave (C) of a three-wave (A)(B)(C) decline in blue wave B, it can be now on the way back to March 2024 highs for blue wave C, which could be a five-wave impulsive cycle. Currently, it can be still unfolding a lower-degree five-wave impulse into wave (1), so more upside is expected for wave (3), especially if breaks above 1.74 bullish level, just be aware of wave (2) pullback.
Theta Token (THETA) is the native cryptocurrency of the Theta Network, a blockchain-powered platform designed for decentralized video streaming and content delivery. It aims to improve the efficiency and cost of streaming by allowing users to share bandwidth and computing resources on a peer-to-peer basis.

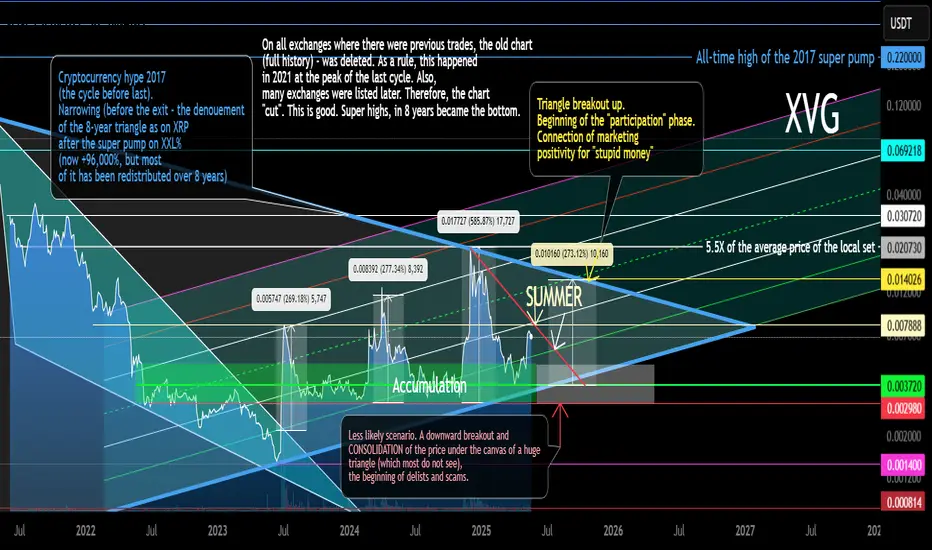
XVG Secondary Trend (Part) Triangle Resolution 8 years 05 2025Logarithm. Time frame 3 days. Linear instead of candlestick specifically for clarity. This is the longest chart history on tradingview that could be found. It does not display everything as is. Where this cryptocurrency was previously traded, the exchanges deleted the entire trading history. Listing on new exchanges does not display the whole picture. I described and showed everything on the chart. More in the channel, screenshots and comparison with XRP, here the site does not provide an opportunity to make such a comparison, as there are simply no charts of such history.
Verge (XVG) like XRP identical chart of the main trend, and the same 8-year triangle after the pumping of 2017. The only difference is that XRP came out of its triangle half a year ago, in alt season #2 of this cycle, and this cryptocurrency is still in the canvas of its triangle. But the price is gradually being driven into a corner. In alt season #3, most likely, the denouement of this story lasting 8 years will occur. More up than down (at the beginning).
Verge (XVG), like XRP, is an asset of the super pump of 2017 and the price retention is -96-98% from the super pump by hundreds of thousands of percent (I am not mistaken exactly so), which forms a huge triangle on XXX (8 years). This is all inherent in the assets of the hype of 2017: XVG XRP NEM XLM ZEC XMR DASH LTC and so on ... Some of them, over the past 2 years, have become on the path of hype (XRP XLM), and some on the path of scam (I do not want to make anti-advertisement).
Most likely, everything will repeat on XVG, as on XRP, but only at the right time, in the final alt season of this cycle. "XVG captains" do not have as much money and a powerful state behind them as XRP, to go against the market and the general trend, therefore, they need the market hype to distribute "a little higher". And so with most of these altcoins. Do not forget to get rid of them on the pump. Remember, the more down-to-earth goals, the more likely you are to earn over the long term. Observe risk and money management.
Remember, there is a big alt season ahead, provided that you are an adequate person and your goals are appropriate.
Has the Alt Season Started?Cash Data 1W
By analyzing the weekly Cash Data chart of TOTAL3, we observe that after a rapid and significant rise, a correction in TOTAL3 has begun, which appears to be forming a Neutral Triangle pattern.
Wave Analysis:
Wave-(c) is a double pattern with a small X-wave, making it the most complex wave. However, there is a possibility that wave-(d) could become more complex than wave-(c). We are currently in wave-(d). Given that wave-(b) has surpassed the start of wave-(a) and wave-(c) has been fully retraced by wave-(d), there is a likelihood that a Running Neutral Triangle is forming. For confirmation, wave-(d) must exceed the starting point of wave-(c).
Conclusion:
Based on the analysis, wave-(d) could rise to the range of 1.14–1.38 trillion USD. Subsequently, wave-(e) will begin and may conclude within the retracement zones identified on the chart. To accurately determine the target for wave-(e), we need wave-(d) to complete, allowing us to predict the end of the Running Neutral Triangle with greater precision.
After the completion of the Running Neutral Triangle, we expect a significant rally in altcoins.
Good luck
NEoWave Chart

ETH + ALTSEASON | NEW All Time Highs Soon ??This would have been the first time that BTC made a new ATH during a bullish cycle, but ETH didn't - are we too hasty?
Very interesting to compare the two side by side and see that ETH has much more to gain than BTC:
The BTC new ATH update can be found here:
______________________
BINANCE:BTCUSDT BINANCE:ETHUSDT

HolderStat┆BNBUSD consolidation breakout hunts 700-720CRYPTOCAP:BNB ended a protracted falling-channel decline by igniting from a tight consolidation rectangle around 600 USDT. The ensuing surge stalled near 670 and is now rechecking the breakout zone at 640, which also aligns with the underside of a freshly drawn rising wedge. A successful hold here could catapult price toward the 700-720 resistance corridor, the depth equivalent of the prior consolidation range. Slip back under 620 would risk sliding into the old channel.

HolderStat┆ADAUSD wedge exit sets sights on 0.95-1.00CRYPTOCAP:ADA cracked its descending wedge in early May and quickly reclaimed the 0.78-0.80 consolidation shelf. Price is now travelling inside an embryonic ascending channel that intersects long-term support at 0.76. Holding above that floor leaves room for an advance into the 0.90-0.95 resistance box, with the upper rail flirting with the psychological 1 USDT mark. Failure to defend 0.74 would postpone—but not invalidate—the bullish blueprint.

HolderStat┆XRPUSD textbook triangle retest fuels 2.9-3.0 aimCRYPTOCAP:XRP pierced a five-month symmetrical triangle and instantly wicked back to retest the breakout line near 2.20 USDT, leaving a long tail labelled “retest.” The rebound has carved a series of higher lows, indicating accumulation above trend support. As long as 2.20 holds, the measured move projects toward the 2.85-3.00 resistance band drawn by February’s highs. Closing beneath the retest level would neutralise the immediate upside bias but broader ascending guides remain constructive.

HolderStat┆SOLUSD 165 retest could launch 195-200CRYPTOCAP:SOL escaped a falling channel in April and has since respected a well-behaved growing channel. After tagging 180 USDT resistance, price is backing into the channel heart around 170 with potential for a classic 165 support retest. A bounce there would position bulls to challenge the 180 lid again and potentially sprint toward the channel extension at 195-200 USDT. Breakdown below 160 would mark the first technical warning of fatigue.

HolderStat┆ETHUSD wedge liftoff eyes 3 k sell zoneCRYPTOCAP:ETH blasted out of a multi-month falling wedge, erupting from 1.8 k to 2.7 k in one vertical burst. Price is now hovering above the broken wedge roof and an intersecting long-term trend line at roughly 2.55-2.60 k. If this freshly minted support holds, the pattern’s measured move directs attention to the 2.9-3.1 k sell zone in red. A dip under 2.45 k would simply delay, not negate, the bullish structure while the broader trend stays up-sloping.
ZRO (LayerZero) Fresh coin. 19 05 2025Logarithm. Time frame 3 days. The creators of the cryptocurrency "threw" a huge number of their flock, and distributed an airdrop of "pennies", thereby reducing the price burden on themselves in the bearish trend of altcoins. Therefore, this cryptocurrency, unlike others, has a stronger chart, and the decline was only -80%. This is quite small, considering that the capitalization is in 170th place at the moment.
I specifically superimposed 2 channels on top of each other, ascending and descending. There were a lot of lines, but these dynamic support / resistance will be felt by the price in the future.
🟣 Now a triangle is being formed locally , it rested against the downward local trend, from its breakthrough / non-breakthrough, and depends on which global channel the market will be pulled on an average urgent basis. Sorry, the price of this cryptocurrency.
🟢 Local targets of the triangle , which can become an ascending pennant are shown on the chart.
🔴 Also, a descending target is shown, if the trend is not broken and the triangle works down.
Fundamental (not a legend). LayerZero supports any blockchain that can run smart contracts, such as Ethereum, BNB Chain, Avalanche, Polygon, Arbitrum, Optimism, Fantom and other chains. LayerZero also supports non-EVM chains, such as Aptos. These so-called omnichain applications should become a key layer of the multi-chain future, where different blockchains interact simultaneously.
It is worth noting that the fundamental does not really matter, and cryptocurrencies move (rationality of creators and market maker + real supply/demand) in accordance with the market as a whole, with very rare exceptions, which, as a rule, have a manipulative nature and a very short time.
Also, it is worth noting that when the altseason begins, this cryptocurrency can be greatly pumped up, given the emission of cryptocurrencies in one hand, and the real demand in the future for this protocol for different blockchains.

LITCOIN : So what is an ETF ?Hello friends
Be careful with the recent fluctuations of this coin because the movements of this coin have become unpredictable and we suggest that if you want to buy, buy in the specified support areas and in steps, of course with capital and risk management...
We have also specified targets for you.
*Trade safely with us*

IRON Main trend. Channel. 18 05 2025Logarithm. Time frame 1 week. Down from the listing price -98%. Dying asset. Suitable for pump/dump strategy work, without reference to the ticker name in the spot, with down-to-earth goals, but understanding the high volatility of these assets due to low liquidity (“dying assets”). Work without stops (they are destructive for such assets with such volatility), from the average price of the set/dump. It is advisable to work on a breakthrough of key zones (understanding the liquidity of the asset, and the amount of the entry amount).
Asset as an example, crypto wrappers of such liquidity and work on them now. There are thousands of similar ones on the crypto market. Therefore, there is no point in considering them separately. One similar one, projection - if not thousands of dying scams (created under the hype of the distribution of the last cycle), then hundreds.
🟢A “Dragon” pattern may form if the downward secondary trend is broken. More precisely, it will be broken if a short alt season starts now for alts. The target is in the previous consolidation zone, and to cross the dynamic resistance of the inner zone of the descending channel (zone of decreasing highs). It is rational to work for a breakthrough, understanding the liquidity of the dying asset.
🔴If the market is negative, then the rollback from this descending line will continue to the dynamic support of the channel in the designated zone. If below, then it is a scam and delists from other exchanges where it is traded.
