USDT.D Head & Shoulder Pattern: Target 4.00%UDST.D is showing signs that we're about to head into a major upswing in crypto and ignite ETH as well as alt-season.
The H&S target is 4.00% on the dot. Further downside from there likely if we hit our target which I'm guessing will happen in next 1-2 weeks.
Altseason

TOTAL 2Total2 next coming zones.
First is the 730 then bounce then crash to 400-230 area then bullrun start

BTC road to $28k BTC finished it is upwave move from 15k to 110k
Next is the flush crash. The first zone is 66k then bounce then flush crash to $28-27k then the road to the $1M start and market bull-run that many have been waiting for in altcoins while altcoins been bleeding hard since December many traders avg wallets are -70% while even BTC at 100k zone.

Your Guide to Token Trends & Market Action – With My AnalysisHey everyone! Hope you're all enjoying a great weekend !
If you'd like a Token analysis , please drop your request in the comments using the format below:
Request Format :
Project Name: Bitcoin
Token Symbol: BTC
Please Note:
I’ll be analyzing up to 10 tokens only .
One request per person — make it count!
Your analysis will be posted directly as a reply to your comment .
If you find this helpful, don’t forget to ✅ Like ✅ and Share it with your friends.
Wishing you health, wealth, and massive success!

BTC Medium Term and Local Work for 2025 18 05 2025Logarithm. Time frame 3 days. Everything is shown extremely accurately, according to technical analysis, logic based on cyclical repetition, and liquidity consolidation zones as a result of price and trading movements. This trading idea, with precise reversal zones and targets, will last you for 31 weeks. That is, for 7 months.
The previous trading idea BTC/USD Triangle. Medium-term and local work , published on 7 06 2024, it lasted me almost 1 year. It has 63 local work updates (I don't spam with new trading ideas on principle). So, nothing will get lost, you can follow everything, read, possibly use it as training material on a live chart, as a whole explanation of local work, what is really happening on the market, profit/loss potential, always before the price movement, and not after the fact. I show what is, that is, a chart and potential work from the position of a trader, not a crypto marketer.
🟣 Local and medium urgent now
1️⃣💸 The bullish triangle itself (which is not there yet, I have depicted it on the chart for you) acts as a stop and consolidation zone (zone “psychology 100”, reset in trend No. 1). This is the easiest to manipulate and the most probable scenario. This will just be the summer consolidation. Instead of it, there may be:
2️⃣💸 Rising wedge , but more in shape like a triangle (essentially a wedge, there is a meaning of a triangle, but it was formed on aggressive pump news), with a large short liquidity takeout, and not very good logic of the TA movement after that... But, this is a bullish scenario, although quite aggressive.
3️⃣ Working out the bearish targets of the triangle (non-corrective price movement within its canvas). Stopping the decline in the designated zone and reversal upward (continuation of the trend). I emphasize the importance of not fixing the price below the zone of targets of the local corrective decline, which will not break the trend.
4️⃣💸 Double top (or triple). Double top as in 2021 in the distribution zone. This is the least likely scenario, but the most negative, as it breaks the trend. But, this is the least likely scenario, primarily because of the altcoins.
Altcoins in 2021 and now.
4️⃣In 2021, when Bitcoin formed a double top, they (altcoins) were in “space”, that is, in their distribution zones (+500-1000% of the average price of the set).
🔽Now everything is the other way around, they are in capitulation zones (most of them) or in their long-term accumulation channels :
Liquid -90-93%
Medium liquid -93-96%
Low liquid -96-98% or some are already scams or on the verge of it...
Some altcoins have pumped up earlier. That is, they left their long-term accumulation zones earlier. For example: SUN, XRP, DOGE, PEPE, SOL and so on... But there are very few of them, as distributing (raising the price, holding it and selling, inspiring to buy expensive when everything is cheap) in a bearish altcoin trend is very irrational, and you need a lot of money to go against the general market trend.
Main trend (most of it, chart since Binance Exchange foundation) for clarity on a large time frame of this local zone for work.
BTC Primary trend. Secondary — expanding triangle.

eth buy midterm"🌟 Welcome to Golden Candle! 🌟
We're a team of 📈 passionate traders 📉 who love sharing our 🔍 technical analysis insights 🔎 with the TradingView community. 🌎
Our goal is to provide 💡 valuable perspectives 💡 on market trends and patterns, but 🚫 please note that our analyses are not intended as buy or sell recommendations. 🚫
Instead, they reflect our own 💭 personal attitudes and thoughts. 💭
Follow along and 📚 learn 📚 from our analyses! 📊💡"

LAUNCHCOIN - New TrendKeep an eye on Launch Coin. it could be the next trend in the making.
LAUNCHCOIN

$LINK Long Overdue Move on the Horizon
BIST:LINK has shockingly been a very poor performer as well considering their revolutionary tech connecting web2 -> web3
Dump >67% and rebounded 50% since then.
PA has been trapped between the 200 and 50DA, which suggest voilent breakout coming up.
RSI Is still healthy.

$SOL and Most Major Alts Get Hard Rejection from 200DMAMost of your favorite Alts such as CRYPTOCAP:SOL had hard rejections from the 200DMA.
If this trend breaks into the red box we should see a retest around the .236 Fib and 50DMA ~$140
RSI also looks McDonald's toppy
Not a good time to FOMO.
PS. Normally i dont post TA this late in the night from the US but I'm gonna consider doing more if i get some decent engagement.
Lmk if you think i should post more at these midnight hours 🎃

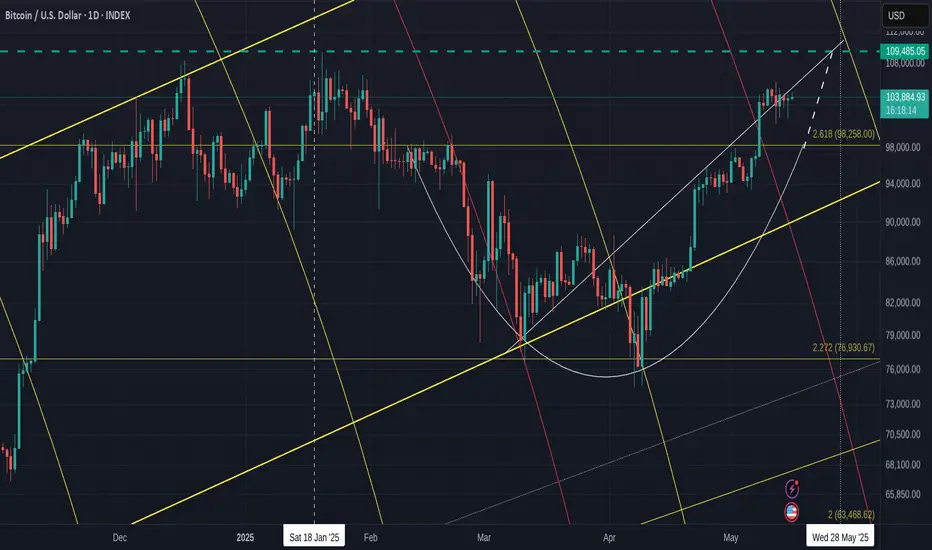
Comprehensive BITCOIN Analysis for the next 7 days - DAILY chart
First Off - Sorry for all the lines on the chart but EVERY one is very relevant to what is happening right now.
The Dashed Blue Horizontal line is the current ATH line. possible Resistance.
The 2.618 Fib extension has not yet been tested as support. This could happen still, at any point till end of month and is around the 98K usd zone.
PA has Ranged through the Local rising line of support, as if it no longer existed, which was a little surprising given the strength that PA has still. There maybe some uncertainty in the air.
PA is above the neckline of the Cup pattern it printed and, again, it would not be unusual to see PA come back down to test this Neckline as support, which is on that 2.618 Fib extension.
The Bold Yellow line is Long Term Support line since 2015, showing that Bitcoin PA is in the Lower side of a Long Term ascending channel, with plenty of room to rise,
PA has a lot of inert strength right now, so, we may not see this retest happen.
We just have to wait.
BUT you can see that Rising dashed line, the extension of the Cup pattern.
PA may range across into this and bump into it next week. If it acts as support again, PA will then be pushed into a tight Squeeze against the other rising line of support, with an Apex on the current ATH line.
PA ALWAYS REACTS BEFORE THE APEX
All that points towards some Volatile times next week if PA remains in this area.
The other descending line there is a 618 Fib Circle. You can see that 98% of the Time, PA is effected by these.
All this shows us 4 points of resistance, in the same Zone, All Next week and PA will Either Shoot through it with a Big push, Or we may see PA Drop back down. The Big question being, how Far ?
We do not want to loose the 2.618 Fib ext at 98K
But what else can we look at. ?
The RSI DAILY
This is still up high in the near Over Bought zone. It can range up here for extended periods but this is something we should be aware of as the possibility of a drop does exist.
On the weekly, RSI has room to move higher & the 4 hour is in neutral zone, again with ability to push higher.
The MACD DAILY
This is once again curling over and about to test the red signal line as support.
On a 4 hour chart, the MACD is down on Neutral line, giving it strength to push higher and if that continues, we will see the yellow MACD line bounce off the Red signal line on the Daily chart.
Once again, Look at the Histogram and the similarity to the area that the Arrow is pointing at.
We could repeat this but on a larger scale. We have to wait and see if this happens.
But also note how there was a Visit into a red Histogram ( for 4 days ) before the bigger push and I remind you about what has been said above.
So, what else can we look at that may offer some ideas ?
The Chart below is the 4 main Crypto Dominance charts by market Cap - 4 hour
BTC.D - ETH.D
OTHERS.D - USDT.D
( OTHERS = Top 125 Coins MINUS Top 10 by Market Cap) Mid to Low cap
We have recently seen a Drop in Bitcoin dominance, giving the ALTS some time to push higher. This is seen with the BTC.D dropping and the ETH.D and OTHERS.D rising
Also note how USDT.D Dropped, showing that stable coins were being exchanged for Crypto,
And as we see now, we have the possibility of BTC.D being rejected by its 50 SMA ( Red)
ETH.D is above its 50 SMA, showing it had a good push and may get support if PA drops
OTHERS.D has already fallen below its 50 SMA, showing a brutal sell off, rapid profit taking.
That is the world of ALTS.
In the last 48 hours, we saw a return for Bitcoin as it rose from a shallow Low in its Range. This was enough to cause a sell off of the ALT coins as we see in the Drop in Others.D
ETH however, remains in a range with obvious intention to continue higher if the market allows.
Lastly, we can compare Bitcoin to the other Markets
Bitcoin - CFD GOLD
DXY - S&P500
Bitcoin has performed well. It has reclaimed some position on Gold recently while it climbed alongside the S&P
We can also see how BTC climbed while DXY dropped.
This highlights some Flaws in using the BTC USD pair to judge the success of BTC but this is explaned better in another post. But in short, If the $ looses Value and your BTC USD pair appears to climb, theg ain is lost as the $ is worth less.
Use BTC XAUT pairs. Bitcoin Gold Pair - Historically, GOLD looses little Value by comparison. So when Bitcoin gains against Gold..It is WIN WIN
So, in conclusion, we see Bitcoin under some pressure to avoid Lower or sharper Drop in the short tern.
The Lower Timeframes show us that BTC has the ability for a Continued Range but with caution.
We see ETH ( and larger Alts ) intent on remain in the game now they have had a small glimpse of Gains
And we see that Mid and Lower Cap Alts are mostly just money makers providing you play the game right. And that game may have some more time if Bitcoin Stumbles in the next 7 days.
And that possibility does exist.
Today is crucial in many ways and will set the tone for the following week.
There is Financial Data being released by the USA today and if unfavourable, we may see some sharp moves.
And ,Longer Term VERY BULLISH - I HOLD AND CONTINUE TO BUY WHEN I CAN ON SPOT ORDERS
I hope this helps and I am grateful for comments
OFFICIAL TRUMP Main trend. 16 05 2025Logarithm. Time frame 3 days. After a super pump and a drive of "stupid money", a descending channel was formed on a natural dump. The price came out of it. Now a triangle is forming. The price is clamped. The reversal zones and percentages to the key support/resistance levels are shown extremely accurately according to TA.
If there is no aggressive exit in the medium term, then there will be consolidation and, as a consequence, the formation of a horizontal channel "sholtai / chattai", its key zones are shown.
Now, this "cryptocurrency" is now on 16 05 2025 in 41st place by capitalization.
Reductions from the price highs are about -90%.
From the liquid zone about -84%.
These are not the minimum values of the decline of such hype cryptocurrencies. Just take this into account in your money management. For clarity, the level zones and the % of potential decline if the trend breaks again are shown on the chart (pull the chart down).
Even with such a decline, the price is now at a huge profit. I am not speaking for the creators of the cryptocurrency, but for the first speculators and "investors" who may not have sold everything on the hype.
For the creators of the cryptocurrency, perhaps these are manipulators close to the Trump family, for them, any sale is super profit. But in order to sell, you need to maintain liquidity, and from time to time make interest in speculation and asset retention by investors, that is, do pumps and hype. Use this, and do not be greedy...
Levels and zones, pump/dump, which the price will "feel" are shown in advance. Click "play" on the chart and move the chart up. With a high degree of probability, the hype and pumping of the price of this cryptocurrency will be repeated, given the hype and the long term of the political figure whose name this cryptocurrency bears. Now it is a Trump dump, in the future it will become a Trump pump for some time.
Do not forget to sell on the next hype. If you understand that you are very greedy, and the news background affects you, then sell in parts, or use stop losses to protect profits.
There is no need to guess the minimums and maximums. It is important to know these zones, and have an acceptable average price, from the position of the trend, and its potential. It is regulated by the distributed entry volume (in advance) at potential reversal zones.

ETH ANALYSE We have two key levels to watch on ETH:
- Either the price reacts upwards on the $2401 level in H4,
- Or it falls further and reacts at the $2,121 Daily level.
Either way, the fall should not last too long.

HolderStat┆BNBUSD 645 gate opens 730BNB price surged out of a steep falling channel and later coiled inside a tight consolidation rectangle, igniting a vertical drive that now hovers under the 645 USDT horizontal cap. Holding the breakout origin at 600‑610 keeps the upside narrative intact; clearance of 645 exposes the 720‑730 objective derived from the earlier channel depth.

HolderStat┆ADAUSD down‑trend break, $1 goalCardano price popped its lengthy descending channel, using a 0.62‑0.78 consolidation base as springboard to reclaim 0.78 USDT. Provided buyers defend that level, the move unlocks an advance into the 0.95‑1.00 resistance ribbon flagged above. A close beneath the rising guideline from April lows would dampen, but not invalidate, the emergent ADA breakout.

HolderStat┆XRPUSD retest complete, $3 aheadXRP price completed a clean wedge breakthrough at 2.5 USDT, snapped back for a textbook retest on the same line, and has since printed a series of higher lows. Momentum favors continuation toward the 2.9‑3 k supply shelf shaded on the chart. Failure to hold the reclaimed trendline would neutralize, but not yet reverse, the present bullish bias.

HolderStat┆SOLUSD 180 $ flip, 200 $ nextSolana price escaped April’s consolidation box, flipped the old down‑sloping resistance into a rising support line, and is now pressing the 180 $ ceiling inside a well‑defined growing channel. A decisive daily close above 180 transforms that barrier into a launch pad, opening the measured channel extension toward 200‑205 $. Channel lows near 150 remain key invalidation for the bullish momentum.

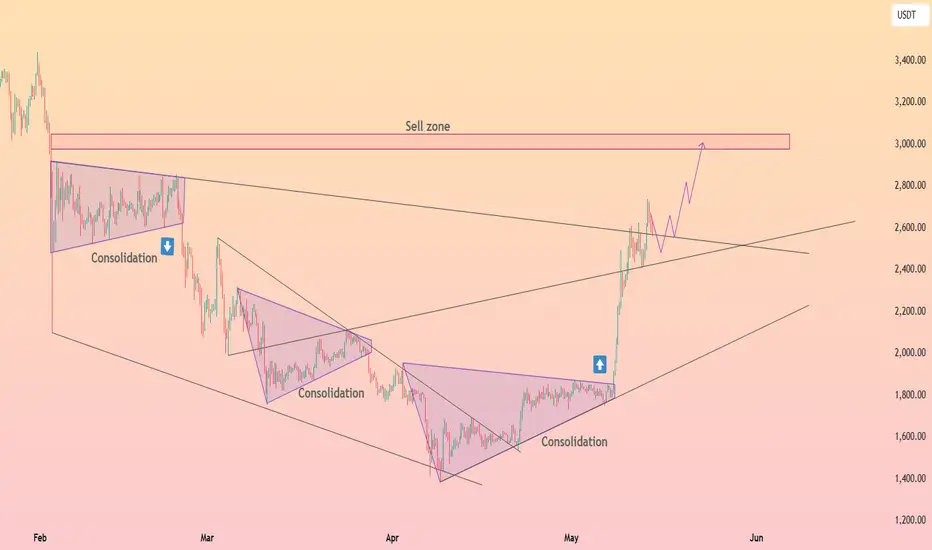
HolderStat┆ETHUSD wedge catapult toward 3kEthereum price tore out of its multi‑month falling wedge and smaller consolidation triangle, blasting through the mid‑2 k range before pausing around 2.7 k. As long as price respects the former wedge roof as trendline support, bulls retain scope to probe the highlighted 2.8‑3.1 k sell zone. A soft pullback into 2.4‑2.5 k would be viewed as a constructive retest rather than trend failure.
Altcoin Market Holding Strong – Breakout on the Horizon!📈🚀 Altcoin Market Holding Strong – Breakout on the Horizon! 🌈📊
Hey Traders!
The altcoin market is gearing up for a powerful breakout! TOTAL3 (the altcoin market cap excluding BTC and ETH) is holding perfectly above the critical $893B support zone. This is exactly the kind of price action we expect before major upside explosions!
📊 Key Levels to Watch:
📍 Support Holding Strong: $893B – Bulls are defending this level with conviction.
🚀 Breakout Zone: A clear move above $900B sets the stage for a rapid surge toward $1.13 Trillion, a potential +25% rally!
✅ The structure is bullish, momentum is building, and the charts don’t lie—this market wants higher!
📚 Why This Time Feels Different:
BTC dominance is struggling at resistance—this is the perfect environment for altcoins to shine! 🌟
Real crypto projects are finally starting to show strength amid all the meme coin noise.
We’ve seen this setup before… and it led to explosive alt rallies. History may not repeat perfectly, but it sure loves to rhyme! 🎯
💬 Your Next Move:
Are you already positioned for this altseason breakout, or planning your entries now?
Which altcoins are you most bullish on for this run to $1.13T and beyond?
This is the moment serious traders wait for—don’t let it slip by! The market is loading the rocket… will you be on it when it takes off? 🚀
One Love,
The FXPROFESSOR 💙

BTC bull cycle comes to an end.We can see it clearly on the chart. BTC has ended the 5 waves pattern in Elliot wave count. you can see it on the chart, you can see it on the MACD & RSI.
What we are seeing now is that because of Greed & Hype no one is selling bitcoin. the up-trend we are seeing now is the result of no sellers and Hype Buyers. This is a bull trap. We can see the divergence clear as day. Stay alert and dont let them catch you this time.

I see ETH break the trend lineETH owner buy enough coin in their wallet with breaking the descend line.

APEX Main trend. DEX exchange Bybit. Hype and super pump 05 2025Logarithm. Time frame 1 week. Correction (descending channel, two distribution zones) after a super pump of about 1500%. All key support and resistance zones were shown, including dynamic ones.
Also showed a local target in percentage in case of exit from a local descending wedge. There is a possibility that the price will enter the mirror support zone of the previous volatility zone of the horizontal channel, or even to the median (green dotted line). Just remember this. When working with the crowd hype, remember the risks.

Altcoins are in a similar channel as in 2022–2023.I believe that as long as the interest rate stays at 4.5%, we won’t see real growth in altcoins — only short-term pumps. Rate cuts are expected to begin in the summer, but it will take some time to have an effect. I would compare the current market to both 2019 and 2022.

Decided to enter Zerebro for the public portfolio.Decided to enter Zerebro for the public portfolio; AI agents are growing well. Potential upside: +140%.
Zerebro (ZEREBRO) is a decentralized AI system on the Solana blockchain, creating and distributing content across social media and crypto communities. Using RAG technology, it generates unique texts, NFTs, and memes, avoiding templates. Operates on X, Instagram, Telegram, integrated with Solana, Polygon, and Bitcoin. Token price: ~$0.05, market cap: ~$50M.
