SUI Next Upside Target🚀 After holding above the April low and completing a 3-wave pullback in wave (2), CRYPTO:SUIUSD is now advancing in a potential wave (3).
Momentum is building, and the next upside target lies in the equal legs zone at $4.80 – $5.40, which could eventually lead to a new all-time high.
Altseason

HolderStat┆ETHUSD retest of the resistance lineBINANCE:ETHUSDT has exited a falling wedge and is forming a bullish continuation pattern. With price action building above $2,500, a breakout toward $2,800 is in play, targeting the supply zone around $3,000. Structure favors bulls.

ETHEREUM BREAKOUT CONFIRMED!Hey Traders!
If you’re finding value in this analysis, smash that 👍 and hit Follow for high-accuracy trade setups that actually deliver!
After months of consolidation inside this massive symmetrical triangle, ETH finally breaks out on the daily chart—and this could be the spark for the next major rally! 🔥
📈 Structure: Symmetrical Triangle
✅ Breakout Confirmed
📍 CMP: ~$2,760
🎯 Next Major Target: $5,000+
This is the breakout bulls have been waiting for! If momentum sustains, ETH could enter price discovery territory soon. Buckle up—the real move might just be beginning. 🚀
Let’s see how far it runs from here!
Drop your targets in the comments 👇

HolderStat┆XRPUSD got out of the consolidation areaBYBIT:XRPUSDT is building strength within a wide consolidation range after multiple triangle breakouts. Price is eyeing the 2.60 level, and structure suggests bulls are preparing for the next push.

Recently Circle launched native USDC & CCTP on $SEIThis enables fast, low-cost stablecoin transfers on the efficient L1 blockchain, boosting liquidity and institutional adoption
This news made me curious about the chart
The price itself is reclaiming and holding a critical HTF level while breaking the bearish structure
The RSI above the 50 level is signaling a regaining of the bullish momentum
Perfect alignment to grab some for the longterm portfolio

$ETH clear for an impulsive move to $3600?CRYPTOCAP:ETH has slowly but surely cleared resistance, with just the swing high to tackle which will activate another trade signal in my Trade Signals Substack.
Major support High Volume Node, daily pivot and daily 200 EMA proved tough support and demand continues to come in.
ETFs had an astonishing amount of inflows yesterday at $200M+
Analysis is invalidated below $2100
Safe trading

$HBAR Resistance at daily 200EMA!CRYPTOCAP:HBAR analysis continues to play out but should consolidate for a while before moving to the next target at $0.22.
This area should be tough resistance as its the daily 200EMA and major High Volume Node resistance and R1 daily pivot.
The CRYPTOCAP:HBAR signal has now hit take profit #1 from my Trade Signals Substack posted last week.
Safe trading

$SUI Big Breakout Happening?CRYPTOCAP:SUI is smashing above triple resistance: a major High Volume Node , daily 200EMA and the daily pivot. The signal I posted in my trading signals Substack is now live, and the HBAR one is about to hit take profit 1.
Target for this rally remains $4.2 High Volume Node near the swing high.
Analysis is invalidated below the daily pivot at $2.8
Safe trading

$XRP Bias Change: Bullish Elliot Wave CountCRYPTOCAP:XRP is breaking out the descending resistance causing me to take another look at my WXYXZ corrective Eliot Wave count expecting lower. I have adjusted the count to WXY and a 1-2 new motif wave with a target of $3.8
Price is well above the daily 200EMA and daily pivot after testing both as support including the High Volume Node. Closing above the descending resistance today will be a bullish signal but a retest of that resistance as support before continuing onwards its what to look out for.
Analysis is invalidated below $1.8
Safe Trading

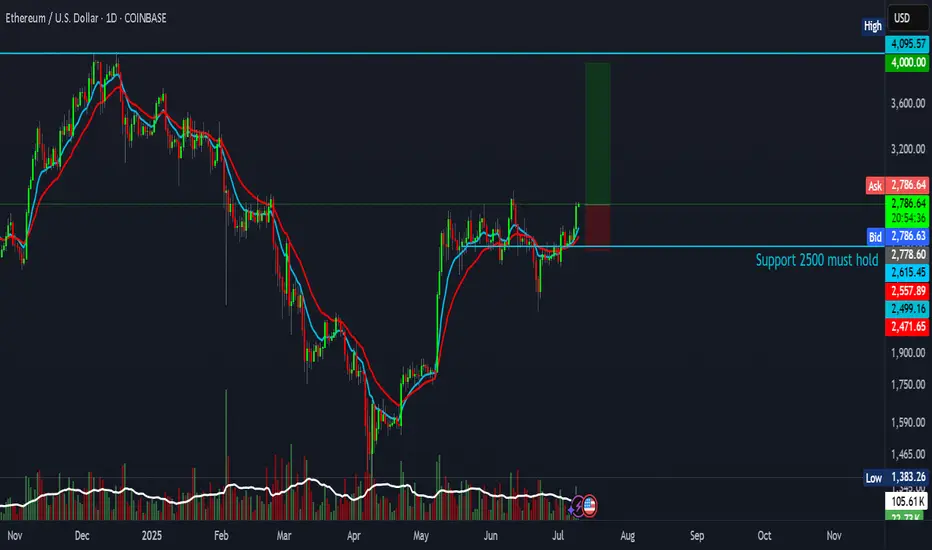
Ethereum trade setup with a 4:1 risk-reward ratioAnother attempt — and this one could be the real breakout.
This setup offers a 4:1 risk-reward ratio, targeting $4,000.
Entry: $2,780
Stop Loss: $2,471
Target: $4,000
Not financial advice.
Altseason, just a thought ! Basically, right now we’re chilling in a major confluence zone — a whole bunch of important levels are stacked right here.
We’ve got:
The 0.78 Fib retracement holding it down
Volume profile support giving us a comfy cushion
That good old accumulation support from 2019–2021 saying “welcome back”
…just to name a few.
IMO, we’re in that sneaky “deviation/manipulation” phase before the real markup begins — a.k.a. altseason is warming up in the locker room.
If we actually hit the bull flag target… well, let’s just say the numbers start looking spicy. But hey, let’s not get ahead of ourselves — things can (and probably will) move faster than you think.
Alright, that’s the vibe. Let’s see how it plays out. Good night! 😴🚀

ETH Gearing Up for Lift-Off — Eyes on $4,000+ETH Weekly Outlook
ETH is currently trading around $2,660 on the weekly timeframe and holding up well at these levels.
If the momentum continues, the upper resistance zone near $3,550 could act like a magnet — pulling price higher. A breakout above this zone may trigger a strong rally toward $4,000+.
And when ETH starts to move big… altcoins usually follow.
Keep an eye on it. The next few weeks could get interesting.
DYOR, NFA

DYDX Breakout from Falling Wedge | Targeting $1.60+# DYDX Breakout from Falling Wedge | Targeting $1.60+
📈 **DYDX/USDT Analysis – Daily Timeframe**
DYDX has just broken out of a falling wedge pattern – a classic bullish reversal formation – after holding a strong support zone around **$0.50**. This zone has acted as a reliable demand area for several months.
---
🔍 **Technical Highlights:**
- ✅ Falling wedge breakout confirmed with daily candle close above resistance
- 🟢 Strong support at $0.50–$0.52
- ⚠️ Horizontal resistance at $0.75 may act as a short-term barrier
- 🚀 Potential rally toward major resistance at **$1.60–$1.70** (target zone)
---
🎯 **Profit Targets:**
- First Target: **$0.75**
- Final Target: **$1.60 – $1.70**
❌ **Invalidation (Stop-loss idea):**
- If price breaks below $0.48 with volume, the bullish scenario may be invalidated.
---
📊 This setup is based on breakout structure and potential trend reversal. If volume confirms, this could be the beginning of a new mid-term uptrend.
💬 Let me know what you think about this setup! Would love to hear your feedback.

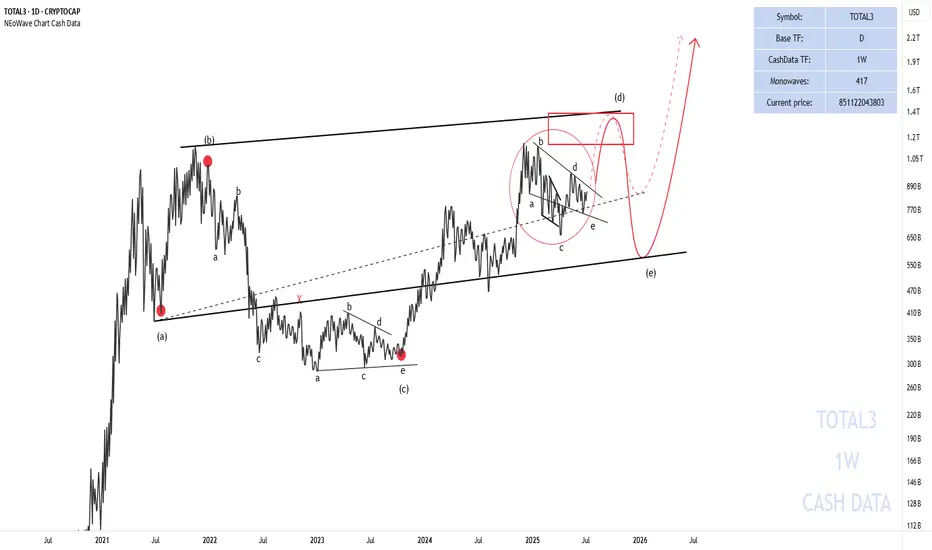
Has the Alt Season Started?Total 3 seems to be forming a neutral triangle (marked with a red circle) and will soon move towards the red box to complete wave-(d) of the higher degree triangle.
The price path is marked for you on the chart.
Good luck
NEoWave Chart
$CROUSDT Just Broke Out, Is a 130% Pump Coming?GETTEX:CRO has broken out above a long-term descending trendline and reclaimed the 100-day moving average, a bullish signal.
If it holds above this zone, the next targets are $0.1079, $0.1498, and potentially $0.2155, offering up to 132% upside.
Watch for a successful retest to confirm momentum.
DYOR, NFA

$SUI Gearing Up to Break Triple Resistance?CRYPTOCAP:SUI is consolidating under resistance which often leads to a breakthrough but can take some time.
Price is sat above the daily pivot after breaking the downward trend resistance, but still under the daily 200 EMA and High Volume Node resistance. A pop above $3.09 swing high would be a bullish signal to long towards a first target of $4.2 High Volume Node.
Analysis is invalidated with a move below $2.7, leaving heavy resistance still ahead.
Safe trading

$AAVE Ready to Pop?EURONEXT:AAVE long signal is now active.
Price is still well above the daily pivot and daily 200EMA showing a strong local trend.
I am still expecting a decent move to test the all time high, High Volume Node at $460.
Safe trading

HolderStat┆SOLUSD seeks to the resistance lineBINANCE:SOLUSDT has broken out of a descending wedge and is coiling in a symmetrical triangle above 150. The setup supports a push toward 165–170, with momentum favoring bulls if the triangle resolves upward.

#OTHERS.D ~ Do you believe in Castles in the SKY?I believe that the Others dominance metric divided by an ounce of real money #Gold gives us a valuable insight into the fabled altseasons.
Because as this chart shows theres only been 4 in actuality
and you normal get a double bubble in a cycle.
So I believe we are at the cusp of turning things around as most people have given up on the concept of altcoins ever pumping again.
But it was just the business cycle #PMI that has depressed prices for the past few years.

BTC setup with a 3.9 risk-to-reward ratio.Is BTC beginning a bullish move toward 120K?
This setup offers a 3.9 R:R with an
Entry at 109,000
Stop loss at 106,355
Target 120,000
Not financial advice.

Ethereum setup with a 14 R:R.Let’s see if this time marks the beginning of bullish momentum.
This setup offers a 14:1 risk-to-reward ratio
Entry at 2560
Stop loss 2457
Target at 4000.

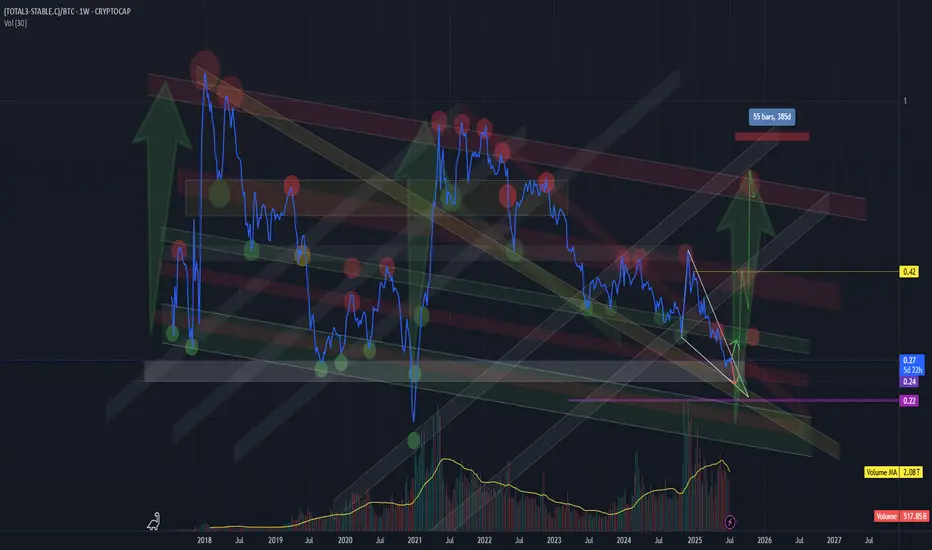
True altcoin-to-BTC strength indicator(CRYPTOCAP:TOTAL3-CRYPTOCAP:STABLE.C)/CRYPTOCAP:BTC
This formula strips out the noise and gives a true altcoin-to-BTC strength indicator.
STABLE.C removes all major stable coins (USDT, USDC, DAI, etc.).
The chart clearly shows previous capitulation zones and launch points for altseasons since 2017
Current formation – potential triangle:
Market makers appear to be coiling price action, forming a triangle-like structure.
This often precedes a volatile breakout — likely to the upside if history repeats.
Market psychology:
Many traders are already heavily positioned in altcoins, which suggests we could be nearing final capitulation.
Historically, altseasons never began with euphoria — but rather fear, exhaustion, and apathy.
BTC halving occurred in April 2024, and typically, the peak of the altseason follows 12 to 16 months later.
The seasonal strength of Q4, often fuels altcoin rallies.
!!! A final washout into a key support zone (on this ratio) could mark the trigger for the next major altseason — possibly starting around August 2025 !!!!!!!!
USDT Dominance Locked in Range – Altseason Not Ready Yet?USDT Dominance has been trading inside a wide sideways range for the last 567 days — bouncing between the 3.6% demand zone and the 6% supply zone.
The recent price action shows a rejection from the top of the range and now heading toward the mid or lower part of the channel. A minor trendline (in red) had shown some short-term support, but it looks weak now.
As long as this range holds, true altseason may remain on pause. The big move will come only when USDT.D breaks out or breaks down from this range.
