BNB Stuck in Barrier Triangle?CRYPTOCAP:BNB appears to be in a macro wave 4 barrier triangle, and for some time.
It has held up particularly well during the alt coin massacre, not even reaching the .382 Fibonacci retracement.
Price is testing the upper boundary for the 4th time, that starts to give us the higher probability breakout which increases with each test. The daily 200EMA and pivot were tested as support successfully.
Safe trading.
Altseason

$FET Ready for the next move up?NYSE:FET looks ready for the next move up with a similar analysis to many other alts I have shared.
It is breaking out of descending resistance after testing the .618 Fibonacci retracement and High Volume Node (HVN) as support. Price broke above the daily pivot and is now swinging below, a recovery above the local swing high will be a bullish signal to go long with a wave 3 target of the R3 daily pivot and major resistance HVN at $1.13.
Analysis is invalidated below $0.54
Safe trading

$HBAR Ready for a move up?CRYPTOCAP:HBAR appears to have completed its wave 2 WXYXZ complex correction
It has broken its descending resistance & daily pivot, retested both as support and is approaching the local swing high which would be a bullish long signal.
Cautious traders may want to take partial take profit at the first resistance High Volume Node and R1 pivot $.18 and a secondary target with good RR is the swing high resistance node at $0.22.
Analysis is invalidated below $.14 swing low.
Safe trading

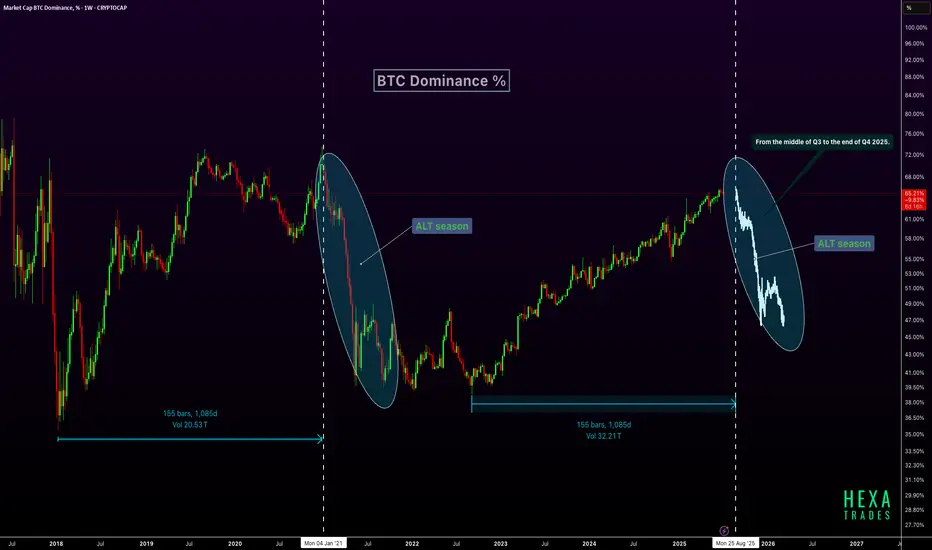
Altseason Ahead? BTC Dominance Cycle RepeatsBTC dominance is forming a pattern similar to the 2021 cycle, where dominance peaked after a long uptrend and then sharply declined, triggering a major altseason. Interestingly, that drop occurred after a 1,085-day rise, a time span we are once again approaching in 2025, projected to end around late August. If history repeats, BTC dominance could start declining from mid-Q3 2025, leading into a strong altcoin rally that may last through the end of Q4. This setup aligns with typical post-halving behavior, suggesting the final phase of the cycle could heavily favor altcoins.
CRYPTOCAP:BTC CRYPTOCAP:ETH CRYPTOCAP:XRP
$ETH Breakout this week?CRYPTOCAP:ETH local chart looks ready
I think were looking at a decent ETH breakout this week to the next resistance High Volume Node at $3600 minimum target.
👉 BTC is consolidating under all time high resistance after multiple tests which is usual a sign of bullish continuation. Usualy giving alts room to room.
👉 Ethereum is above the daily 200EMA, daily pivot and also consolidating under resistance once more after testing the 0.382 Fibonacci retracement and S1 daily pivot adding confluence to that being the local bottom. This appears to be Elliot wave 2, a shallow wave 2 retracement (less than 0.5) is a show of strength and investor impatience.
Analysis invalidated below the daily pivot and daily 200EMA as this will lock in 3 waves up and look corrective.
Safe trading

$NEAR Disappointing so far...CBOE:NEAR is disappointing me as it continues towards the lows
Testing the .786 alt-coin golden pocket High Volume Node so should see a decent reaction from here as it appears a an ABC correction is complete after an Elliot wave motif wave.
Safe trading

JUP Main trend. Channel. Wedge. Double bottom. 06 07 2025Logarithm. Time frame 3 days. Decline from the maximum -84% (this is not enough), but given the capitalization of 59th place, if the market is positive in the near future, then it is quite possible to reverse this cryptocurrency through a double bottom.
All long-term consolidation above with high volatility is the distribution of ladies and gentlemen. Also study the vesting of this cryptocurrency. There are less than half of the tokens on the market, and there are also pauses for 1 year, which is good.
Jupiter (JUP) is a key player in the decentralized finance (DeFi) space, especially in the Solana blockchain.
Main trend is downward. Descending channel.
Secondary trend is downward. Descending wedge.
Local trend is sideways. Potential double bottom in case of a breakout.
The price will move in the corridors of this descending channel from the dynamic lines of its support/resistance. Remember this and use it in your trading strategy, observing money management.
Local breakout zone
Understand where the zones are cheap, and where, on the contrary, the zones are expensive. If you work (tear out movements, there should be short-term or conditionally medium-term transactions, with very mundane goals) conditionally in expensive zones, then limit losses. Do not let yourself be fooled by news noise and the opinions of the majority.

Banana zone starts when PMI is above 53.Check your charts to verify this fact.
Total 2 with the US Purchasing Managers Index overlain.
The PMI is one of the most reliable leading indicators for assessing the state of the U.S. economy.
Previous Banana zones have coincided with the PMI above 53.
so not just when the economy is growing, but when the economy has entered humming along approaching full acceleration.
This is when most people will feel confidence and WANT to take on more risk as they are most optimistic about the future when the economy is in this state of being.

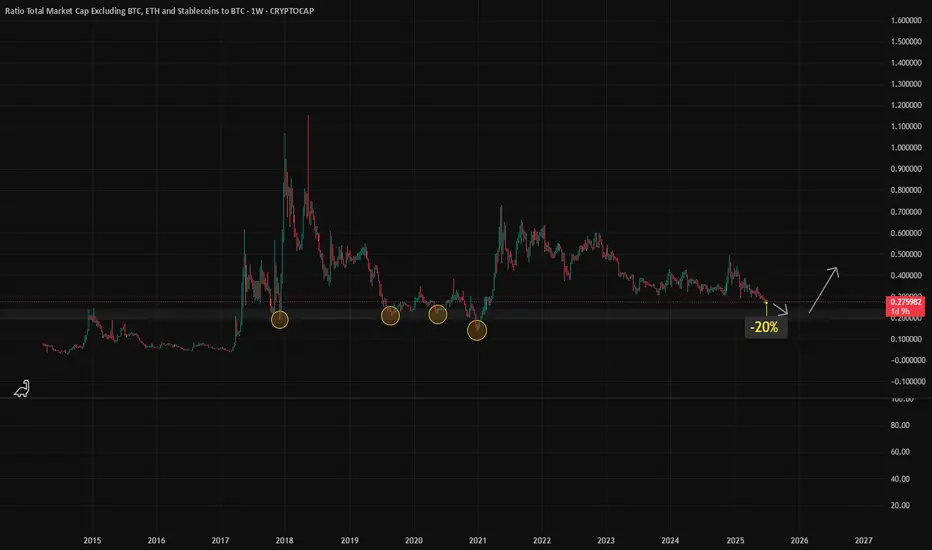
Altcoins Near Key Support, Possible -20% Drop before reversal ?Sharing my analysis on the altcoin market cap (excluding BTC, ETH, and stablecoins) compared to BTC over the past 10 years
I have marked important zones (yellow circles) where altcoins have historically bounced after strong corrections.
Current Outlook:
- I expect a possible -20% more downside, bringing it near 0.22, which aligns with a key historical support zone.
- This level has acted as a strong base multiple times, in 2018, 2020 and 2021
What I’m Watching:
- If price reaches that zone and holds, it could signal the start of the next altseason.
- Past patterns show similar moves before big reversals.
- However confirmation through volume and market sentiment is important before making any move
Final Note:
Not financial advice, just sharing what I see on the chart. If the ratio hits 0.22 and shows strength, it could be a key level to watch. Thanks
Bitcoin Dominance Nearing a Top — Altseason Incoming in JULYBitcoin Dominance (BTC.D) is approaching overbought levels on several key oscillators across multiple timeframes. While the 1-Week chart still shows momentum that could push BTC.D slightly higher over the next few weeks, the indicators are signaling an upcoming shift.
📅 Timing the Rotation:
We're eyeing mid to late July as the likely window for a rotation into altcoins. This would mark the beginning of a potential mini altseason, where top-performing altcoins could outpace Bitcoin for a limited but lucrative period.
💼 Strategy Insight:
This could present a strong opportunity to trim or exit older alt positions from earlier in 2024—especially if they rally hard during this period of temporary dominance weakness.
🔍 Watch the oscillators and volume trends closely. The BTC.D reversal could be subtle at first but may lead to outsized moves in select alts.

BONK Bullish Reversal in PlayAfter a clean 5-wave advance from the April low, CRYPTO:BONKUSD corrected 55%, then carved out a higher low last month. Now it’s eyeing a breakout above the May peak as the next leg higher begins.

PARTI Setup: Key Reversal Zone Could Spark +50% RallyToday, I want to analyze the Particle Network ( BINANCE:PARTIUSDT ) project for you, which has a chance of increasing by +20% to +50% in the short term .
Let's first take a look at the fundamental state of the Particle Network (PARTI) project .
Particle Network is building a modular Layer-1 blockchain with a focus on Chain Abstraction, aiming to unify user experiences across multiple chains through:
Universal Accounts – Single account across all chains
Universal Liquidity – Access liquidity without bridging
Universal Gas – Seamless cross-chain transactions without gas token concerns
The project has:
Raised $25M+ funding from top-tier investors (Binance Labs, Animoca Brands, Spartan Group)
Integrated with 60+ blockchains and 900+ dApps
Reached over 1.3M testnet accounts and 27,100 daily transactions (Messari Q1 2025 report)
Recently launched UniversalX (a cross-chain DEX) as its flagship dApp
Summary:
Particle Network shows strong fundamentals with innovative tech, a growing ecosystem, and backing from major players in crypto. Long-term success will depend on user adoption of Universal Accounts and dApps like UniversalX.
------------------------------------------------------
Now let's take a look at the PARTI token chart on the daily time frame .
PARTI token is currently trading near Potential Reversal Zone(PRZ) , Monthly Support(2) . There is also a possibility of a Range channel forming, we should wait for the confirmation of the second bottom .
I expect the PARTI token to start rising again from the Potential Reversal Zone(PRZ) and near $0.14 .
Note: Stop Loss(SL)= $0.1177
Please respect each other's ideas and express them politely if you agree or disagree.
Particle Network Analyze (PARTIUSDT), Daily time frame.
Be sure to follow the updated ideas.
Do not forget to put a Stop loss for your positions (For every position you want to open).
Please follow your strategy and updates; this is just my Idea, and I will gladly see your ideas in this post.
Please do not forget the ✅' like '✅ button 🙏😊 & Share it with your friends; thanks, and Trade safe.

HolderStat┆ETHUSD correctedKUCOIN:ETHUSDT is moving inside a rising wedge after reclaiming support near $2,500. Recent breakout from consolidation supports a continuation push toward $2,720–$2,760. The current trendline structure and bullish price action suggest upside potential.

HolderStat┆XRPUSD forms an ascending structureBINANCE:XRPUSDT is forming a stair-step bullish pattern after breaking out of consolidation above 2.12. The current trajectory suggests continued movement toward 2.70, with multiple support bounces validating the structure. Price action remains favorable for bulls.

HolderStat┆BNBUSD consolidated above the $650 levelKUCOIN:BNBUSDT is holding firm above 650 after breaking through a symmetrical triangle. The price structure is supporting a bullish continuation toward the upper resistance zone at 690–700. A clear uptrend is forming with tight consolidation along support, hinting at a breakout move.

MACRO 3-Drive Pattern on Bitcoin | Major Reversal Ahead?Is Bitcoin completing a massive 3-drive structure on the macro chart?
Three clear pushes higher, each with fading momentum, are flashing a major reversal signal.
This could be the final phase before a long-term shift — are you ready for what’s next?
📚 3-Drive Structure Trading Strategy — Full Breakdown
The 3-Drive Pattern is a powerful reversal-based price structure used to spot major turning points in trending markets. It works by identifying three consecutive drives (or pushes) in one direction, typically ending with exhaustion and a high-probability reversal.
Each drive forms a new high or low, but with weakening momentum — especially visible using RSI, MACD, or volume divergence.
🔍 What is the 3-Drive Pattern?
3 consecutive higher highs (or lower lows)
Each drive followed by a shallow pullback
Momentum weakens on each push (divergence forms)
Fibonacci symmetry often present:
- Drive extensions: 127.2%–161.8%
- Pullbacks: usually 61.8%
📉 Bearish 3-Drive (Reversal from Uptrend):
Drive 1: Price makes a higher high with strong momentum
Drive 2: Another higher high, weaker strength
Drive 3: Final high with clear divergence
Reversal: Entry when price breaks below structure
🎯Entry Criteria:
Wait for all 3 drives to form
Confirm with divergence on Drive 3
Use a confirmation candle or structure break
Stop-loss: just beyond the 3rd drive’s high
🎯 Targets:
Conservative: Return to Drive 2 base
Aggressive: Full trend reversal (50%–100% Fib retracement)
🧠 Pro Tips:
Best on 4H, 1D, 3D or 1w timeframes
Confirm with RSI, MACD, or volume divergence
Combine with key S/R or supply-demand zones
💡 Summary:
The 3-Drive pattern is one of the most reliable reversal structures when combined with divergence and Fibonacci symmetry. It's especially powerful at market exhaustion zones and works best with confirmation-based entries.

Ethereum Trading Strategy: 5:1 Risk-to-Reward Ratio"Ethereum Showing Strength on the 4-Hour Chart — A New Bullish Trend Emerging?"
The 4-hour timeframe is starting to show strong bullish momentum. Could this be the beginning of a new uptrend?
A potential 5:1 risk-to-reward setup is forming:
Entry: 2,620
Stop Loss: 2,364
Target: 4,062
Support 2500 must hold!!!

PENGU. Main trend. Trend reversal zone. 04 07 2025Logarithm. Main trend. Fresh cryptocurrency, which is being driven into hype.
Locally now. Price at the median of the bowl.
Buyer volume dominates. Most likely, there will be a large pump in case of a breakout.
The chart is somewhat reminiscent of the Bitcoin chart, the reversal zones of this secondary trend, after the first local wave of growth. The first local, significant target is shown.
There is a possibility of a helicopter, that is, to collect stops in both directions, and thereby dump passengers before a potential pump.
Such cryptocurrencies (low liquidity, monopoly over the price due to the concentration of cryptocurrency in “one hand”) at a good time "the hamster is not scared", will be pumped up conditionally, like Shiba Inu (SHIB), driving the hype (raising the price over and over again, and coming up with positive news) and 0.5 million Twitter subscribers (X). Medium-term — long-term level zones are shown on the chart.

BTC Dominance – History Repeating? Altseason 2025 Loading? Hey Traders!
If you’re finding value in this analysis, smash that 👍 and hit Follow for high-accuracy trade setups that actually deliver!
This chart is SCREAMING for attention 👀
We’re at a critical inflection point on the weekly BTC Dominance chart — and if history has taught us anything, it’s that altseasons are born when dominance collapses from resistance.
🧠 Key Observations:
🔺 Macro Resistance Trendline:
Rejected in 2017 → Altseason 🔥
Rejected in 2021 → Altseason 🔥
Now (2025?) — BTC.D is again touching this same red trendline...
🟢 Support Trendline:
BTC.D formed a clean long-term support from which previous dominance drops have bounced — currently lining up around 42–45%.
📉 Previous drops after rejection:
2017: –50.79%
2021: –45.10%
2025 projection? –36.91% (which would bring us to the same support zone again)
🟡 What It Means:
If BTC.D gets rejected from this resistance again, it could mark the start of the long-awaited Altseason 2025. A breakdown from this wedge would likely result in capital rotation from BTC into altcoins — just like in previous cycles.
🔍 What to Watch:
A confirmed rejection from this red resistance line
Drop below the yellow wedge support
BTC sideways / ETHBTC strength = green light for ALTS
💥 This could be the altcoin opportunity of the next couple of years.
Conclusion:
All eyes on BTC Dominance — because when it falls, altcoins usually FLY.
📊 Stay updated, stay ready.

HolderStat┆BTCUSD ready to break through the resistanceBINANCE:BTCUSDT has completed another consolidation breakout and is coiling near key resistance. The price action points toward a move to 114,000 if the 102,000 level holds and volume confirms the continuation trend.

HolderStat┆HYPEUSD above the $40 resistanceKUCOIN:HYPEUSDT has reclaimed $40 resistance and is now trending in a rising channel. Past triangle breakouts signal that $43–$45 could be next if the current momentum continues to build.

HolderStat┆AVAXUSD seeks to retest $17BINANCE:AVAXUSDT is pushing upward after a breakout from the falling channel structure, reclaiming the $17 support area. The short-term projection points toward $19, with upside potential toward $22 if the channel resistance breaks. Momentum is building from the breakout zone.

$AAVE Going Through a Major Bullish Trend Shift!CRYPTOCAP:AAVE continues to outperform on pumps and retracements this cycle after being beaten down for many years!
Price consolidated below the weekly pivot and found support, only retracing to the .618 Fibs.
Wave 3 of iii pf a new Elliot Motif Wave looks well underway with the next price target being the R1 weekly pivot High Volume Node at $448.
Long term outlooks is very bullish for AAVE with a terminal target of the R5 weekly pivot £1155
Safe trading
