HolderStat┆SOLUSD above the supportBINANCE:SOLUSDT reclaimed the $140 level after a wedge breakout and is now forming a stair-step recovery structure. The price is targeting the mid $150s with higher lows supporting the bullish thesis. Previous consolidations and wedge formations suggest buyers are regaining control. Continued strength above $140 reinforces the move.
Altseason

HolderStat┆BNBUSD retest of the channelBINANCE:BNBUSDT has completed a bullish reversal from the 633.4 level and is now testing upper trend resistance. A breakout from this wedge structure may lead to a rapid move toward the 680–700 region. Past triangle patterns have preceded strong rallies, and momentum indicators favor bulls. Traders will look for a breakout above 650 to confirm.

HolderStat┆ADAUSD retest of the supportBINANCE:ADAUSDT has bounced from the 0.55 support level, completing a falling wedge structure. The price now attempts to recover, with a visible bullish wave formation targeting the 0.62 resistance trendline. Multiple past consolidations have preceded breakouts, and if this pattern holds, a strong upside push is possible. Watch for confirmation of continued higher lows.

AEVO Main Trend DEX L2 Listing 212 X !) Decrease -98% 06 25Logarithm. Term 3 days.
Asset super hype in the past, listing with overly positive and aggressive marketing at 212X!
1️⃣Q1 2023 Private Seed $0.0185 / $1.85 million
2️⃣10 05 2023 Private Series A $0.13 / $6.01 million
3️⃣Q4 2023 Private Series A+ $0.25 / $8.75 million
4️⃣13 03 2024 Listing on the Binance exchange on the day of the secondary market trend reversal (I missed it, and it happens).
26 06 2025 now -98% decline after listing, which is 4.2X from the last prices of scammers, who gradually distributed, maintaining liquidity and the news background all this time their huge profit. Most of the coins are redistributed. You can think about collecting in this sideways, on a breakout of a local wedge (local trend), or on a breakout of a descending channel (reversal of the main trend).
Those who are far from trading can buy in equal parts (3 parts). From the position of the main trend and potential, the prices are now acceptable (you can buy the first part), so to speak (former "hype investors" are in wild horror).
Exit zones will be zones of previous consolidation, that is, those who previously bought on the hype will not be able to make a profit. In fact, it is always like this ... There are no “passengers”, then they will pump up well. As a rule, +800-1000% such assets of the previous excitement and such liquidity.
Local reversal zone.

BTC Dominance Nearing Major Reversal Zone?Dominance has been grinding higher for months, but it's now walking into heavy resistance, and the structure looks like a rising wedge (not a great sign for bulls).
This setup often ends with a breakdown, which could be the spark altcoins are waiting for.
It’s not confirmed yet, but the chart’s starting to hint at a shift.
Watch closely, big moves usually follow tight squeezes.

15 R:R setup for EthereumWe assume that this marks the beginning of a new uptrend for BTC. This setup offers an easy 15:1 risk-to-reward ratio.
Entry: 2534
Stop Loss: 2373.33
Target: 5000
This is for educational purposes only.

TOTAL2, TOTAL MARKET CUP without BTCTOTAL2, TOTAL MARKET CUP without BTC
Reasonable targets are within the yellow zone — these are high-probability levels based on current price action, volume, and market structure. They offer the best risk/reward and are ideal for primary take-profit planning.
Targets outside the yellow zone are still possible but come with higher risk. They typically require extended time, increased volatility, or external catalysts. These should be treated as secondary or speculative targets, best approached with reduced size or active trade management.
Summary:
Yellow zone = high probability, balanced risk/reward.
Beyond yellow = lower probability, higher risk, use with caution.

USDT - Hope AheadMorning my friends,
Figured I'd share a little bit of this USDT chart.
Deff showing a downtrend, even though our beloved coins are still suffering. Thats mainly because of BTC.D.
Once USDT moves lower, signaling a breakdown we should get a big relief, that if maybe paired with BTC.D moving lower as it is also near very strong resistance a bull market for alts will begin.
Keep an eye on this descending triangle breakdown.
Trade thirsty, my friends!

Altseason isn’t cancelled, it’s just delayed. Here's WHY!CRYPTOCAP:BTC Dominance Update:
Altseason isn’t cancelled, it’s just delayed.
The key zone to watch is 69.5%–73% dominance. That’s where we’re likely to see a strong rejection if it doesn't start soon, which seems unlikely given the current circumstances.
The longer it takes to reach that level, the stronger the altcoin rally will be once it hits.
This isn’t hope, it’s exactly what the charts are showing.
Historically, 70% dominance has acted as a major reversal zone.
If there are signs of reversal before this level, I'll let you know beforehand.
So follow me if you don't and share this chart with your crypto friends.
Do not forget to keep cash/stables!
Let me know what you think in the comments.
Thank you
#PEACE

ADA | BTC | ET | Why ALTSEASON is COMING SOONAfter a -34% retracement, ADA is ready to go higher alongside with the rest of the alt market.
We see a very interesting phenomena here, were ADA also represents a large part of the larger alts: BTC pulls back, ETH is starting to increase or trades sideways (before the increase) whilst the alts dip.
This is actually BULLISH for alts, showing the very clear rotation between BTC, ETH and top 15 alts.
If we look at the macro of ANY of the alts I've been working through recently, a similar pattern appears - a clear bottom, followed by a sideways trade. This is usually the point just before the big ALTS season.
We actually see this pattern at the end of the 2018 rally, as well as after the 202- Covid dip:
The bottom line -
ADA and other alts are gearing up for their ALTSEASON. With patience, we will soon see some great gains across the markets.

Altcoin Season - Just around the corner!!!In this analysis I share my hypothesis on #OTHERS CRYPTOCAP:OTHERS as to why the big awaited alt season is right around the corner !
After analysing how the Trump mania season unfolded, I could see plenty of similarities:
1. Price filled the supply before the last retrace - gray rectangle
2. Then it broke the downtrend line and made a decent move up - red dot
3. Price correction to the 618 retrace on fib AND in the supply -> became demand from #1
4. RSI formed a hidden bullish divergence, marking a potential start of the rally
5. Time passed from #2 trendline breakout to the big impulse -> around 50 days
-> now we are around 60 days, which means more time to accumulate, bigger impulse
In an ideal scenario, the total OTHERS cap (all crypto excluding top 10) should at least reach the last high of 450 billions, and to pour some hopium, to around 600-700 billions...
So if you filled your bags around recent prices on your alts, you should expect at least 10-20x imo!

BNB Double Correction Hits Extreme ZoneBINANCE:BNBUSD has now entered the Blue Box buying area, signaling the final phase of the correction. A weekly reversal confirmation is the next key step — once that’s in place, the bounce phase is expected to begin.

$SUI follow up for June 2025CRYPTOCAP:SUI has tapped my support zone around $2.85, which is currently holding well.
That said, the broader trend remains corrective, and it's likely only a matter of time before this support gives way.
If that happens, we could see a drop into my green buy zone — sitting just below a major order block. A break there might trigger heavy liquidations and a sharp move to the next support level.
I don't expect a deeper crash, as bulls are showing strong activity to defend this area.
If you set buy orders around this zone, a solid bounce could offer attractive profits.
As always, DYOR.
This is a follow up for this idea from May 2025

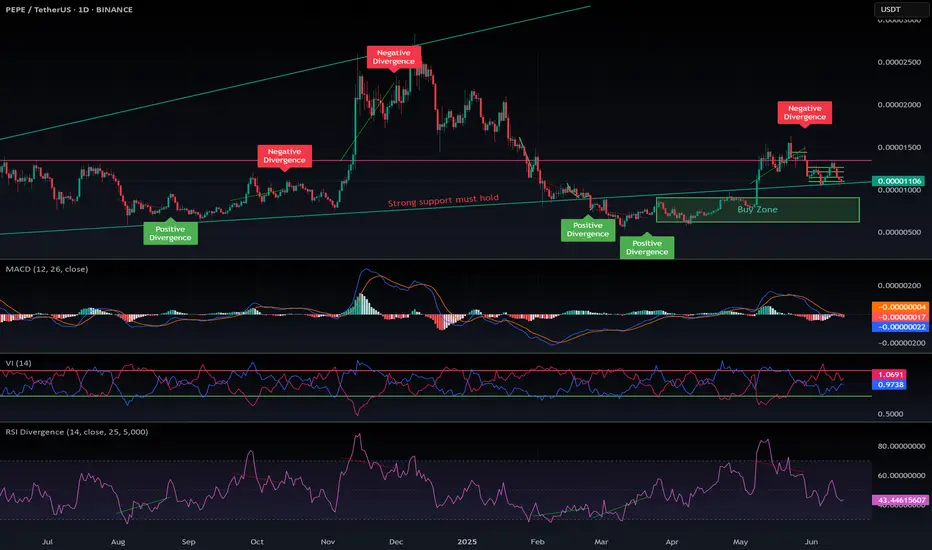
$PEPE follow up for June 2025Follow-up on my previous CRYPTOCAP:PEPE analysis — it played out exactly as expected.
CRYPTOCAP:PEPE remains my top meme coin, backed by some of the strongest tokenomics in the space. When altseason hits — if it hits — this one is primed to pump hard.
Like most altcoins right now, CRYPTOCAP:PEPE is in a short-term corrective pattern. That opens up another great opportunity to enter low and potentially ride a 2x or 3x move on the next leg up.
I’ve marked my usual buy zone. It may seem optimistic for now, but history shows how fast meme coins can dump… and then recover just as quickly. A drop into that green zone is entirely possible.
📲 Follow me for alerts — I’m monitoring CRYPTOCAP:PEPE daily. It’s one of my top picks.
DYOR.
Here was the previous analysis:
#PEPE #MemeCoin #Altseason #CryptoGems #BuyTheDip #Altcoins #CryptoTrading #Tokenomics #DYOR #CryptoAlerts
ETHEREUM for $750?In this chart, I am showing you the worst possible scenario. If we compare this cycle to the past, we see some very similar things on the weekly chart:
- Weekly RSI divergence
- Testing the 50-level RSI and the trend line from the bottom to the top
- Correction to the 0.5 fibbonacci level.
- Last time we had a war between Ukraine and Russia and now we have a war between Israel and Iran
- Last time everyone on X(twitter) was talking and cheering about Alt-Seoson and ToTheMoon and now we have the same situation, DYOR, check X
$750-800 for Ethereum are the lows of the two global channels. So it's a logical bottom. And after the price reaches the bottom, we can reach the top of the channel.
Hence after this mega-dump we will see #ETH at $18000-20000.
What do you think about this scenario?

Solana Next Buying Zone on WatchCRYPTO:SOLUSD is correcting the 5 waves advance from April low within a 3 waves ZigZag structure and as price slipped to a new marginal low beneath last week’s support, signaling potential weakness toward equal legs area$122 - $111 before buyers look to step in again.
Keeping an eye on reactions in this zone—could set up for a bullish reversal once demand kicks in!

FARTCOIN Loading The BeansCRYPTO:FARTCOINUSD after the initial bounce failed, the correction against the March low is still unfolding within a 3-swing Zigzag, targeting the equal legs zone at $0.75–$0.57 — where bulls are expected to step in for the next blast higher.
Load the beans!! Time to fart!! 💨

COOKIE Holds Above $0.2—What’s Next?📊 BINANCE:COOKIEUSDT has bounced off the support area at $0.2, signaling the start of a potential upside move that could take it toward $0.5.
🚀 Will momentum carry it higher, or is another test of support coming first?

$BTC Bounce Targeting $112K?CRYPTOCAP:BTC is trading within a descending channel and has just bounced off the lower support level near $101,400.
If this rebound holds, we could see a push toward $107,000–$ 112,000.
However, it remains in a downtrend, so any upside may face resistance unless the channel breaks with strong volume.

BTC is stuck in a tightening triangle — compression phaseVolatility building up into June 18–19.
Expect a big breakout.
Main scenario: breakout to the upside with a “God Candle” and new momentum for altcoins after prolonged BTC dominance.
Alts have been suppressed, but that’s part of the setup — don’t get tricked by the fake moves.
Stay patient, don’t lose focus, and be ready for a sharp move!

Ethereum’s Last Chance: Let Jesus Take The WheelEthereum’s price action over the course of this crypto bull run, and especially since the beginning of this year, 2025, has been nothing short of horrendous. It’s failed to hold almost every single important level that it needed to, to be able to keep pushing higher. This has caused almost all crypto investors and altcoin traders to pull their investments out, and drive the price even lower. At its current point, altcoin traders have lost all but 100% of the confidence they once had in it, and to retail investors, this is basically toxic waste once they see the losses that have been taken, it’s driving them away en masse.
With that being said, this is ETH’s final stand, it’s time to either show out, or go home with nothing to show for itself. It’s at a very critical support level right now, and if it breaks down below this, the trade will be cancelled. It’s just finished completing the ‘Jesus Take The Wheel’ pattern on the weekly & MONTHLY. This is an extremely high probability pattern, and could cause a blow-off top for Ethereum.
We also see that we got a Wykoff Pattern here, with the last one that we got around the $2k level being a fake out. The only other times it has printed aside from the last fake out, it has been the start of a bull run. ETH now has 6 weeks in total, or about 4 more weeks from now to start recovering old levels, and taking off to the moon.
I drew a bar pattern on the chart that I took from its original bullish pattern from the start of the 2013 bull run. I believe we’ll have a shortened cycle, and due to not having much time left to complete the bull run during this 4-year cycle, that’s all we will get. Thankfully, the price has been beaten down so much, that getting in now, will offer 1000% gains, in just about 6 months. This will be one of the most incredible feats in all of crypto.
Fear is at an all time high, and ETH has been teasing everyone with a bull run for months and even years now. We haven’t seen an all time high since 2021. Most investors will suffer from boredom exhaustion as well, and with the stock market also sinking, we could see a huge push once we recover some levels, for the masses to finally come into the market via Ethereum ETF’s, so they don’t have to actually risk any money moving crypto around. The boomers and traditional investors with stock accounts will be free to throw cash at these ETF’s and that’s what will give us our final pumps past all time highs, once the crypto traders all get back into the market, and get us to new ATH’s in the first place, and help us recover key levels.
One thing is clear: ETH needs to stop trying so hard to control its environment, it’s time to just let Jesus Take The Wheel 🚀

ALTCOINS: Market bottomed and about to surge.The Altcoin market is almost oversold on its 1W technical outlook (RSI = 30.160, MACD = -0.160, ADX = 18.210) but this very same 1W RSI pattern has emerged numerous times before an altcoin market surge (Altseason). How high it can go depends on whether the Fed will cut on its next meeting or not. Nevertheless, this level is an excellent opportunity to start investing in altcoins.
## If you like our free content follow our profile to get more daily ideas. ##
## Comments and likes are greatly appreciated. ##

PURE TOTAL 3 ALTCOIN INDICATOR without stable coins, BTC and ETHCRYPTOCAP:TOTAL3-CRYPTOCAP:USDT-CRYPTOCAP:USDC-CRYPTOCAP:DAI
Original idea inspired by trader SpartaBTC — highly recommend checking out his page.
