ETH/BTC - Last Drawdown Before Rally Upwards!After a long downward road, CRYPTOCAP:ETH / CRYPTOCAP:BTC chart seems to be finally ready to move upwards! The first signs of strength were already shown!
(1) The chart bottomed at the 0.019₿ point, made a big pump from there and now consolidating in the tight horizontal range between 0.023₿ - 0.025₿.
(1-2) I expect to see a one final shakeout down to 0.022₿ support to trigger high-leveraged positions on altcoins (possible -5% - 20% pullback, especially on weak altcoins that didn't show any strength during the past week) .
(2-3-4) Then CRYPTOCAP:ETH can safely ride up towards 0.032₿ zone, from where I expect a local ABC correction to start. More likely we will spend the rest of summer in the 0.028₿ - 0.033₿ range.
(4-5) After that, the final wave towards 0.038₿ should happen during Autumn Season (autumn is typically a bullish time for crypto, based on the previous couple of years) .
Position yourself accordingly. This year must provide a lot of opportunities to earn not only on Ethereum, but on Altcoins as well.
Altseason

Altcoins: Warning. Check this chart!On the weekly timeframe, I’ve noticed a striking similarity between the 2021 cycle and the current one.
Take a close look at the chart—once you see it, you can’t unsee it.
Are we at the same point we were in March 2022?
The MACD is nearly identical
The RSI mirrors the same pattern
The Vortex Indicator stands at a critical crossroad
The only difference: trading volume is significantly higher
This setup resembles a potential triple top formation. If it confirms, it could completely contradict the bullish forecast I’ve held for months—or it might just be a fakeout.
We're at a decision point for altcoins: either the altseason kicks off in September and invalidates this bearish pattern, or we're headed toward a dot-com-style crash for most altcoins—excluding the top 10.
Keep a close watch on $OTHERS. History tends to repeat—let’s hope not this time.
DYOR
#Crypto #Altseason #BTC #CryptoAnalysis #MACD #RSI #BitcoinDominance #Altcoins #TradingView #TripleTop #CryptoCrash #Blockchain #CryptoCycle #MarketAnalysis

$INJ to re-enter my buy zone? $11.12 must hold!Altcoins are experiencing another pullback.
CRYPTOCAP:INJ had a solid pump recently, but it’s now facing a significant drop.
This could be a good buying opportunity — assuming we’re not entering a bear market.
Key level: $11.12 must hold.
If it breaks, the next major support is around $9.10.
While the macro trend remains bullish, this retracement is concerning.
Set your stop losses accordingly.
DYOR.
#INJ #Altcoins #CryptoTrading #MarketUpdate #CryptoAlert #BuyTheDip #DYOR

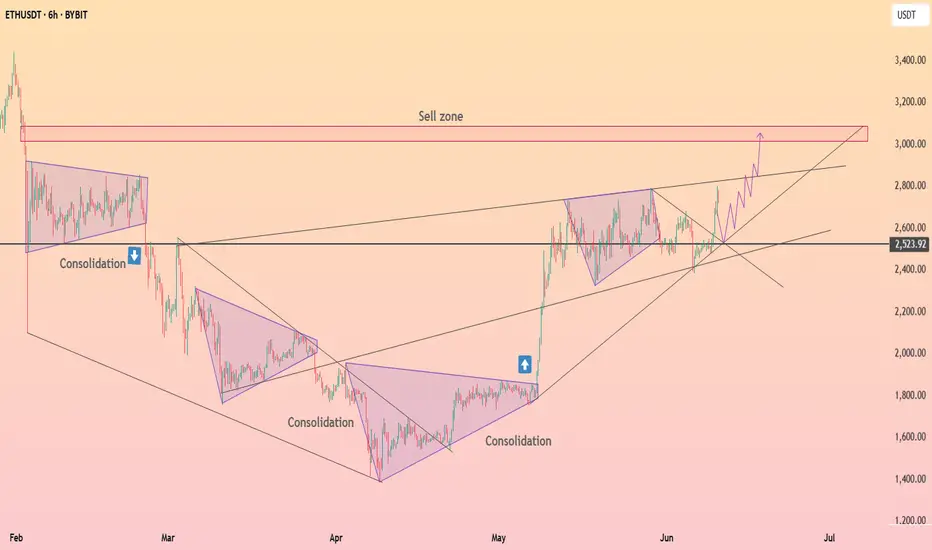
HolderStat┆ETHUSD above the consolidation zoneCRYPTOCAP:ETH
→ Basing above 2 400 while probing triangle apex
↳ Crack 2 550–2 600 for runway to 2 850–3 150
⇢ Trend guard sits at 2 650 → 2 500
⤴ Close < 2 650 drops Ether back into old range
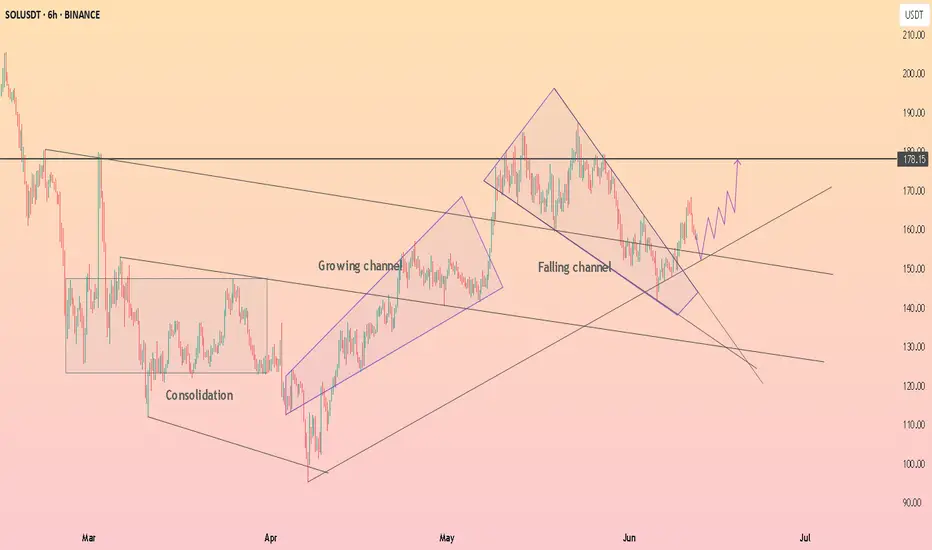
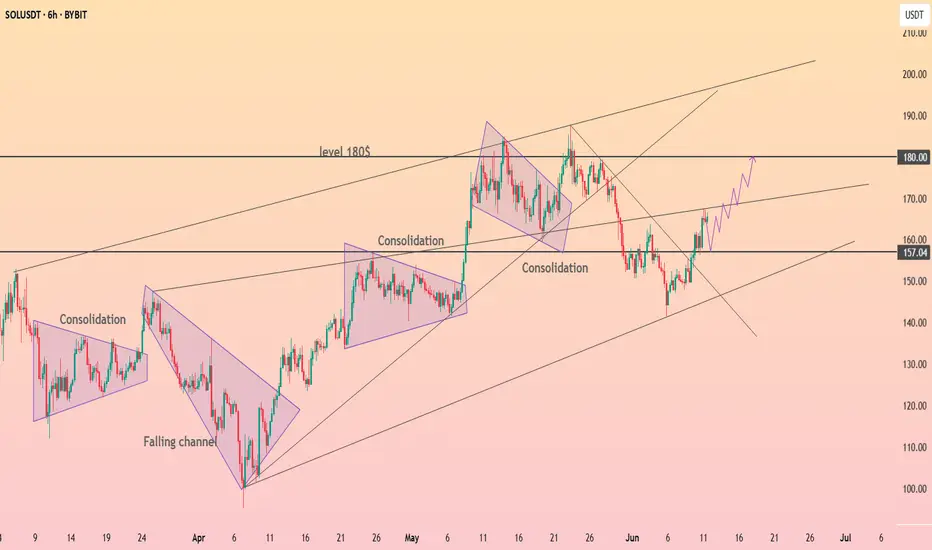
HolderStat┆SOLUSD exit from the formationBINANCE:SOLUSDT
→ Bounce off 150 trend-line fuels channel grind
↳ Reclaim 163–165 then pierce 180 cup-rim
⇢ Targets 190–195 upper rail, even 205+
⤴ Slip < 157 reroutes to 150 demand, < 148 turns bearish
HolderStat┆XRPUSD narrowing of volatilityCRYPTOCAP:XRP
→ Higher-low ladder pushes into falling-wedge roof
↳ Daily close > 2.40–2.45 = breakout to 2.55–2.65
⇢ Rising base holds at 2.10
⤴ Break < 2.10 opens 2.00–1.95 liquidity pit

HolderStat┆BNBUSD broke the local resistanceCRYPTOCAP:BNB
→ Coils above rising support 630–640 under 680 wall
↳ Pop > 680 ignites sprint to 700–720 supply shelf
⇢ Lose 630 downgrades to 600–610 retest
⤴ Sub-600 invites 580 deeper pullback

HolderStat┆ADAUSD above the $0.66 levelCRYPTOCAP:ADA
→ Climbs out of falling channel, presses 0.68 trend-lid
↳ Accept > 0.68 targets 0.72–0.75 → 0.80–0.85
⇢ Must defend 0.60–0.63 breakout shelf
⤴ Fall < 0.60 hands reins to bears aiming 0.58–0.55

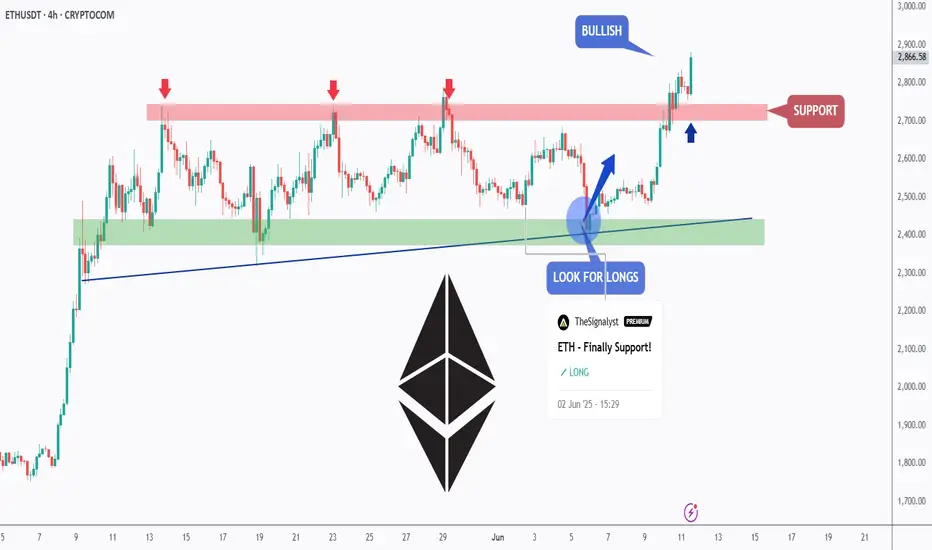
ETH - Medium-Term Bulls Confirmed Control!Hello TradingView Family / Fellow Traders. This is Richard, also known as theSignalyst.
📈 As per our previous ETH analysis (shown on the chart), ETH rejected the green support zone and pushed higher, reaching our target near $2,750.
What’s next?
After breaking above the $2,750 structure marked in red, the bulls have confirmed medium-term control.
🏹 As long as the last major low at $2,700 holds, ETH is expected to remain bullish, with a potential move toward the $3,500 resistance zone.
📚 Always follow your trading plan regarding entry, risk management, and trade management.
Good luck!
All Strategies Are Good; If Managed Properly!
~Rich
ADA | Liquidity Drain or UPSIDE POTENTIAL??ADA is lacking behind in terms of altcoins this season. We've not yet seen the new highs or parabolic increases that is due for a new BTC ATH.
We're seeing higher highs, and higher lows in the macro which is a bullish sign - indicating the trend is still BULLISH
From the macro, we do see a better picture.. at least THIs time around, the accumulation cycle isn't in such a tight range, and you could day trade / swing trade:
_______________
BINANCE:ADAUSDT

The Charts Never Lie [Well, almost never]So many reasons to be Bullish on Alts right now.
Historically, BTC will peak first, and then ALTS will have their turn. It looks like they are prime for a run at least to the middle of the range, although why stop there?

$GRT IS ABOUT TO GO Graph ( JSE:GRT ) is about to go. Zoom in and out and see it for yourself. History will always repeat itself. You can see the short term targets

BTC.D(based one NEowave)the Z wave of this branch shown as a triangle and I think its finished but for confirmation breaking the 61.9 is important.
its a green light of Altseason.

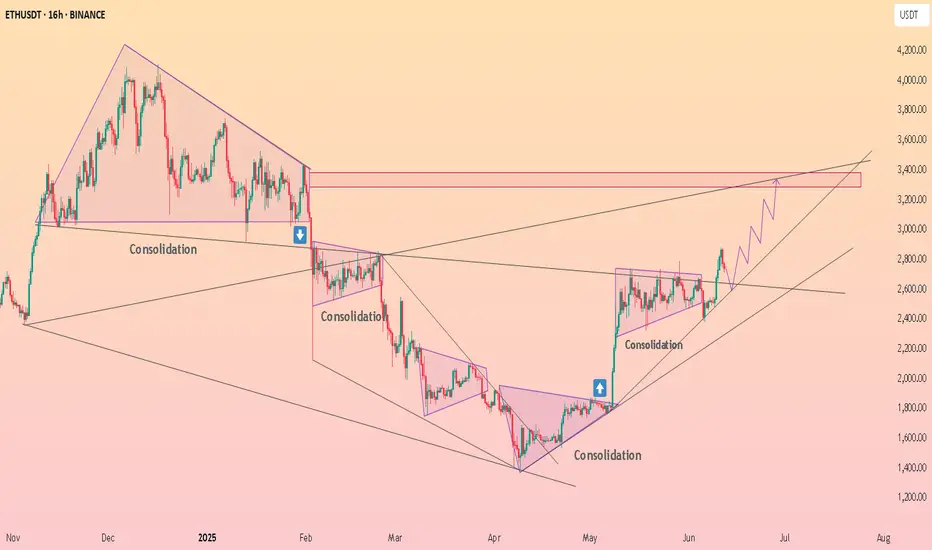
Altcoin MarketCap - Consolidating Before the Ride!On the chart you can see a Pure Capitazation of Altcoins - Crypto Market Cap Excluding Bitcoin, Ethereum and ALL Stablecoins.
There was formed a very clear model that has all chances of repeating once again:
First goes a strong ascending movement from 0 to a bit higher than 0.618 Fibo lvls.
Then there is a correction inside the descending channel/bull flag down to ~0.382 with one long shadow below that sets a 0 point for a new cycle.
Breakout of a bull flag follows after.
Final stage before the growth is consolidation in the range of 0.382 and 0.5 levels by Fibo.
Pump.
We are currently at the 4th stage , as you might have guessed. The consolidation can still take some time, up to a couple of months, since there are no specific time restrictions that invalidate the model.
However, this doesn't cancel the fact that the target is 1 by Fibo, namely $1.7T MarketCap of Altcoins, which is x2 from current points . I tend to believe holders deserve such a run.

LINK Structure Shaping Up for Potential BreakoutvChainlink is now approaching a key resistance trendline after showing a strong bounce from the recent demand zone.
Price is pushing into this trendline with good momentum. If we see a clear breakout and daily close above it, this could open the door for a continuation move toward the next target area around seventeen point seven dollars.
However, this is still an important level to watch. If the trendline holds and price gets rejected, a pullback toward the demand zone near fourteen dollars is possible.
At this stage, the chart is showing a constructive setup. It’s worth keeping an eye on how price behaves here in the coming sessions.
Thanks for reading

Chart Pattern Overview - bullish 🧠 1. Chart Pattern Overview:
The chart depicts a massive symmetrical triangle or contracting wedge formation stretching from early 2021 till now (mid-2025). This is a long-term consolidation pattern, suggesting a major breakout is likely imminent.
Elliott Wave Count (ABCDE Structure):
It follows a classic ABCDE triangle correction pattern:
A: Start of the bearish correction
B: Retracement rally
C: Capitulation dip (2022/2023 bottom)
D: Current push toward resistance (~$2,800)
E (potential): Expected minor pullback before a major breakout
💹 2. Key Levels (Support/Resistance):
Level Type Comment
$2,448 MA Support 200-week MA (in green)
$2,696 MA Resistance Price near golden cross zone
$2,814 Current Price Testing top of wedge (wave D)
$4,868 Historical High 2021 ATH zone
$4,981.93 Key Resistance Breakout target zone
$6,618–7,535 Target Zone Final measured move post-breakout
📐 Technical Indicators:
RSI (Relative Strength Index):
Weekly RSI at ~57: Trending upward, nearing breakout momentum.
Massive descending RSI trendline (since 2021) has been broken, suggesting long-term momentum shift to the upside.
RSI bullish divergence visible between waves C and E.
Volume:
Noticeable volume compression, common before explosive moves.
Watching for volume breakout confirmation (preferably on a weekly close above $3,000).
🔁 Scenario Analysis:
✅ Bullish Scenario (High Probability):
ETH breaks above wave D resistance (~$2,800–3,000).
Post-E breakout toward $4,900, followed by continuation toward $6,600–$7,500.
RSI breakout + triangle resolution = massive upside momentum.
Volume breakout will likely confirm the move.
⚠️ Neutral/Bearish Scenario:
ETH fails to break above wave D (~$2,800–3,000), rolls down toward wave E, which may retest $2,200–$2,400 support.
This forms the final leg (E) of the triangle before real breakout.
📏 Measured Move (Triangle Breakout Target):
Height of triangle: ~$3,500 (from ~$4,800 to ~$1,300)
Breakout target from apex: $6,500–$7,500, aligning with red horizontal resistance lines.
🎯 Conclusion & Strategy:
⚠️ Currently in a high-risk, high-reward zone. ETH is testing the triangle resistance and may either:
Break out above $3,000 → Strong long opportunity with target $4,900 → $6,600+
Reject and retrace to $2,200–$2,400 (wave E) → Final buying opportunity before breakout
📊 Actionable Summary:
Signal Status
Triangle Pattern Forming end of Wave D
RSI Bullish momentum
Volume Compression phase
MA Cross Bullish golden cross
Breakout Confirmation Weekly close > $3,000
Entry Zone $2,600–2,800 (partial)
Safer Entry On retest post-breakout
Long-term Target $6,600 – $7,535
free join my new community

HolderStat┆BTCUSD preparing to test 110kYesterday's rise in CRYPTOCAP:BTC puts the immediate target at testing 110,000 and 112,000 and after that opening a new ATH. Local resistance has been broken.

HolderStat┆ETHUSD move in accumulation zoneHolding CRYPTOCAP:ETH in the range of 2,520 - 2,750 formed an accumulation zone. Breakout of this range gives an opportunity for growth of 3,000+
HolderStat┆SOLUSD reached resistance lineCRYPTOCAP:SOL just flipped the 157 pivot into support after escaping a falling channel and retesting the up-trend. Holding here fuels a run toward the 170 trend-cap and 180 supply shelf; failure invites 150 again. Growing channel, consolidation clusters, breakout watch.
HolderStat┆XRPUSD kept the support trend lineCRYPTOCAP:XRP has successfully consolidated above trendlines that have previously acted as resistance on multiple occasions, but the market could still retest 2.25. A break of 2.35 opens the way to 2.4.

HolderStat┆BNBUSD breakout of the $655 levelCRYPTOCAP:BNB successfully broke upward descending channel and is now above the level of 655. The triangle target was reached around 620, which gives control to bulls.

HolderStat┆ADAUSD above the $0.7 levelCRYPTOCAP:ADA is aiming to test 0.7 level with possible reaching 0.6764. The descending structure has been broken, we expect the formation of an ascending bottom to confirm the new structure.

SUI is building momentum!📈 CRYPTO:SUIUSD After a three-swing corrective pullback into the $3.3 - $2.7 buying zone, price is bouncing and setting up for the next upside move.
The structure is in place—let’s see if the breakout confirms!
