IRON Main trend. Channel. 18 05 2025Logarithm. Time frame 1 week. Down from the listing price -98%. Dying asset. Suitable for pump/dump strategy work, without reference to the ticker name in the spot, with down-to-earth goals, but understanding the high volatility of these assets due to low liquidity (“dying assets”). Work without stops (they are destructive for such assets with such volatility), from the average price of the set/dump. It is advisable to work on a breakthrough of key zones (understanding the liquidity of the asset, and the amount of the entry amount).
Asset as an example, crypto wrappers of such liquidity and work on them now. There are thousands of similar ones on the crypto market. Therefore, there is no point in considering them separately. One similar one, projection - if not thousands of dying scams (created under the hype of the distribution of the last cycle), then hundreds.
🟢A “Dragon” pattern may form if the downward secondary trend is broken. More precisely, it will be broken if a short alt season starts now for alts. The target is in the previous consolidation zone, and to cross the dynamic resistance of the inner zone of the descending channel (zone of decreasing highs). It is rational to work for a breakthrough, understanding the liquidity of the dying asset.
🔴If the market is negative, then the rollback from this descending line will continue to the dynamic support of the channel in the designated zone. If below, then it is a scam and delists from other exchanges where it is traded.
Altseason2025

LUMIA Main trend -91% Low/high zones 01/18/2025Logarithm. Time frame 3 days. Fresh cryptocurrency. This main trend of this cryptocurrency itself (the entire history of trades) acts as a secondary trend in meaning.
The legend of the utility-imitation of this cryptocurrency is the tokenization of assets. A very good idea for the future hype of this kind, especially if they will continue to hype the "American" HBAR.
The chart shows the zones (support/resistance horizontal and dynamic) of maximums and minimums for work.
Now, after breaking the logic of the descending wedge (all the price drop), the price went into sideways consolidation. The channel step and local levels are shown. If they draw an inverted head and shoulders with the price in the channel canvas (part is already there), then there will be an exit to % of its base up, just to one of the following designated resistance zones. If the market as a whole is negative, then from this consolidation there may be another wave of decline. The zones are shown in the idea.
The asset itself was dumped after a local listing pump by -91%, these are not the minimum values for assets of such liquidity. But, sometimes if the market as a whole looks bullish, then the trend of the wrapper is reversed, this is an acceptable decline, but not minimal. Consider this in your money management and work tactics.

Bitcoin Ready to Explode – Just Like Last TimeCRYPTOCAP:BTC is currently showing a powerful accumulation and breakout pattern, repeating the same bullish structure that led to explosive rallies in the recent past.
The chart highlights three key zones where Bitcoin consolidated before breaking out:
🔹 First breakout from the $81K–$86K zone
🔹 Second breakout above $93K after holding above the 50 EMA
🔹Now, Bitcoin is accumulating again just below a key resistance zone (~$105K–$106K)
This resistance zone has acted as a ceiling before, but the current price action suggests strength. The tight consolidation just below resistance often precedes a breakout — and if it happens here, Bitcoin could explode toward $115K+ in the coming weeks.
Key Technical Points:
🔹50 EMA is acting as dynamic support
🔹Higher low structure remains intact
🔹Each consolidation is followed by a strong upward breakout
Repeating accumulation breakout pattern is visible
Next targets: $111K → $115K → $120K
Invalidation: Breakdown below GETTEX:98K with strong volume
If you found this helpful, don’t forget to like, comment, and repost.
Thank you!
#BTC #BTCUSDT #Unichartz

BTC Medium Term and Local Work for 2025 18 05 2025Logarithm. Time frame 3 days. Everything is shown extremely accurately, according to technical analysis, logic based on cyclical repetition, and liquidity consolidation zones as a result of price and trading movements. This trading idea, with precise reversal zones and targets, will last you for 31 weeks. That is, for 7 months.
The previous trading idea BTC/USD Triangle. Medium-term and local work , published on 7 06 2024, it lasted me almost 1 year. It has 63 local work updates (I don't spam with new trading ideas on principle). So, nothing will get lost, you can follow everything, read, possibly use it as training material on a live chart, as a whole explanation of local work, what is really happening on the market, profit/loss potential, always before the price movement, and not after the fact. I show what is, that is, a chart and potential work from the position of a trader, not a crypto marketer.
🟣 Local and medium urgent now
1️⃣💸 The bullish triangle itself (which is not there yet, I have depicted it on the chart for you) acts as a stop and consolidation zone (zone “psychology 100”, reset in trend No. 1). This is the easiest to manipulate and the most probable scenario. This will just be the summer consolidation. Instead of it, there may be:
2️⃣💸 Rising wedge , but more in shape like a triangle (essentially a wedge, there is a meaning of a triangle, but it was formed on aggressive pump news), with a large short liquidity takeout, and not very good logic of the TA movement after that... But, this is a bullish scenario, although quite aggressive.
3️⃣ Working out the bearish targets of the triangle (non-corrective price movement within its canvas). Stopping the decline in the designated zone and reversal upward (continuation of the trend). I emphasize the importance of not fixing the price below the zone of targets of the local corrective decline, which will not break the trend.
4️⃣💸 Double top (or triple). Double top as in 2021 in the distribution zone. This is the least likely scenario, but the most negative, as it breaks the trend. But, this is the least likely scenario, primarily because of the altcoins.
Altcoins in 2021 and now.
4️⃣In 2021, when Bitcoin formed a double top, they (altcoins) were in “space”, that is, in their distribution zones (+500-1000% of the average price of the set).
🔽Now everything is the other way around, they are in capitulation zones (most of them) or in their long-term accumulation channels :
Liquid -90-93%
Medium liquid -93-96%
Low liquid -96-98% or some are already scams or on the verge of it...
Some altcoins have pumped up earlier. That is, they left their long-term accumulation zones earlier. For example: SUN, XRP, DOGE, PEPE, SOL and so on... But there are very few of them, as distributing (raising the price, holding it and selling, inspiring to buy expensive when everything is cheap) in a bearish altcoin trend is very irrational, and you need a lot of money to go against the general market trend.
Main trend (most of it, chart since Binance Exchange foundation) for clarity on a large time frame of this local zone for work.
BTC Primary trend. Secondary — expanding triangle.

ETH is backETH says: Hey you there! I am still alive.
ETH.D bounced off a multi-year top. The altseason is inevitable. Fasten your seat belts ...

BTC.D is started to melting downThe MARKETSCOM:BITCOIN dominance bounced off a very critical level. It seems that the altseason is just started. The upcoming altseason will be face melting. Fill your bags with valuable alts ...

XCH Secondary Trend 11 05 2025Logarithm. Time frame 3 days. A dying asset that is losing the "faith of sectarians" and, as a result, liquidity. Previously, there was aggressive marketing and active luring of bloggers, at very high prices after listing. From the maximum, that is, the listing, a decrease of -97%. Therefore, when trading such, control the risks.
The main trend is now at the moment.
After the pump +140%, the super lows of this low-liquid cryptocurrency were updated again. Pay attention to the squeeze at the moment by -38% (merged at the market, no liquidity, the price fell).
Now is another reversal zone. Local percentages are shown. With a falling market, low liquidity gives a high % decrease at the moment, similarly, the rule works in the opposite direction. When working with such cryptocurrencies in terms of liquidity, remember that these are "dying" assets, therefore, control the risks and set adequate goals.

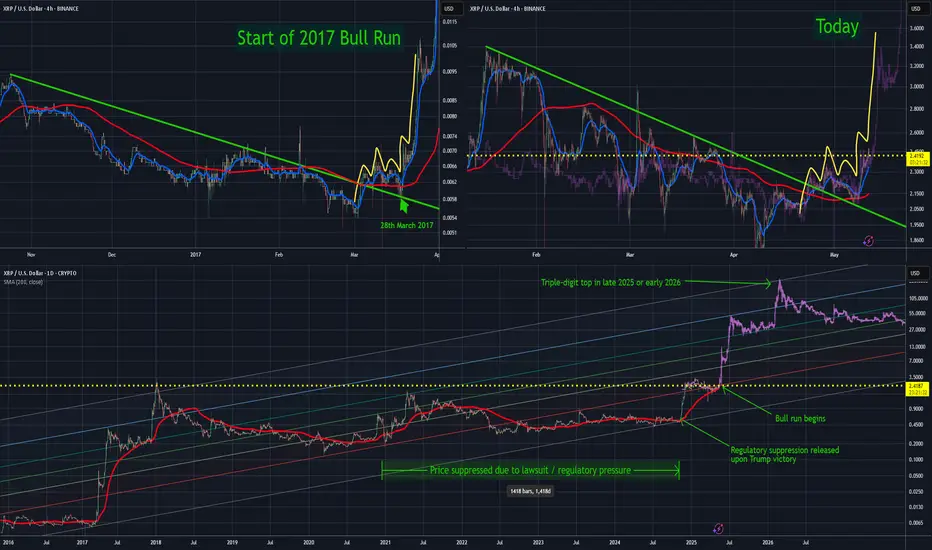
Thesis — How XRP Could Reach Triple Digits Within 12 MonthsAbout a month ago, I pointed out a pattern that preceded XRP’s explosive bull run in 2017. That same pattern is now playing out almost identically — and if the fractal continues to hold, XRP could be gearing up for another major move.
Frankly, the 4-hour chart is a near-mirror image of 2017’s setup. I’ve overlaid the original bar pattern onto today’s price action — the resemblance is hard to ignore.
If this plays out:
We could see a test of all-time highs within a week
Double-digit XRP by mid-year
Triple-digit XRP by late 2025 or early 2026
No guarantees, of course — but the structure is clear, and the setup is there.
For context, I view the November rally as XRP simply reverting to where it would have been had regulatory pressure not artificially suppressed the price. That move wasn’t the bull run — it was a reset.
Importantly, alt season still hasn’t kicked off (just look at BTC dominance), and XRP’s fundamentals are stronger than ever:
Lawsuit behind us
ETFs likely coming
Ongoing partnerships
Pro-crypto regulatory tone globally
Technically and fundamentally, XRP has never looked better.
BTC Dominance Rejected Perfectly at 65.48%CRYPTOCAP:BTC.D
Hi everyone,
In my previous idea, I highlighted the 65.48% level as a key resistance — and today, we’ve seen a sharp and clean rejection right from that zone. The reaction aligns perfectly with the levels and path I mapped out earlier, reinforcing the idea that BTC Dominance may be topping out.
This update confirms the original thesis. No need to overcomplicate — the plan is in motion, and unless the structure changes significantly, the outlook remains the same.
Best regards,
Stealth

WLD Main trend. Super pump +1118 and decline -95. 09 05 2025Logarithm. Main trend. Time frame 3 days.
Super pump +1118.42% and decline -95.16%.
Smart and stupid money. The legend of the project is quite interesting, it is quite possible that there will be attempts to implement it, but always in the first place in such projects is: "money from nothing". The chart confirms this. After the pump +1118.42%, a huge distribution zone, which formed the upper part of the pattern of one of the varieties of "head and shoulders" at an angle. Which makes it clear that the profit is huge. Even now, with a price decrease below the listing prices, from the peak of the pump by -95.16%, which is normal for assets of such liquidity, the profit of some "investors" is +25 X !! Think about what profit was when pumping +1118% (it is impossible to implement, the pump is done just for the chart, to raise the price, for "false goals" and hype, so that on rollbacks "cheap", in the distribution zone they were not afraid to buy on the conditional hype "whales bought". Although now it is unlikely that they will pour. In order to constantly sell at excess profit "at any prices", you need to make interest, both for traders and for investors, that is, volatility waves. They will pump under the market.
Local trend . Local impulse from the minimum prices. Locally, the price rested against the median, in case of its breakthrough - the implementation of the ascending pennant.

MEME Main trend -97% Channel. Reversal or scam zone.Logarithm. Time frame 3 days (less is not needed).
🟡 The price has reached a decline from the highs (not a listing squeeze) -97%. These are practically the maximums of declines after the hype for cryptocurrencies of such liquidity (96-98), after which there is only a complete scam. At the moment, there is a reaction from this zone (the lower zone of the main trend channel) (impulse buyback), and a rollback after it, which forms the canvas of a potential ascending flag. If there is a breakthrough, then locally - the implementation of the ascending flag.
⚠️🔼 These are high-risk cryptocurrencies of such liquidity (that's why such declines are big), but the percentage of price growth in them, for the same reasons (liquidity/volatility) is an order of magnitude greater in the case of their implementation. When working with such assets, observe money management.
🟣 Implementation of the flag's goals (essentially to the channel median) +80-100%
🟡 To the resistance of the descending channel of the main trend +325%
🔵 To potential highs (one of the previous consolidations) +1000-1300%.

TIA Secondary trend. Wedge. Reversal zone. 09 05 2025Logarithm. Time frame 3 days. The price dropped to the listing price zone, namely the level of 2.309. In this zone, the decline stops and the transition to consolidation - sideways. The decline formed a full-fledged descending wedge. This is a bullish pattern in cases of a breakthrough of its resistance (in most cases).
When working with such hype cryptocurrencies, observe money management. Now in “investors” more than 200-300 X, who always sell without loading the glass, but somewhere more, and somewhere less, under the market as a whole. I would advise you to work with the wedge that has now formed and "down-to-earth", logical goals, after exiting it and the consolidation zone.
Main trend. TIA (Celestia) Main trend. Maximum targets of the cycle. XXL+10Х
Line chart of prices, for clarity of the secondary trend, the descending wedge and the potential reversal zone.

XTZ Secondary Trend. Channel. Wedge. Capitulation Zone. 07 05 20Logarithm. Time frame 1 week (less is not necessary).
The secondary trend has formed a horizontal channel for several years, with repeating wedge-shaped formations, the third time we entered under the support of this channel not by squeezes to collect long stop-loss, but by full candles and the structure of a descending wedge. It looks more vertical. The corrective movement to this semi-vertical wedge, quite possibly, will similarly have an aggressive character. The wedge is almost in the final phase of its formation. I showed percentages for clarity to the key reversal zones, for orientation for your money management and setting the first medium-term, and possibly local targets.
The main trend of this previously hyped cryptocurrency since 2017
XTZ/USD Main Trend. Descending Channel 01 2023

APE Main trend. Channel. Wedge. Reversal zones 05 05 2025Logarithm. Time frame 1 week.
1️⃣ Decline from the maximum by -98% , which is acceptable for assets of such liquidity and capitalization, after that either a trend reversal (main), or a complete scam.
2️⃣X (twitter) of this crypto project has 473 thousand subscribers . This army will be sent to pump this cryptocurrency at the right time in the so-called 3rd alt season of this cycle.
🟣And now work with a breakout of the descending wedge, and the price movement to the resistance of the descending channel. The percentage locally - medium-term showed for clarity from two zones - scenarios.
3️⃣The third plus is that this cryptocurrency is traded on 4 liquid exchanges: binance, bybit, okx, and most importantly Coinbase.
Line chart (trend direction and liquidity).

ZK Secondary trend.-82% Wedge. Reversal zones. 01 05 2025Logarithm. Time frame 3 days. Decrease from listing about -82%. For cryptocurrencies of such liquidity and capitalization, this is not the maximum decrease (-90-96%). But sometimes from such values as now (-82-85%), taking into account the news hype during the listing "whales $ 458 million", a reversal and strong pumping can occur under the market as a whole. For example, like another hype project of "hanging noodles" - Flare (distributed to XRP holders). Decrease by -82% and then pumping slightly above the listing price under the next alt season of the cycle + 560%.
This does not necessarily mean that this will happen, this is an example of what happens from such values of decline with such liquidity and hype. In some ways, not only in the structure of the TA formation, but in the hype and disappointment of "investors", the projects are identical.
Main trend , and the previously shown zone, in which the price is now.
ZkSync Main trend. L2 for ETH. $458 million funds 21 02 2025
Main trend now in the moment (full trading history).
There is no need to guess the minimums and maximums. It is important to know these zones and have an acceptable average price, from the position of the trend and its potential. It is regulated by the distributed entry volume (in advance) at potential reversal zones.

$ALT Breaks 136-Day Resistance — Big Rally Loading?#ALT has officially broken above the 136-day-long resistance.
Price is now consolidating above the breakout zone, showing strength.
If momentum continues, a major rally could be ahead.
Watching closely for confirmation of the next move.
NASDAQ:ALT BINANCE:ALTUSDT

Compound 200% very soonHello dear readers!
Another quick one for you. Compound has been around for a while and has seen a massive retrace of around 73%.
There are now reasons to be bullish for the short term.
When we look at the charts we can see a bullflag breakout (fierce) and retest of the upper bound. Its on a hard support also. Any sellers have dried out, and the only way is up.
Target minimum: 132
Stoploss: you can pick
~Rustle

Total 3, do flags point to the target area?Welcome back dearest reader,
Today i have a very interesting analysis for you, quite some valuable time was put into this.
What i've noticed is the following:
-From april 2021 untill july 2021 total 3 has been trading in a bullish wedge flag, when we continue the lines on the full candle bodies the apex pointed to the top of that flag durationwise
-August 2022 till october 2023, extend the trendlines, apex march 2024, look up. Oh.
-March 2024, october 2024 --> apex december 2024, look up. Oh.
Now:
-January 2025, april/may 2025, apex june 2025, look up. Oh.
-I used the fractal from july 2021 as i think we're in this period
-Upward sloping channel from october 2022 untill now could provide insights as to what the target price might be, HH and HL
Target: 1.5T
Also check out my BTC.D idea, these would coincide perfectly
~Rustle
Is it certain this will happen? No-one has a glass ball, all we have are patterns based on past performance, this is no guarantee. But it does look good.

ARB Secondary trend. 24 04 2025Logarithm. Time frame 3 days (less is not necessary).
⚠️ Currently a decline from the maximum of -90% . For assets of such liquidity, these are not the lowest values, but perhaps the previous hype played a role in this. Work from the average price, or on a breakout , and you will not care when the reversal occurs. The main thing is to distribute the entry and exit points after the purchase in advance, that is, distribute the risk and profit. And, after that, no longer be interested in the asset, or opinions, or fictitious positive / negative news to stimulate demand / supply of “stupid money”. Do not get stuck in market noise and unnecessary, fear-driven or greed-driven opinions.
Main trend (the entire history of cryptocurrency trading), for clarity of pricing and the zone for work now, which is discussed.
ARB Main Trend 24 04 2025
🟣 Local trend. At the moment, a wedge-shaped formation has formed in it, there is an attempt to break through it and the price is clamped.
1️⃣ If this zone of minimums is held — for a start, the potential for a downward trend of the secondary trend (shown with a red line).
2️⃣ Then, when it is broken through , — to the channel median (green dotted line).

ARB Main Trend 24 04 2025Logarithm. Time frame 1 week.
Previously a very hyped coin, "killer" of something there...
Now - the dominant opinion is that this is a scam, a scam, "whales are selling now", and so on. It's funny to look at all this and how the opinion changes with the price. Crypto is a mess, there are no other words... That is, now is the time to take a closer look at the asset, and the start of the set.
If the price drops to lower values (shown on the chart), from the position of the trend, and potential percentages of the pump, the price is now acceptable, and the profit will be significant, but not "hamster". Set adequate goals, fix in parts as the trend develops, protect your profit. When there is an aggressive pump "with a stick", by a large %, - completely exit the asset, or protect the profit with a stop.
There is a small probability that an asset of such capitalization, and the unrealization of "buy a candy wrapper", will be knocked down in advance before the full 3rd alt season of this cycle, without distributing "prospects" on the "revival of faith".
⚠️ Now the decline from the maximum is -90% . For assets of such liquidity, these are not the lowest values, but perhaps the previous hype played a role in this. Work from the average price, or on a breakthrough and you will not care when the reversal occurs. The main thing is to distribute the entry and exit points after the purchase in advance, that is, distribute the risk and profit. And, after that, no longer be interested in the asset, or opinions, or fictitious positive / negative news to stimulate demand / supply of "stupid money". Do not get stuck in market noise and unnecessary opinions driven by fear or greed.
1️⃣ If this zone of minimums is held — for starters, the potential for a downward trend of the secondary trend (shown with a red line).
2️⃣ Then, when it is broken , — to the channel median (green dotted line).
🟣Local trend At the moment, a wedge-shaped formation has formed in it, there is an attempt to break through it and the price is clamped.

Is the Altcoin Season Over?Is the Altcoin Season Over?
What's truly unfolding for Bitcoin is precisely the weekly analysis I've laid out for you. While many of you might be eagerly anticipating an extraordinary altcoin season, the harsh reality is that there isn't going to be one. Instead, we've been riding a Bitcoin-dominated season. And once the trend you see in the chart plays out, the market will essentially come to a close, paving the way for a heavy downward spiral for both altcoins and Bitcoin. It's a bitter truth, but it's the reality we're facing

AUDIO Breakout Alert: Parabolic Move Loading?SEED_DONKEYDAN_MARKET_CAP:AUDIO has successfully broken above the long-term descending resistance line, signaling a strong shift in momentum. However, the price is currently facing rejection from the upper marked resistance zone.
If AUDIO manages to close decisively above this zone, it could trigger a parabolic upmove, opening the path for a significant rally. Watch closely for confirmation — this breakout could be the beginning of something big.
DYOR, NFA

I'm Bullish, but... CHR / USDTEvening fellas,
My latest posts are bullish, and I did long some coins during the blood we had a couple of days ago.
But one must always be ready and I am seeing something interesting in a couple of coins, showing me that there's a hidden bearish scenario behind all the hype.
CHR is one of those coins, it's got good news, hype, etc, but I think MM'rs want to destroy some lives.
Keep an eye on it.
Trade thirsty, my friends!
