Drop Your Token – I’ll Do The AnalysisHey everyone! Hope you’re having an amazing weekend !
Want me to analyze your favorite token ? Just drop your request in the comments using this format:
Request Format
Project Name: Bitcoin
Token Symbol: BTC( BINANCE:BTCUSDT )
Important Notes:
I’ll pick and analyze only the first 10 tokens requested .
One request per person — so choose wisely!
I’ll reply directly under your comment with the analysis.
If you find this helpful, don’t forget to Like ❤️ and Share this post with your friends!
Here’s to your success — health, wealth, and great trades! 🚀
Altsignals

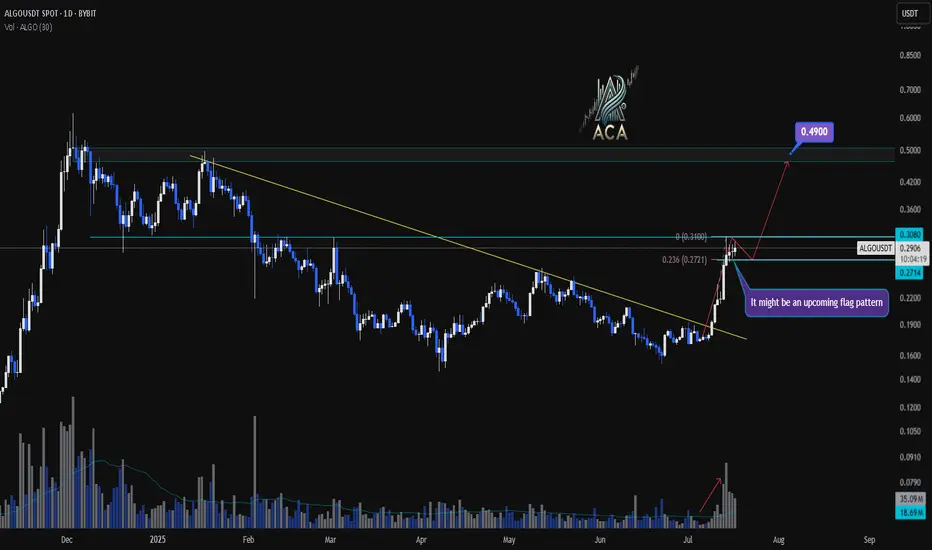
ALGOUSDT Daily Chart Analysis | Continuational patternsALGOUSDT Daily Chart Analysis | Momentum Picks Up on Higher Timeframe
🔍 Let’s break down the latest ALGO/USDT daily chart, highlighting a shift in market structure and key bullish signals.
⏳ Daily Overview
A decisive breakout above the long-standing descending trendline has flipped the narrative for ALGOUSDT. Increased volume during the breakout points to robust bullish momentum, suggesting buyers are regaining control at this multi-month inflection point.
🔔 Flag Pattern & Chart Structure
- Bullish flag pattern is emerging after the recent breakout, as price consolidates in a tight range—a classic continuation formation.
- Former trendline resistance is now acting as support, confirming a notable shift on the higher timeframe.
📐 Fibonacci & Target Levels
- The 0.236 Fibonacci retracement at $0.2771 is providing immediate support, with price consolidating above this anchor level.
- Upside targets:
- First resistance at $0.3080, which aligns with horizontal supply and previous pivot highs.
- If the flag pattern resolves upward, the next Fibonacci extension points to $0.4900, marking a significant confluence and potential for further gains.
📊 Key Highlights
- Strong daily candle and surging volume confirm momentum shift.
- Watch the developing flag pattern for breakout confirmation.
- Major trendline break on the daily signals structural reversal.
- $0.3080 is the immediate target; $0.4900 is the extended objective from the flag/Fibonacci alignment.
🚨 Conclusion
ALGOUSDT is setting up a compelling bullish scenario—keep a close eye on price behavior at the flag and $0.3080 level. A breakout may trigger the next impulsive move toward $0.4900.
$OMNI/USDT – Wait Before You ChaseSEED_DONKEYDAN_MARKET_CAP:OMNI has already exploded with a parabolic breakout, rallying massively after breaking above the falling wedge resistance around $1.63.
Current Situation:
Massive impulse candle from $1.6 to over $4.5
Price retracing after the overextended move
Strong rejection near $3.35
Ideal Entry Zone (wait-for-pullback):
Between $1.47 – $1.63
Aligns with previous resistance and breakout zone
Could act as retest support
Setup After Retest:
Entry: $1.50 – $1.63 range
SL: Below $1.36
Targets: $2.37 → $3.15 → $4.50
Risk-Reward: High if patience wins over FOMO
Patience is key. Don’t chase pumps. Wait for the price to cool off.
DYOR | Not financial advice
#OMNI #Altcoins

AVA/USDT – Long-Term Bullish Reversal in PlayAVA has been trading within a well-defined downward channel for weeks, making consistent lower highs and lower lows. However, price has now broken above the upper boundary of the channel with strong volume and momentum, signaling a potential trend reversal.
Technical Analysis:
Channel Breakout:
Price has successfully closed above the descending trendline (channel top), confirming breakout and bullish intent.
RSI Surge:
RSI has shot past 80, a sign of strong bullish momentum. Short-term pullbacks may occur, but long-term sentiment is shifting.
Higher Lows Forming:
Structure is starting to shift from bearish to bullish, especially with current candle body closings above $0.03016.
Volume Spike:
Notable increase in buying volume, often seen before trend flips in micro caps or small altcoins.
Key Levels to Watch:
Support Zones:
$0.03016 – Key breakout level; should act as support now
$0.02440 – Historical accumulation zone
$0.02100 – Long-term base support
Resistance / Target Zones:
T1: $0.04026 – Local structure and previous consolidation
T2: $0.05550 – Psychological and technical resistance
T3: $0.07971 – Major reversal zone
T4: $0.10185 – Long-term target from macro high
Stoploss:
$0.02400 (close below re-enters channel and invalidates breakout)
Entry Idea:
Accumulation Zone: $0.029–$0.031
This is the ideal area for positioning with minimal risk and a good reward ratio.
Not Financial Advice | DYOR Always

ZBCN/USDT | Breakout from Downtrend Channel | 360%+ Potential !!ZBCN has broken out of a clean falling channel on the 4H timeframe. This setup resembles the earlier rally in May that delivered over 350% upside. We may be setting up for another explosive move, contingent on a successful retest.
Trade Setup:
Entry (on retest): 0.002901 – 0.003021
Stop Loss: 0.00243 (below channel low)
Targets:
0.00375
0.00510
0.00685
Long-term target: 0.01137
Total potential upside: ~360%
Structure Analysis:
Price is now out of the descending channel
Previous move from similar breakout yielded ~357%
RSI climbing with volume surge — momentum shift evident
Watching BTC for macro support
This could be a game-changing entry for medium to long-term holders if the retest holds.
DYOR | Not financial advice

PARTI Setup: Key Reversal Zone Could Spark +50% RallyToday, I want to analyze the Particle Network ( BINANCE:PARTIUSDT ) project for you, which has a chance of increasing by +20% to +50% in the short term .
Let's first take a look at the fundamental state of the Particle Network (PARTI) project .
Particle Network is building a modular Layer-1 blockchain with a focus on Chain Abstraction, aiming to unify user experiences across multiple chains through:
Universal Accounts – Single account across all chains
Universal Liquidity – Access liquidity without bridging
Universal Gas – Seamless cross-chain transactions without gas token concerns
The project has:
Raised $25M+ funding from top-tier investors (Binance Labs, Animoca Brands, Spartan Group)
Integrated with 60+ blockchains and 900+ dApps
Reached over 1.3M testnet accounts and 27,100 daily transactions (Messari Q1 2025 report)
Recently launched UniversalX (a cross-chain DEX) as its flagship dApp
Summary:
Particle Network shows strong fundamentals with innovative tech, a growing ecosystem, and backing from major players in crypto. Long-term success will depend on user adoption of Universal Accounts and dApps like UniversalX.
------------------------------------------------------
Now let's take a look at the PARTI token chart on the daily time frame .
PARTI token is currently trading near Potential Reversal Zone(PRZ) , Monthly Support(2) . There is also a possibility of a Range channel forming, we should wait for the confirmation of the second bottom .
I expect the PARTI token to start rising again from the Potential Reversal Zone(PRZ) and near $0.14 .
Note: Stop Loss(SL)= $0.1177
Please respect each other's ideas and express them politely if you agree or disagree.
Particle Network Analyze (PARTIUSDT), Daily time frame.
Be sure to follow the updated ideas.
Do not forget to put a Stop loss for your positions (For every position you want to open).
Please follow your strategy and updates; this is just my Idea, and I will gladly see your ideas in this post.
Please do not forget the ✅' like '✅ button 🙏😊 & Share it with your friends; thanks, and Trade safe.

LOKA/USDT – Breakout WatchLOKA has broken out of a descending channel on the 1H chart, showing early signs of bullish momentum. The price has breached the upper boundary of the falling structure, supported by strong volume and clean trend confirmation.
Support Levels:
$0.05293 (recent breakout level)
$0.04474 (range low support)
Resistance / Target Levels:
$0.06104
$0.06732
$0.07253
Stoploss: Below $0.050 to protect against false breakout
Trade Idea:
Entry on retest near $0.053–$0.054 for a safer risk-reward setup.
Targets align with previous horizontal resistances and Fibonacci levels.
LOKA looks poised for a potential trend reversal if the momentum sustains above the channel. A break and hold above $0.061 would open room for higher targets.
As always, risk management is key.
Not financial advice – DYOR.

HOOK/USDT – Successful Retest of BreakoutHOOK has successfully retested its downtrend breakout zone and is now attempting a fresh leg up, signaling renewed bullish strength. The previous resistance is now acting as solid support.
Analysis Highlights:
Breakout from multi-week downtrend line
Sharp pullback → clean retest of the breakout line
Buyers are stepping back in from the $0.095 zone
Support Levels:
$0.0950 – Immediate support (trendline retest zone)
$0.0996 – Strong horizontal support
$0.0890 – Key invalidation level (SL zone)
Resistance / Targets:
$0.1063 – First target
$0.1234 – Mid-term resistance
$0.1508 – Extended bullish target
Stoploss: Below $0.0890 (close below trendline)
Structure looks bullish for continuation if HOOK holds above $0.0950 and breaks $0.1063 with volume.
DYOR
Not Financial Advice

MOVE/USDT – Long-Term Breakout WatchTimeframe: 4H (Long-Term Setup)
MOVE is testing a long-term descending trendline. After months of consistently lower highs, we may be on the verge of a bullish breakout.
The previous breakout attempt in April was a fakeout, but the current consolidation near resistance looks healthier and more sustainable this time.
Key Levels to Watch:
Resistance Levels (Upside Targets):
$0.1446 (Current Zone / Breakout Level)
$0.2265 – Mid-term target
$0.3397 – Key structural resistance
$0.5449 – Long-term target if trend reverses fully
Support Levels:
$0.1312 – Immediate support
$0.1173 – Major long-term base support (strongest defense)
Suggested Stop-Loss:
Below $0.117 (invalidates breakout structure)
Outlook:
If MOVE breaks and holds above the descending trendline, a major trend reversal could follow.
The setup suggests accumulation at the bottom, and volume confirmation will be key.
Patience is crucial — this is a long-term opportunity, not a quick trade. Small caps often move explosively once supply zones are cleared.
DYOR | Not Financial Advice

EIGEN/USDT – Falling Wedge Breakout Setup | 4H ChartEIGEN is currently showing a bullish falling wedge pattern near a strong horizontal demand zone, indicating a potential reversal move.
Technical Breakdown:
Entry Zone: $1.17 – $1.18 (current market price)
Stop-Loss: Below $1.14 (last wick low/invalidation of wedge)
Target Price: $1.74, $2.51 (+118%) from CMP
Resistance 1 (Minor): $1.33
Resistance 2 (Major Target): $1.74
Support Levels:
• $1.17 (Immediate support)
• $0.749 (Major demand zone if breakdown)
Target & Risk-Reward
Target Price: $1.74, $2.51 (+118%) from CMP
Stop-Loss: $1.14
Risk per token: ~$0.03
Potential Profit per token: ~$0.56
Risk:Reward Ratio: ~1:6.5
Potential Gain: +118% from entry
Indicators:
Falling wedge breakout looks imminent
RSI (14) at 39.5 — recovering from oversold zone
Demand zone previously triggered rallies — the probability of a bounce is high
Strategy:
Wait for a 4H candle close above the wedge trendline + volume confirmation to validate the breakout. Scaling in near support with a tight stop-loss can offer a strong risk-reward play.
Not Financial Advice – This is a technical view for educational purposes. Always DYOR & manage risk accordingly.
Like & follow if you found this useful!
#EIGEN #Altcoins #Breakout

OP / USDT 4hr PUMP INCOMING? OP/USDT – 4H Chart Summary
Market Structure:
4H Timeframe:
- Price consolidating within a descending triangle/wedge pattern, indicating potential buildup before a breakout.
- Lower Timeframes (1H and below): Bearish trend structure with lower highs and lows.
- OBV (On-Balance Volume): Forming a wedge—suggesting accumulation or distribution phase nearing a breakout.
Key Zones:
Demand Zone (Support):
- 0.5483 – 0.6351
This area has provided strong support historically. A clean break below could signal continuation of the larger downtrend.
Supply Zone (Resistance):
- 0.9068 – 1.0414
-Historically rejected price; high probability of reversal or consolidation if revisited.
Fair Value Gaps (FVG):
- FVG 1: 0.6659 – 0.6838
- FVG 2: 0.7024 – 0.7308
These inefficiency zones are likely to attract price if bullish momentum builds. Watch for potential short-term rejection or continuation setups here.
Volume Profile:
Strongest volume node (high liquidity zone) sits between 0.7470 – 0.8000
Suggests this area has been heavily traded and may act as magnet/resistance if approached again.
Fibonacci Confluence:
Previous swing high at 0.8232 aligns with the 0.618–0.65 golden pocket
A critical zone for potential take-profit or trend reversal on a breakout.
Scenarios:
Bullish Case:
If price holds above 0.6351 and bounces, look for:
- Retest of FVG 1, followed by FVG 2.
- Breakthrough of 0.7308 could target the golden pocket and swing high at 0.8232.
- Sustained bullish move may reach the supply zone above 0.9068.
Bearish Case:
- Breakdown below 0.6351 and especially below 0.5483 would:
- Invalidate the wedge support.
- Confirm continuation of the macro downtrend.
-Open room for new lows and bearish expansion.
Conclusion:
Price is at a key decision point inside a wedge.
Reaction at 0.6351 is critical—support bounce targets higher inefficiencies; breakdown signals deeper bearish continuation.
OBV and volume structure suggest an imminent volatility spike—prepare for a breakout.

ALTUSDT Forming Falling WedgeALTUSDT has recently completed a breakout from a well-formed falling wedge pattern, a strong bullish technical signal that often precedes significant upward momentum. The wedge breakout is backed by a noticeable spike in trading volume, adding credibility to the move and indicating growing market participation. This classic reversal pattern suggests that a major trend shift could be underway, and price projections indicate a potential gain in the range of 70% to 80%, aligning with historical performance of such breakouts.
What makes this setup more compelling is the structure of the wedge itself—tight, consistent, and with clear lower highs and lower lows, followed by a strong bullish candle cutting through resistance. This is a textbook example of a bullish breakout where the price decisively exits the consolidation zone and starts trending upward. With volume confirming the breakout, many traders see this as an early-stage rally signal with room to grow.
Investor sentiment around ALTUSDT is gaining strength, particularly on social platforms and trading communities. This surge in attention could fuel further buying pressure, particularly as the breakout becomes more visible to retail and technical traders. ALTUSDT has shown the ability to move sharply during bullish phases, and this breakout could signal the beginning of a new leg higher, especially if it maintains momentum over the next few daily closes.
With strong technical structure, increasing investor interest, and supportive volume, ALTUSDT is shaping up to be one of the stronger bullish breakout candidates in the current market environment. Traders looking for high-reward setups may find this an ideal entry point with a well-defined technical framework and attractive upside potential.
✅ Show your support by hitting the like button and
✅ Leaving a comment below! (What is You opinion about this Coin)
Your feedback and engagement keep me inspired to share more insightful market analysis with you!

BTC.D+ETH.D+USDT.D+USDC.D InsightsAn interesting chart with BSL still to take and pushing for it.
If you study the time cycle of last cycles altcoin season you will see that it occurred after this chart took the range highs and BSL and then distributed from there to new lows
I believe we are seeing the same scenario setting up in this chart and data with it pushing to the BSL and range highs into supply, before a possible reversal bearish kicking off the final altcoin cycle and season.
We shall see... One to add to your watchlist!

SUI is building momentum!📈 CRYPTO:SUIUSD After a three-swing corrective pullback into the $3.3 - $2.7 buying zone, price is bouncing and setting up for the next upside move.
The structure is in place—let’s see if the breakout confirms!

PNUT - LONG SET-UPBINANCE:PNUTUSDT
𝐏𝐍𝐔𝐓/𝐔𝐒𝐃𝐓
PnuT is forming a bullish base above support and pushing against descending trendline resistance. A breakout above $0.3275 could ignite a 100% move higher. Setup looks clean and coiled

Magic Eden’s ME Token Eyes Bounce After Trump Wallet VolatilityOn June 3, , Magic Eden ( BINANCE:MEUSDT ) announced a collaboration with a project called to launch a new" Trump Wallet "
This announcement triggered a + 35% price increase , pushing the price of ME Token to approximately $1.17 .
However, shortly afterward, members of the Trump family, including Donald Trump Jr. , denied any involvement with the wallet or the project.
This resulted in a -20% price drop due to shaken investor confidence .
-----------------------------
Let’s see how ME Token is doing on the 1-hour timeframe .
ME Token is trading in the Support zone($1.03-$0.96) near the 50_SMA(Daily) .
From the Elliott Wave theory perspective, ME Token seems to have completed the main wave 3 and is currently completing the main wave 4 .
I expect ME Token to rise to at least $1.146(+15%) .
Second Target: $1.237
Note: Stop Loss = $0.95
Please respect each other's ideas and express them politely if you agree or disagree.
Magic Eden Analyze (MEUSDT), 1-hour time frame.
Be sure to follow the updated ideas.
Do not forget to put a Stop loss for your positions (For every position you want to open).
Please follow your strategy and updates; this is just my Idea, and I will gladly see your ideas in this post.
Please do not forget the ✅' like '✅ button 🙏😊 & Share it with your friends; thanks, and Trade safe.

ETH | New ATH on the cards | Fibonacci $7K TARGET Ethereum is gearing up towards the upside and we're seeing another resistance zone being crushed.
While BTC is trading sideways, we can expect ETH to play catch-up:
Don't miss yesterday's update on DOT:
_____________________________

Pancake swing tradePancake is getting ready to release all the pressure that was build up inside of it.
we have vast amount of liquidity above us that we need to take.
Get ready! 🚀🌕
(You have the full responsibility for each action that u take because I'm not your financial advisor)

Your Guide to Token Trends & Market Action – With My AnalysisHey everyone! Hope you're all enjoying a great weekend !
If you'd like a Token analysis , please drop your request in the comments using the format below:
Request Format :
Project Name: Bitcoin
Token Symbol: BTC
Please Note:
I’ll be analyzing up to 10 tokens only .
One request per person — make it count!
Your analysis will be posted directly as a reply to your comment .
If you find this helpful, don’t forget to ✅ Like ✅ and Share it with your friends.
Wishing you health, wealth, and massive success!

COINBASE and ALTS going hand in hand! Massive break-out expectedCoinbase (COIN) and the Crypto Total Market Cap (excluding top 10) are going hand in hand in this Cycle as their patterns since the November 08 2021 High have been virtually identical.
Right now we are on a strong rebound which was initiated on both after breaching below the 1W MA200 (orange trend-line). That is basically a Double Bottom, aiming at a break-out above their respective Resistance levels, which is expected to be massive.
Notice how even their 1W RSI patterns are similar, both Falling Wedges. Also their Bull Cycles both started on an Inverse Head and Shoulders pattern, so there is every reason to expect that the two will continue hand in had until their very peaks of the Cycles.
-------------------------------------------------------------------------------
** Please LIKE 👍, FOLLOW ✅, SHARE 🙌 and COMMENT ✍ if you enjoy this idea! Also share your ideas and charts in the comments section below! This is best way to keep it relevant, support us, keep the content here free and allow the idea to reach as many people as possible. **
-------------------------------------------------------------------------------
💸💸💸💸💸💸
👇 👇 👇 👇 👇 👇

BTC.D is started to melting downThe MARKETSCOM:BITCOIN dominance bounced off a very critical level. It seems that the altseason is just started. The upcoming altseason will be face melting. Fill your bags with valuable alts ...

MOVE hughe FW breakout incomming?MOVE has been dropping over 80% from it's ATH.
This looks like bearmarket scenario's. But as I did mention before in other posts. This bull cycle is different and especially for ALTCOINS. The massive growth in number of ALTS makes it hard to stand out and gain momentum. The money and social attention is widely spread over milions of coins now. The 1875 active accounts holding MOVE is reasonable for a relative new project jet it doesn't signal mass adoption.
MOVE is a Layer1 / 2 and ZK coin in the smart contracts. It's also in the World Liberty Financial portfoilio and made in the USA. These fundamentals are bullisch for MOVE. A breakout from the FW pattern could make it take off at rocket pace towards the former highs.
Allong the way we can see and identify several major S/R line that have to be broken first.
Indicators:
The rounded bottom / consolidation could mark the bottom.
Stoch indicator: The STOCH shows signs of recovery
Golden Cross: The short term MA has been crossing the Long term MA signaling recovery.
Volume: The low volume is typical for the consolidation.
CONSOLIDATION above support and below resistance
The level where we find MOVE right now looks like consolidation and bottom possibility. With support at 0,218 a small resistance at 0,34 and a major resistance at 0,56.
My trading plan for now:
I will open a new bigger SPOT position in order to lower my AVG ENTRY that has lost over 60% in the last months. A run up from this level to the S/R level 0,56 means a 177% profit.

BTC Dominance – Are We Near the true Altseason?BTC Dominance – Are We Near the Altseason?
BTC dominance has been rising recently, and many believe the real altseason will begin once BTC.D reaches 71%, just like in the previous cycle.
However, it might happen sooner than expected.
On the 1W timeframe, several signs are flashing:
RSI is showing a bearish divergence that’s about to play out.
Since January 2023, the MACD has been in overbought territory.
Each time RSI peaked above 70%, we saw a rejection of 8–10%. It's currently at 68% and nearing that level again.
On December 2nd, 2024, the structure was broken, but it has since re-entered its rising channel.
🔗
On the Daily chart:
BTC.D is approaching its cycle peak around 65%, which should act as a resistance and potential reversal point.
Since the structure was already broken once, another downside break is highly probable.
🔗
On the Monthly chart, it’s pretty clear we’re nearing the end of the BTC dominance cycle, and a rotation of capital is likely to follow soon.
Now, there are 2 possible scenarios:
Altseason starts at 65% in this cycle.
Altseason starts again at 71%, mirroring the previous cycle.
When you look at the Monthly chart, it’s easy to see that this cycle is different. With an overbought RSI, and a potential break of structure, a long-awaited MACD correction could be the trigger for the real altseason.
🚨 DYOR (Do Your Own Research) 🚨
