"Analyzing Dogecoin's Path to $10: Potential for the 25 BullRunAt the time of writing, Dogecoin sits at 0.0255. When applying the RSI with Dogecoin at 65.72, this means Dogecoin is overbought and some correction needs to happen before realistic projected gains in 2025 can occur.
Final thoughts are: Investment Assessment and Conclusion: Dogecoin can go to $10 in 2025—just not anytime soon, but eventually. But it needs project developments to be effectively completed and the price floor most crucially, around $2.00. Thus, for a $10 Dogecoin to happen, some investors need to HODL and some investors need to take profits during the bull run for price support. The RSI is currently at 40.92, which means it's teetering on the edge of oversold but also stabilizing, which points toward a bit of consolidation before a breakout on these ranges.
Key Resistance Levels: $0.39 to $0.47: Short-term resistances that need to be breached in order for upward momentum to continue. $0.59: Major psychological/technical resistance that will need to be maintained to render any subsequent significant/exponential growth. $0.73: Resistance against previous all-time highs; breaching this will allow for exponential growth.
Macro Considerations: Market Sentiment: Bull run in 2025 reliant on macroeconomic factors and overarching crypto adoption. DOGE CATALYSTS: Musk's ongoing involvement and potential application on X down the line, additional application with other sites or as a payment method, community buy-in and meme use.
DOGE GROWTH REQUIREMENTS: In order for DOGE to grow naturally in value to the $10 price target, it needs a market cap over such price, which means billions, if not trillions of dollars need to be infused into the crypto world with Dogecoin having the same market cap or larger.
FINAL THOUGHTS: The $10 price target requires so much bullish sentiment even based on Dogecoin trading in millionths of cents. It requires an ongoing bullish trend for the foreseeable future. Unheard of bullish derivatives season and retail/institutional participation macro market/fundamentals monitor. Bullish progression: Entire resistance lines on the chart have been breached. Because for something like this to occur, it has to be an extraordinarily bullish, extremely engaged retail and institutional lineup plus macro market/fundamentals. People need to be in the know and paying attention to breakout levels and macro developments in the months to come.
Altsignals

BBUSDT Analysis: I Won't Let Them Hunt You!In BBUSDT, my aim is to help you avoid getting lost in intermediate areas , falling for fake supports , or being easily hunted. The blue box represents a strong zone for potential reactions. However, due to BBUSDT being a weaker coin , it’s wise to risk half of the normal amount for added caution.
Key Points:
Avoid Fake Supports: Intermediate levels may not hold; focus on the blue box.
Risk Management: Weaker coin status suggests taking only half the usual risk.
Strong Demand Zone: Blue box offers a meaningful area for strategic entries.
Confirmation Indicators: I will use CDV, liquidity heatmaps, volume profiles, volume footprints, and upward market structure breaks on lower time frames for validation.
Learn With Me: If you want to master how to use CDV, liquidity heatmaps, volume profiles, and volume footprints to identify precise demand zones, just DM me. I’d be happy to guide you!
Reminder: Be aware of the market's current state and approach it with caution. Successful trading relies on meaningful levels and robust confirmations.
If you think this analysis helps you, please don't forget to boost and comment on this. These motivate me to share more insights with you! Wishing everyone success in their trades.
If you think this analysis helps you, please don't forget to boost and comment on this. These motivate me to share more insights with you!
I keep my charts clean and simple because I believe clarity leads to better decisions.
My approach is built on years of experience and a solid track record. I don’t claim to know it all, but I’m confident in my ability to spot high-probability setups.
If you would like to learn how to use the heatmap, cumulative volume delta and volume footprint techniques that I use below to determine very accurate demand regions, you can send me a private message. I help anyone who wants it completely free of charge.
My Previous Analysis
🐶 DOGEUSDT.P: Next Move
🎨 RENDERUSDT.P: Opportunity of the Month
💎 ETHUSDT.P: Where to Retrace
🟢 BNBUSDT.P: Potential Surge
📊 BTC Dominance: Reaction Zone
🌊 WAVESUSDT.P: Demand Zone Potential
🟣 UNIUSDT.P: Long-Term Trade
🔵 XRPUSDT.P: Entry Zones
🔗 LINKUSDT.P: Follow The River
📈 BTCUSDT.P: Two Key Demand Zones
🟩 POLUSDT: Bullish Momentum
🌟 PENDLEUSDT.P: Where Opportunity Meets Precision
🔥 BTCUSDT.P: Liquidation of Highly Leveraged Longs
🌊 SOLUSDT.P: SOL's Dip - Your Opportunity
🐸 1000PEPEUSDT.P: Prime Bounce Zone Unlocked
🚀 ETHUSDT.P: Set to Explode - Don't Miss This Game Changer
🤖 IQUSDT: Smart Plan
⚡️ PONDUSDT: A Trade Not Taken Is Better Than a Losing One
💼 STMXUSDT: 2 Buying Areas
🐢 TURBOUSDT: Buy Zones and Buyer Presence
🌍 ICPUSDT.P: Massive Upside Potential | Check the Trade Update For Seeing Results
🟠 IDEXUSDT: Spot Buy Area | %26 Profit if You Trade with MSB
📌 USUALUSDT: Buyers Are Active + %70 Profit in Total
🌟 FORTHUSDT: Sniper Entry +%26 Reaction
🐳 QKCUSDT: Sniper Entry +%57 Reaction
I stopped adding to the list because it's kinda tiring to add 5-10 charts in every move but you can check my profile and see that it goes on..

LOOMUSDT %180 Daily Volume Spike! Active Buyers!LOOMUSDT has seen a 180% increase in volume , indicating strong buyer activity. These levels present potentially good entry points ; however, given the overall market conditions , achieving a significant rise could be challenging. It is essential to manage your risk carefully .
Key Points:
Volume Spike: A 180% increase signals heightened activity and buyer interest.
Market Conditions: Weak general conditions necessitate cautious and calculated risk-taking.
Confirmation Indicators: I rely on CDV, liquidity heatmaps, volume profiles, volume footprints, and upward market structure breaks on lower time frames for validating trades.
Learn With Me: If you want to master how to use CDV, liquidity heatmaps, volume profiles, and volume footprints to identify accurate demand zones, just DM me. I’d be happy to guide you!
Reminder: Be aware of the market's current state and approach it with caution. Successful trading relies on meaningful levels and robust confirmations.
If you think this analysis helps you, please don't forget to boost and comment on this. These motivate me to share more insights with you! Wishing everyone success in their trades.
If you think this analysis helps you, please don't forget to boost and comment on this. These motivate me to share more insights with you!
I keep my charts clean and simple because I believe clarity leads to better decisions.
My approach is built on years of experience and a solid track record. I don’t claim to know it all, but I’m confident in my ability to spot high-probability setups.
If you would like to learn how to use the heatmap, cumulative volume delta and volume footprint techniques that I use below to determine very accurate demand regions, you can send me a private message. I help anyone who wants it completely free of charge.
My Previous Analysis
🐶 DOGEUSDT.P: Next Move
🎨 RENDERUSDT.P: Opportunity of the Month
💎 ETHUSDT.P: Where to Retrace
🟢 BNBUSDT.P: Potential Surge
📊 BTC Dominance: Reaction Zone
🌊 WAVESUSDT.P: Demand Zone Potential
🟣 UNIUSDT.P: Long-Term Trade
🔵 XRPUSDT.P: Entry Zones
🔗 LINKUSDT.P: Follow The River
📈 BTCUSDT.P: Two Key Demand Zones
🟩 POLUSDT: Bullish Momentum
🌟 PENDLEUSDT.P: Where Opportunity Meets Precision
🔥 BTCUSDT.P: Liquidation of Highly Leveraged Longs
🌊 SOLUSDT.P: SOL's Dip - Your Opportunity
🐸 1000PEPEUSDT.P: Prime Bounce Zone Unlocked
🚀 ETHUSDT.P: Set to Explode - Don't Miss This Game Changer
🤖 IQUSDT: Smart Plan
⚡️ PONDUSDT: A Trade Not Taken Is Better Than a Losing One
💼 STMXUSDT: 2 Buying Areas
🐢 TURBOUSDT: Buy Zones and Buyer Presence
🌍 ICPUSDT.P: Massive Upside Potential | Check the Trade Update For Seeing Results
🟠 IDEXUSDT: Spot Buy Area | %26 Profit if You Trade with MSB
📌 USUALUSDT: Buyers Are Active + %70 Profit in Total
🌟 FORTHUSDT: Sniper Entry +%26 Reaction
🐳 QKCUSDT: Sniper Entry +%57 Reaction
I stopped adding to the list because it's kinda tiring to add 5-10 charts in every move but you can check my profile and see that it goes on..

CVXUSDT %184 Daily Volume Spike! Strategic Blue Box LevelsCVXUSDT has shown a 184% daily volume increase , highlighting heightened interest in this asset. You may have noticed that my blue boxes are progressively moving lower. This is a conscious decision , as the current market conditions demand targeting only highly meaningful levels to justify taking risks.
Key Points:
Volume Spike: A 184% increase indicates elevated activity in CVXUSDT.
Blue Box Strategy: Positioned at significant demand zones to minimize unnecessary risk.
Confirmation Indicators: I use tools like CDV, liquidity heatmaps, volume profiles, and volume footprints to confirm trades at the blue box.
Learn With Me: If you want to master how to use CDV, liquidity heatmaps, volume profiles, and volume footprints to pinpoint accurate demand zones, just DM me. I'd be happy to guide you!
Reminder: Be aware of the market's current state and approach it with caution. Successful trading relies on meaningful levels and robust confirmations.
If you think this analysis helps you, please don't forget to boost and comment on this. These motivate me to share more insights with you! Wishing everyone success in their trades.
If you think this analysis helps you, please don't forget to boost and comment on this. These motivate me to share more insights with you!
I keep my charts clean and simple because I believe clarity leads to better decisions.
My approach is built on years of experience and a solid track record. I don’t claim to know it all, but I’m confident in my ability to spot high-probability setups.
If you would like to learn how to use the heatmap, cumulative volume delta and volume footprint techniques that I use below to determine very accurate demand regions, you can send me a private message. I help anyone who wants it completely free of charge.
My Previous Analysis
🐶 DOGEUSDT.P: Next Move
🎨 RENDERUSDT.P: Opportunity of the Month
💎 ETHUSDT.P: Where to Retrace
🟢 BNBUSDT.P: Potential Surge
📊 BTC Dominance: Reaction Zone
🌊 WAVESUSDT.P: Demand Zone Potential
🟣 UNIUSDT.P: Long-Term Trade
🔵 XRPUSDT.P: Entry Zones
🔗 LINKUSDT.P: Follow The River
📈 BTCUSDT.P: Two Key Demand Zones
🟩 POLUSDT: Bullish Momentum
🌟 PENDLEUSDT.P: Where Opportunity Meets Precision
🔥 BTCUSDT.P: Liquidation of Highly Leveraged Longs
🌊 SOLUSDT.P: SOL's Dip - Your Opportunity
🐸 1000PEPEUSDT.P: Prime Bounce Zone Unlocked
🚀 ETHUSDT.P: Set to Explode - Don't Miss This Game Changer
🤖 IQUSDT: Smart Plan
⚡️ PONDUSDT: A Trade Not Taken Is Better Than a Losing One
💼 STMXUSDT: 2 Buying Areas
🐢 TURBOUSDT: Buy Zones and Buyer Presence
🌍 ICPUSDT.P: Massive Upside Potential | Check the Trade Update For Seeing Results
🟠 IDEXUSDT: Spot Buy Area | %26 Profit if You Trade with MSB
📌 USUALUSDT: Buyers Are Active + %70 Profit in Total
🌟 FORTHUSDT: Sniper Entry +%26 Reaction
🐳 QKCUSDT: Sniper Entry +%57 Reaction
I stopped adding to the list because it's kinda tiring to add 5-10 charts in every move but you can check my profile and see that it goes on..

HIVEUSDT %1500 DAILY VOLUME SPIKEThere is a 1500% daily volume spike in HIVEUSDT, signaling significant activity and attention in this market.
The blue box is extremely valuable from multiple perspectives. I have used heatmap , cumulative volume delta (CVD) , and volume footprint techniques to identify this as a precise demand region , where buyers are likely to step in with strength.
Key Points:
Volume Spike: 1500% increase highlights a surge in market activity.
Blue Box: Carefully identified as a critical demand zone using advanced techniques.
Techniques Used: Heatmap, CVD, and volume footprint for pinpoint accuracy.
If you'd like to learn how I use these tools to determine such precise demand zones, just DM me!
If you think this analysis helps you, please don't forget to boost and comment on this. These motivate me to share more insights with you!
I keep my charts clean and simple because I believe clarity leads to better decisions.
My approach is built on years of experience and a solid track record. I don’t claim to know it all, but I’m confident in my ability to spot high-probability setups.
If you'd like to learn how I use heatmaps, cumulative volume delta, and volume footprint techniques to identify highly accurate demand regions, feel free to send me a private message. I'm happy to assist anyone interested, with no charge or obligation.
My Previous Analysis
🐶 DOGEUSDT.P: Next Move
🎨 RENDERUSDT.P: Opportunity of the Month
💎 ETHUSDT.P: Where to Retrace
🟢 BNBUSDT.P: Potential Surge
📊 BTC Dominance: Reaction Zone
🌊 WAVESUSDT.P: Demand Zone Potential
🟣 UNIUSDT.P: Long-Term Trade
🔵 XRPUSDT.P: Entry Zones
🔗 LINKUSDT.P: Follow The River
📈 BTCUSDT.P: Two Key Demand Zones
🟩 POLUSDT: Bullish Momentum
🌟 PENDLEUSDT.P: Where Opportunity Meets Precision
🔥 BTCUSDT.P: Liquidation of Highly Leveraged Longs
🌊 SOLUSDT.P: SOL's Dip - Your Opportunity
🐸 1000PEPEUSDT.P: Prime Bounce Zone Unlocked
🚀 ETHUSDT.P: Set to Explode - Don't Miss This Game Changer
🤖 IQUSDT: Smart Plan
⚡️ PONDUSDT: A Trade Not Taken Is Better Than a Losing One
💼 STMXUSDT: 2 Buying Areas
🐢 TURBOUSDT: Buy Zones and Buyer Presence
🌍 ICPUSDT.P: Massive Upside Potential | Check the Trade Update For Seeing Results
🟠 IDEXUSDT: Spot Buy Area | %26 Profit if You Trade with MSB
📌 USUALUSDT: Buyers Are Active + %70 Profit in Total
🌟 FORTHUSDT: Sniper Entry +%26 Reaction
I stopped adding to the list because it's kinda tiring to add 5-10 charts in every move but you can check my profile and see that it goes on..

FORTHUSDT Analysis: Monitoring Key Buyer Zones My previous analysis on FORTHUSDT was spot on, as you can see in this link: FORTHUSDT: Sniper Entry +%26 Reaction .
Currently, we still have buyer interest , but the overall market conditions are weak . If the first blue box is lost, I will avoid any entries until the lower blue box , which represents a stronger demand zone.
Key Points:
Buyer Interest: Present, but market sentiment remains fragile.
First Blue Box: Critical zone; losing it invalidates entries here.
Lower Blue Box: The next significant demand area for potential entries.
If you think this analysis helps you, please don't forget to boost and comment on this. These motivate me to share more insights with you!
I keep my charts clean and simple because I believe clarity leads to better decisions.
My approach is built on years of experience and a solid track record. I don’t claim to know it all, but I’m confident in my ability to spot high-probability setups.
If you'd like to learn how I use heatmaps, cumulative volume delta, and volume footprint techniques to identify highly accurate demand regions, feel free to send me a private message. I'm happy to assist anyone interested, with no charge or obligation.
My Previous Analysis
🐶 DOGEUSDT.P: Next Move
🎨 RENDERUSDT.P: Opportunity of the Month
💎 ETHUSDT.P: Where to Retrace
🟢 BNBUSDT.P: Potential Surge
📊 BTC Dominance: Reaction Zone
🌊 WAVESUSDT.P: Demand Zone Potential
🟣 UNIUSDT.P: Long-Term Trade
🔵 XRPUSDT.P: Entry Zones
🔗 LINKUSDT.P: Follow The River
📈 BTCUSDT.P: Two Key Demand Zones
🟩 POLUSDT: Bullish Momentum
🌟 PENDLEUSDT.P: Where Opportunity Meets Precision
🔥 BTCUSDT.P: Liquidation of Highly Leveraged Longs
🌊 SOLUSDT.P: SOL's Dip - Your Opportunity
🐸 1000PEPEUSDT.P: Prime Bounce Zone Unlocked
🚀 ETHUSDT.P: Set to Explode - Don't Miss This Game Changer
🤖 IQUSDT: Smart Plan
⚡️ PONDUSDT: A Trade Not Taken Is Better Than a Losing One
💼 STMXUSDT: 2 Buying Areas
🐢 TURBOUSDT: Buy Zones and Buyer Presence
🌍 ICPUSDT.P: Massive Upside Potential | Check the Trade Update For Seeing Results
🟠 IDEXUSDT: Spot Buy Area | %26 Profit if You Trade with MSB
📌 USUALUSDT: Buyers Are Active + %70 Profit in Total
🌟 FORTHUSDT: Sniper Entry +%26 Reaction
I stopped adding to the list because it's kinda tiring to add 5-10 charts in every move but you can check my profile and see that it goes on..

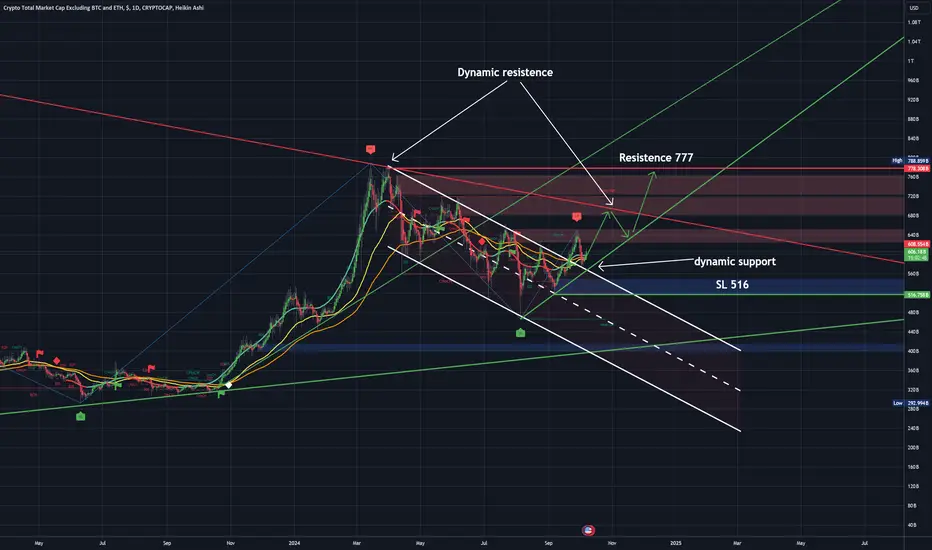
From Decline to Opportunity: Total3 Poised for RecoveryAfter breaking below the critical $1.04T support level yesterday, Total3 experienced a sharp decline, finding its footing at a key horizontal support level.
This drop coincided with many altcoins also reaching their respective support zones. For traders, this presented an attractive opportunity to enter the market at more favorable prices, effectively halting the downward momentum.
Currently, the chart shows a promising reversal forming. As long as this horizontal support level holds, there is a strong likelihood of continued upward movement, potentially paving the way for a new all-time high.

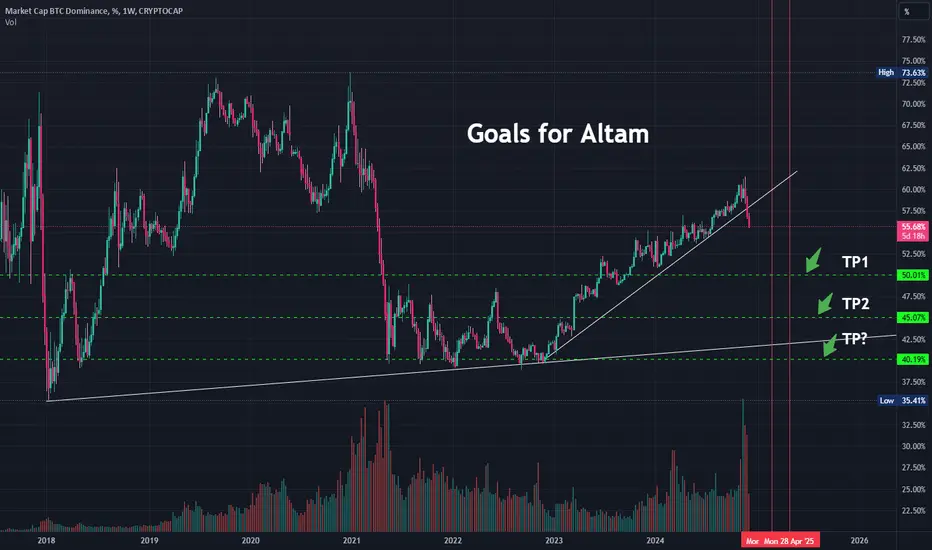
ALTSEASON This is why you shouldn't delay buying alts any more!Our last Altseason call was exactly two months ago (October 18, see chart below) which turned out to be the exact level that the new rally of the total crypto market cap (excluding top 10) started:
As you can see, the current Cycle (2022 - 2025) displays incredible resemblances with the 2014 - 2017 period. Their Accumulation Phases during the transition from the Bear Cycle to the Bull are very similar, with the Pivot trend-line initially acting as Resistance and then turning into Support on the first Bull Flag formation. That was the pattern that pulled back to the 0.382 Fibonacci retracement level, tested and held the 2W MA50 (blue trend-line) as Support, which was what gave us our accurate buy call 2 months ago.
Even the RSI and MACD fractals between the two Cycles are identical, with the RSI bottoming on the exact same pattern and the MACD forming a Bearish-into-Bullish-Cross pattern while the market was forming the Bull Flag.
Right now we've entered the Parabolic Rally phase (green Channel Up), where the market should continue to rise without major pull-backs towards the -1.5 Fibonacci extension level. Besides that level, what signaled the market top in January 2018 was the RSI forming a Triple Top and the MACD forming its 3rd Bearish Cross. Use those as additional indicators for exiting with huge profit.
-------------------------------------------------------------------------------
** Please LIKE 👍, FOLLOW ✅, SHARE 🙌 and COMMENT ✍ if you enjoy this idea! Also share your ideas and charts in the comments section below! This is best way to keep it relevant, support us, keep the content here free and allow the idea to reach as many people as possible. **
-------------------------------------------------------------------------------
💸💸💸💸💸💸
👇 👇 👇 👇 👇 👇

USDT Dominance Reversal: Key Levels for Altcoin Long SetupUSDT Dominance (USDT.D) is showing signs of a potential reversal after an extended uptrend, which could provide a significant opportunity for altcoins.
I’m watching the 618 and 786 Fibonacci retracement levels, as well as a down-sloping trendline in the same area. If USDT.D tests and rejects these levels, we’ll likely see a downtrend, which historically leads to a rise in altcoins.
Additionally, an inverse Fair Value Gap (FVG) has appeared, confirming the bearish scenario. Once all confirmations are in place on the 4-hour chart, we will look to long altcoins carefully, using leverage while staying disciplined.
Risk Management: Max risk is 5% per trade, aiming for at least a 5x reward. Leverage will be used cautiously, with a focus on emotional control to avoid fear and greed.

XRP’s Next Move: Can We Reach $2.80 and Beyond?Picture yourself on a calm evening, sitting by the window with a warm drink in hand. The day feels steady, yet there’s a sense of anticipation—you know something’s brewing. That’s where XRP is right now, inching closer to $2.80, a key level that could change the game.
If it breaks through, there’s room to climb—$3.18, $3.70, maybe even further. But if it doesn’t hold, the market might take a step back, correcting to $2.50-$2.40, or even slipping down toward $1.52 if the momentum shifts. It’s one of those moments where patience and focus matter most.
You can feel the energy in the market, a mixture of excitement and uncertainty. It’s like standing on the edge of something big, knowing it could go either way. But you’re not here to rush or panic. You’re here to watch, to analyze, to make your move when the time is right. Because trading, like life, rewards those who stay grounded in the moment.
Wellness Tip: When things feel uncertain, take a pause. Stand up, stretch, and take five slow, deep breaths. Remind yourself that every move in the market is part of a bigger picture—and you’re in control of how you respond. A calm, clear mind always makes the best decisions. 🌿✨
Trade What You See
Kris/ Mindbloome Exchange

Morpho/UsdtOKX:MORPHOUSDT
📉 **Price Rejection at 2.800**
The price of **Morpho Coin** ($2.2148) was rejected at a **previous resistance level** of $2.800, which means it couldn't break past that level and moved back down. This is an important point for traders, as the price struggled to go higher, and now we're seeing it at a lower price.
🛑 **Support Levels**
The **support levels** are areas where the price might find buying interest and potentially reverse upwards. For Morpho Coin, the support levels to watch are:
- **$1.7634** 📉
- **$1.3456** 🔽
If the price continues to decline, these are key levels where the price may stabilize or bounce back.
🚀 **Long Position Potential**
For a **long position** (buying), many traders would look for the price to test the support levels like **$1.7634** or **$1.3456**, hoping for a price reversal and aiming to profit if the price goes back up. It's important to wait for confirmation of a bounce off these levels to minimize risk.
Keep in mind, this is a **technical analysis** explanation and not financial advice! Always do your own research and consider market conditions.

WARNING ------This Coin Can 10x MartyBoots here , I have been trading for 17 years and sharing my thoughts on ARKAM here.
ARKAM is looking beautiful , very strong chart for more upside
Very similar to SOL which 15x from this level
Do not miss out on ARKAM as this is a great opportunity
Watch video for more details

Expecting the Peak of Altcoin Season Starts in Q1 Hello,
Based on historical trends, I've observed that January and February are typically bullish months in the cryptocurrency market. During past bull runs, like 2021, altcoins often outperformed Bitcoin, driven by increased retail and institutional investment in smaller-cap cryptocurrencies. I anticipate that the peak of the altcoin season will likely begin in Q1 of the upcoming year.

TOTAL3: alt seaon is coming soonIt looks like the MACD is about to cross on the 1W time frame, signaling the potential start of an altseason soon.
The chart speaks for itself.

#ALTCOINS Season is commingwe are in a strong resistance for #BTC_DOMINANCE so we have to expect reversal from here
& If this happened means.......
1. we are in #altcoins bottoms
2. #altcoins season is coming so soon
3.it is the right time to invest in #altcoins not #BTC
*********** This is my expectation for next weeks **********
******( MAY BE I AM COMLETELY WRONG, PLEASE DO YOUR OWN PLANS ) *******
CRYPTOCAP:BTC.D
CRYPTOCAP:BTC
CRYPTOCAP:ETH
#BTCUSDT
#bitcoin
#BTC
#BTCUSDT
#BTCUSD
#BTCETH
#ETH
#ETHUSDT
#ETHBTC
#ETHUSD
#trade
#trading
#longterminvestment
#Cryptotading
#cryptoinvesting
#investment
##trading
#cryptocurrencytrading
#bitcoininvestments
#Investing_Coins
#Investingcoins
#Crypto_investing
#Cryptoinvesting

OP Building A Powerful Bottoming Structure MartyBoots here , I have been trading for 17 years and sharing my thoughts on OP .
OP looks great , its currently building a giant broadening wedge pattern and this looks like it should hold targeting the top range
Its getting into a very important time for these ALTs and they should start running bottoming for a move up into new year

#AI, $AI, #AIUSDT, AIUSD#AI ...... is in a very nice entry point and near stop loss to get high profit
#AI
NYSE:AI
#AIUSDT
#AIUSD
#swingtrade
#shortterminvestment
#ALTCOIN
#Cryptotading
#cryptoinvesting
#investment
##trading
#cryptocurrencytrading
#bitcoininvestments
#Investing_Coins
#Investingcoins
#Crypto_investing
#Cryptoinvesting
#bitcoin
#BTC
#BTCUSDT
BINANCE:AIUSDT

TOTAL 3 - 1D - Broke the flag to the upsideTOTAL 3 - 1D
This index takes the TOTAL of the value invested in crypto discarding the weight of BTC and ETH.
At the moment, TOTAL 3 has strong bullish signals because it has broken the flag at the top and has just made support without re-entering to return to the bullish path.
At the moment, it is much more interesting to be positioned in these values: SOLANA, TON, TRX, DOGE, ADA, BNB, XRP...
Since its bullish technical aspect would already be confirmed.
As always, this position is interesting as long as the SLs are not lost.
All these strategic alternatives can be configured with TradeX BoT, since it will allow you to position in both directions without having to block any amount per position. It will only be necessary for the conditions to be met, either downwards or upwards, for the orders to be executed in one direction or the other, taking the necessary deposits from your wallet.
TradeX BoT (in development): Tool to automate trading strategies designed in TradingView. It works with both indicators and graphic design tools: parallel channels, trend lines, supports, resistances... It allows you to easily establish SL (%), TP (%), SL Trailing... multiple strategies in different values, simultaneous BUY-SELL orders, conditional orders.
This tool is in the development process and the BETA will soon be ready for testing.
FOLLOW ME and I will keep you informed of the progress we make.
I share with you my technical analysis assessments on certain stocks that I follow as part of the strategies I design for my portfolio, but I do not recommend anyone to operate based on these indicators. Get informed, train yourself and build your own strategies when it comes to investing. I only hope that my comments help you on your own path :)
#ALT (SPOT) entry range ( 0.07 - 0.077) T.(0.3499) SL (0.0665)BINANCE:ALTUSDT
entry range ( 0.07 - 0.077)
Target1 (0.1530) - Target2 (0.2690) - Target3 (0.3499)
SL .1D close below (0.0665)
**** This trade is short time investment with low risk and very high reward ****
**** #Manta ,#OMNI, #DYM, #AI, #IO, #XAI , #ACE #NFP #RAD #WLD #ORDI #BLUR #SUI #Voxel #AEVO #VITE #APE #RDNT #FLUX #NMR #VANRY #TRB #HBAR #DGB #XEC #ERN #ALT ****

ALT Coins are building pressure before next big move MartyBoots here , I have been trading for 17 years and sharing my thoughts on the market.
ALT Coins are building pressure before the next big move

WARNING ------- ALT SEASON IS STARTINGMartyBoots here , I have been trading for 17 years and sharing my views with the crypto community.
WARNING - Do NOT miss this opportunity
These Charts show ALT SEASON is STARTING just like it did last time

Shiba FRACTAL : FEB 2024 - 330% in 2 WEEKSBINANCE:SHIBUSDT
Many altcoins are currently in Accumulation Phase. This is the part of the cycle where there seems to be very little action, and the price moves in a range and sideways. It's safe to say that we can expect sideways/range trading until BTC moves the market. In a previous update, I mentioned how BTC loves Decembers:
The good news, is that this makes for an excellent time to BUY back into any market. The lowest risk option here would require some patience though, because the accumulation cycle often lasts month. Luckily - we are already a month in of mostly range trading.
Here's a look at SHIBA's best buy zones in more detail, as well as other altcoins that are in or approaching the ideal buy zone:
