AMAT - Clear BreakoutWith all chip stocks running, AMAT has given the breakout prior to the Earnings. Can it sustain and move higher?
AMAT

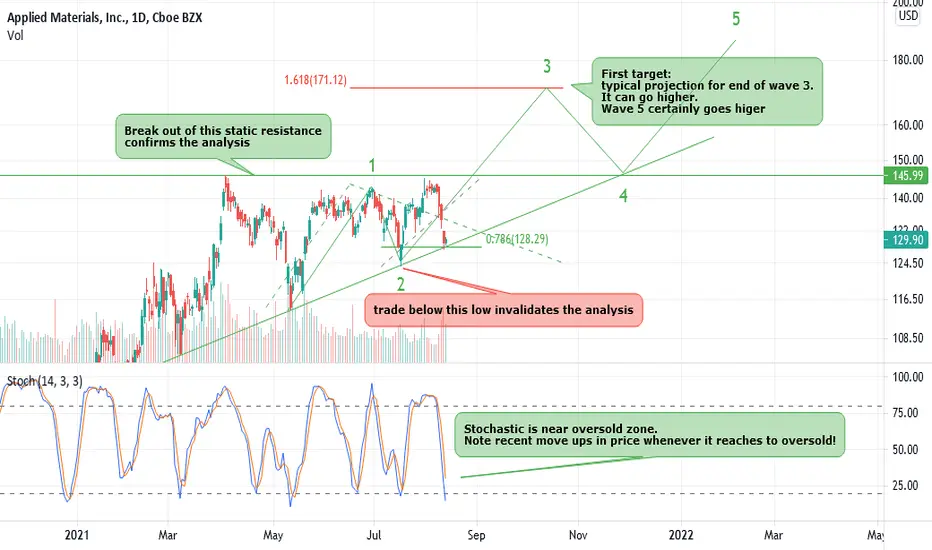
AMAT, Long in the case of bullish reaction ! A new ATH ?Is AMAT going to show a bullish reaction to the strong support and make a new All Time High? Lets follow!
Price is clearly around dynamic short term trend line support . This is fourth time that price reaches to this support. Last three times it could push up the price successfully. Moreover, price is now exactly at 0.786 Retracement of last move up.
Stochastic indicator is near oversold zone. Please note that we had a nice move up whenever it has recently reached to this area.
In terms of Elliott waves , We may be at the start of wave 3 of 3. Possible wave count has been shown on the chart. If true, first target will be around 170 USD which corresponds to 1.618 projection of labeled wave 1. It may go higher. We can update it later. Wave 5 will certainly goes above 170 !.
Please notice the notes on the chart about the conditions which confirms or invalidates this analysis.
Although all evidences show that it is ready to make a new move up, we have to trade objectively. We set out stop loss carefully ( which is the last low shown on the chart) in the case of opening a long position.
We try to see the chances and find ideal setups but we always keep in mind that market is the one who choose the path and we are the one to follow. That is why I chose this title : " Long in the case of bullish reaction! "
Good luck my friends.
AMAT - BEARISH
ENTRY: On break below $128
SL: 136.60
PT 1 (trim level: Trim 50-70% here) - $115-$118
PT 2 (Closing position here) $100.75 - $105
Rectangle top and Major Wave 3 hitting 262% extension level. Needs much larger correction here on Wave 4. Most will this is a bull flag and it is, but based on 262% extension level, I favor a pull back here in wave 4 into green box area before new ATH's.

Key Ideas to trade big daily structures. Example on AMATI will keep this post short, so you can get a general idea of this trading style.
First of all , we have a situation where the price could not make a new ATH in 200 days. It's important to notice that we can draw a clear structure with well-defined limits because the price stayed in a clear range between 146 and 114
Now that the structure is clear, it is easy to know if we are observing a clear breakout or a fakeout, thanks to the limits we have drawn and the way the price has respected them.
So, how to proceed now? We ask this simple question. How many times can I find a similar situation like this in the past? Imagine we say four times. Ok, which is the sequence where the price goes from being inside the range towards a new bullish impulse?
Here is where technical analysis will help you create a map or sequence of movements to say, "Hey, there is a pattern here that I can wait." Once you have defined that, draw it in your chart.
In this case, my final filters are:
a) Wait for a new ATH (that's the confirmation that the structure has been broken)
b) Wait for a 2 to 4 weeks correction (that means that after the breakout, the price is not able to make a new ATH)
c) IF that happens, trade on the new ATH, with a stop loss below the 2 to 4 weeks correction and Take profit on the final Fibo extension
d) IF that doesn't happen, do not trade
e) Move the stop loss to the entry-level if the price reaches the first Fibo Extension.
f) Risk: We will use 2% of our capital on the stop loss.
g) Relax and Wait.
As you can see, this is a methodic way of developing a setup that provides a lot of control over your executions, and you can proceed based on a pre-established set of rules. This is extremely helpful to overcome emotions and bring consistency to your strategy.
Remember: Do not try to avoid a stop-loss; create procedures to control them. My win rate right now is 55% - 60%. That means that almost half of the time, I'm wrong; HOWEVER, when I'm right, I make more than 2 dollars of every dollar I'm risking. Trade like a casino!
Thanks for reading!

AMAT go ZOOOOOMAMAT is bound for a strong impulsive move
✅ Phase 1: a harsh pullback
✅ Phase 2: a period of consolidation
✅ Phase 3 : an impulsive move to the 0.61 line of the pullback move
❌ Phase 4: another consolidation perdiod: Skipped
✅ Phase 5: a drop to the 0.38 line of the fib retracement
🤩 Phase 6: Back to the top we go

9/26/21 AMATApplied Materials, Inc. (AMAT)
Sector: Producer Manufacturing (Industrial Machinery)
Current Price: $141.92
Breakout price trigger: $139.25 (hold above)
Buy Zone (Top/Bottom Range): $140.00-$131.75
Price Target: $146.00-$148.00 (1st), $165.50-$169.00 (2nd)
Estimated Duration to Target: 31-33d (1st), 122-130d (2nd)
Contract of Interest: $AMAT 11/19/21 150c, $AMAT 1/21/21 165c
Trade price as of publish date: $4.40/cnt, $3.25/cnt

short on AMATwe can open a short on it with a good R/R Because the price energy is low and needs some correction

AMAT: Trade the wedgeAMAT (swing): (In the process of filling the gap on the down)
~Watch the support zone 135.40-136.50 for a bounce to PT1: 138 / PT2: 140 / PT3: 144
~Monday may see a dip to 133-ish area, if support doesn't hold. I would buy calls at 133. (Price likely will recover 2 bucks after the pullback)
~We are still trading in a missive looking wedge and probably will be for at least another month. Take advantage of using the zone inside the wedge for the time being to make swings. (there is at least 10 bucks between the support and resistance line.)

AMAT with upside 10%AMAT looks bullish, we can expect an exit from the triangle on volumes in the coming months.
take 1: 146$
take 2: 149$
stop-loss: 123-125$

Watchlist AMAT for a possible call: with TAOverall idea: If AMAT breaks 133.51, calls with a PT to 141.50 will be a go. (SL at 129.90)
TA:
~Accumulation/Distribution line is sharply increasing, foreshadowing a strong incoming bull action
~MACD has just crossed over into the positive, hinting at upcoming bull action
~VI is at an intersection point, foreshadowing a reversal in momentum from its previous bear action
~RSI is at 50, giving it room to go either direction without much fear of being overbought/oversold
~ so far there have been two rejections of the 50 EMA since August 10. We are rapidly approaching a third test of this 50 EMA, which is also at the point where AMAT would need to go to break resistance. Put the two together, if 133.51 is broken, we not only would see a break of resistance, but also a cross over the 50 ema after a bounce off the long term support line.
Also want to point out the obvious: the wedge that is forming long time frame.

AMAT needs to get back over trendlineI think AMAT can get a quick pop to reclaim the trendline. Once AMAT is back on top of trendline we could get a breakout over resistance and make a run.

TrendyTrades: AMAT AnalysisBullish Harami, bottom of channel, bullish trendline bounce, gap fill above. Gap fill can be used for PT.

AMAT BUY OR LONG, TARGET $170AMAT today completely broke out a " Symmetrical triangle " pattern with target move to $170 and
you need to secure a reasonable stop loss with your idea, I recommend 5% stop loss.


SOXL - Semi's may go again? Looking at $SOXL we can see a daily close above $41.85 can usher in $43.39 this week. Would be a monster trade for $LRCX going into earnings if $SOXL is moving like it can. Possible to see $LRCX at $700 by earnings date.

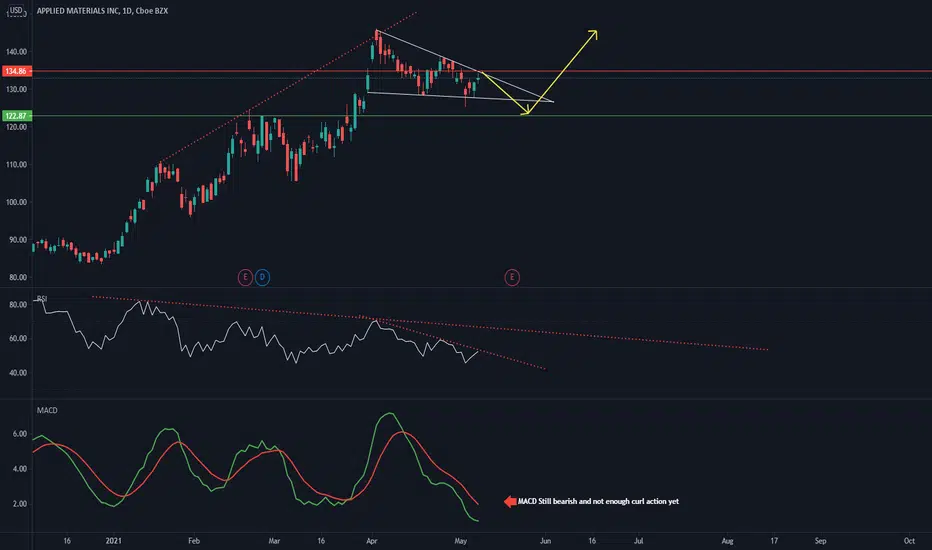
AMAT - Head fake, back down towards 124See chart attached - AMAT has reached the top of the falling wedge and in my opinion is not close enough to the apex and I would like to see a 3rd touch towards the bottom of this pattern.
SMH about to breakoutSMH (the Geek) was resting in the small 4 day week moving laterally but was ready to breakdown on Thursday. But the jobs numbers on Friday being moderately light vs expectations made one more month of positive news for the market signaling "transitory" inflation. That was the turning point as mentioned in my last weeks report. An engulfing candle on Friday and an uptrend MACD makes this extremely bullish. After Fridays action, I see Geek moving higher as 3/4 of the stocks in the group got pummeled way under 21 day ema. This put those stocks this coming week trading above 8 day ema at least. Its possible that it can rest here for a couple of days as well.

$AAPL $PDD $BABA $AMAT I OptionsSwing WatchlistPDD 4H I Breakout from massive downtrend with volume. Cathie Woods was adding shares back in March. PDD has to hold the $130 level for continuation and the price target is $150 before next ER.
AAPL 1D I Held the bullish uptrend established back in September. Unusual options activity was bullish and they bet on a retest of $128 this upcoming week.
AMAT 1H I Testing ATH levels, above $140 it could get some more traction. Amid the current chip shortage AMAT is one of the companies that is tasked with helping the industry catch up.
BABA 1D I Massive falling wedge pattern which could break to the upside before earnings on 08/19. The Chinese giant is more than 30% down from ATH levels. However, there is some sense of renewed hope in the company as US investor Charlie Munger recently disclosed a sizable stake in the company.

AMAT - Not enough room to climbFundamental analysis may not always show what technical analysis shows...
AMAT - From Deep pit to new heightsChip companies have recently experienced high volatility - but this seems to be the latest low. On Belay!
AMD will not disappoint, 93.75 TGTAs I previously mentioned on my SQ analysis, Semis have been hit hard regardless of great earnings. With semis currently oversold, I see semis run up for the next two weeks along with the likes of AMAT, TSM, QCOM, NVDA, ON, and IIVI. AMD beat earnings and has been taking INTC customers for the past 2 years. INTC is in panic mode trying to regain back their market share. AMD server/pc chips are faster and much reliable and cheaper. Semi shortages is an issue but with current earnings handily beat expectations, I don't see this as an issue moving forward as demand outweighs shortages. See EBAY, StockX, and FB markets for GPUs and CPUs. People still buy them at over 200% retail. China, Taiwan, US coming out of Covid pandemic, ramps up chip production in Q2. A bullish Doji on Friday with good volume. Shorts will get squeezed out at 83.52.


AMAT LongAMAT has been stair-stepping higher in a bull trend lately. In my opinion AMAT has been a leader in one of the stronger industry groups within tech (semiconductor equipment). Yesterday it printed an inverted hammer after failing to make a significant push below the previous low on 4/19. This is the line in the sand. Today it opened near those lows but pushed higher and out of the short-term downtrend on impressive volume. It has consistently found buyers at the 20-day EMA (see arrows) - this area has regularly been a great spot to initiate a long. Today represents a low-risk entry with a stop at the previous day's low (red dotted line).
