Amazon - Break And RetestHello Traders, welcome to today's analysis of Amazon.
--------
Explanation of my video analysis:
In 2020 Amazon created a beautiful triangle breakout which was followed by a +75% rally and then a -50% correction. After the correction was over, Amazon perfectly retested a confluence of support and reversed aggressively towards the upside. Considering that Amazon just rallied 100%, I am now just waiting for a retest of the structure mentioned in the analysis.
--------
I will only take a trade if all the rules of my strategy are satisfied.
Let me know in the comment section below if you have any questions.
Keep your long term vision.
Amazon

AMAZONPair : Amazon AMZN
Description :
Bullish Channel as an Corrective Pattern in Long Time Frame
RSI - Divergence
Break of Structure
Bearish Channel in Short Time Frame and Rejection from Lower Trend Line
Completed " 123 " Impulsive Waves

Bullish on AMAZONAmazon ready to print some dollars for the bulls
NASDAQ:AMZN has crossed over and retested the $147 resistance turned support price.
We are in an uptrend and have a strong bullish momentum.
Position Set - 2 ITM contracts XETR:AMZ 3/4/2024 Call $145

EURUSD KEEP FOLLOWING BULL MOVE LONG TERM The EUR/USD currency pair has been making waves recently, and it’s currently dancing around the 1.1150 mark. Here’s what you need to know:
Recent Highs: The pair has been on a bullish streak, reaching its highest level since March 2022 after convincingly breaking above the 1.1100 mark. Bulls are flexing their muscles, and the euro is strutting its stuff against the US dollar 1.
US Dollar Weakness: The greenback has been feeling a bit under the weather. The latest US inflation data showed signs of easing inflationary pressure, causing the US Dollar Index (DXY) to hit its lowest point since April 2022, hovering just above the 100.50 area. Odds of further rate hikes by year-end have also declined significantly 1.
ECB’s Hawkish Stance: Across the pond, the European Central Bank (ECB) remains hawkish. Persistent inflationary pressure in the euro area is pushing them to consider raising policy rates by a quarter percentage point later this month 1.
Upcoming Data: Keep an eye out for more US inflation data. The Producer Price Index (PPI) is estimated to drop from 6.6% to 6.1% annually, while the core figure is expected to decline from 5.3% to 4.8%. Additionally, the ECB will release the minutes of its latest meeting 1.
Technical Levels to Watch
Resistance: The immediate resistance lies near 1.1150.
Support: On the downside, watch out for the previous daily low at 1.1005.
Psychological Levels: The psychological levels of 1.1100 and 1.1200 are crucial battlegrounds

NIO BACK TO 10 BY 2025 !!NIO’s stock has potential for growth in the coming years due to several factors:
Analyst Predictions: The 8 analysts with 12-month price forecasts for NIO Inc. stock have an average target of 11.31, predicting an increase of 95.67% from the current stock price1.
Earnings and Revenue Growth: NIO is forecasted to grow earnings and revenue by 55.5% and 22.4% per annum respectively2.
Competitive Positioning: NIO is a significant player in the electric vehicle market, which is expected to grow rapidly in the coming years. It has been able to position itself as a strong competitor, even causing disruptions for established players like Tesla

✅AMAZON SWING SHORT FROM SUPPLY AREA🔥
✅AMAZON is going up now
But a strong resistance level is ahead at 188.09
Thus I am expecting a pullback
And a move down towards the target at 167.44
SHORT🔥
✅Like and subscribe to never miss a new idea!✅

AMAZON Resistance Ahead! Sell!
Hello,Traders!
AMAZON is trading in an
Uptrend but is locally
Oversold and as the
Stock will soon retest
A horizontal resistance of 188.31$
It is likely that we will see
A local bearish correction
Sell!
Like, comment and subscribe to help us grow!
Check out other forecasts below too!

AMZN Amazon will Break All Time Highs this DecadeA sure bet. 100%. Refinance your house. Sell your business. Put it all into AMZN and double yous money in a couple years as Amazon's economic moat continues to widen.
If it doesn't happen forget I said anything.

SALESFORCE 310 AFTER EARNINGS Strong Revenue Growth: Salesforce’s total revenue for Q2 2024 was $8.603 billion, up from $8.247 billion in Q1 20241. This consistent growth in revenue is a positive sign.
Impressive Earnings Per Share (EPS): The basic earnings per share (EPS) for Q2 2024 was $1.4118, up from $0.7562 in Q1 20241. This significant increase in EPS indicates a strong financial performance.
Positive Analyst Expectations: Analysts expect the company to report earnings of $2.27 per share on revenue of $9.2 billion2. If Salesforce meets or exceeds these expectations in their upcoming earnings report, it could provide a further boost to the stock.
Historical Stock Performance: The stock soared 12% after its last earnings report3, which could indicate investor confidence in the company’s financial health and future prospects.

Jeff Bezos Sells Another $2.4B in Amazon StockAccording to a new regulatory filing, Amazon founder Jeff Bezos sold more than 14 million shares over the past few days worth around $2.4 billion, completing his stock sale plan.
Bezos adopted a trading plan Nov. 8 to sell up to 50 million Amazon ( NASDAQ:AMZN ) shares — valued at more than $8 billion — during a period ending in January 2025.
He first sold 12 million shares earlier this month, worth more than $2 billion, and then sold separate 12 million share tranches through February. It’s Bezos’ first sale of the company’s stock since 2021.
Amazon’s stock closed at more than $167 per share on Tuesday. Shares are up more than 76% over the past 12 months.
Bezos controlled about 12.3% of the company’s outstanding stock as of a February 2023 proxy filing, including shares he fully owns and shares owned by his ex-wife, MacKenzie Scott, over which he still has voting rights. He now controls about 11.8% of the company’s stock.
Amazon’s ( NASDAQ:AMZN ) annual filing showed that the trading plan was adopted six days after Bezos said on Instagram, on Nov. 2, that he was leaving Seattle and making Miami his official residence.
Washington state’s capital gains tax, passed in 2021, imposes a 7% tax on any gains of more than $250,000 from the sale of stocks and bonds, with some exceptions. By making Miami his home, Bezos stands to save around $600 million in tax expenses after selling 50 million shares under the plan. Florida does not have a capital gains tax. Like Washington state, Florida also does not have an income tax.
Bezos launched a $2 billion Bezos Day One Fund in 2018 that focuses on homeless families and preschool education. The Bezos Earth Fund, launched in 2020, is putting $10 billion toward climate initiatives.

The continuation of the bull market on AmazonDear Friends,
I hope this message finds you well and that you're having a great start to the week. I wish you success in your business endeavors.
As someone interested in the Elliott Wave principle, I find it a valuable tool for analyzing the market. I have developed my approach by combining this principle with my personal experience and by considering various scenarios that are likely to occur in the market.
I am sharing my analysis with you, but please note that I am not providing any buy or sell signals. I aim to share my unbiased analysis with you so that you can use it as a guide to make informed decisions.
In the attachment, you will find my previous analysis of the same market, so you can compare and see the differences. All the details of my analysis are clearly labeled, making it easy for you to understand (although having a basic familiarity with the Elliott Wave Principle theory will help you understand the analytical idea more easily).
I have been studying the Elliott Wave principle for almost three years now. With time, my understanding of this knowledge and experience has increased. What I have achieved so far is a legacy of a genius named Ralph Nelson Elliott, and I am truly satisfied with my progress. May his soul rest in peace and his memory be cherished.
Thank you for your support so far. I am grateful and will always remember your kindness. Please feel free to share your thoughts and feedback with me.
I hope my analysis will be useful to you in your business journey, and I wish you all the best.
Sincerely,

AMAZON -15% dip possible. Take advantage of it.It has been 3 months (Nov 17 2023, see chart below) since our last buy trade on Amazon (AMZN), which hit both Targets:
February opened with a big gap upwards and the stock has been consolidating ever since. This consolidation, along with the completion of a 1D MACD Bearish Cross last week, is indicative of a top formation. In fact it is similar with the starting sequence of the last Higher High (September 14 2023) of the 1-year Channel Up.
The first pull-back/ technical correction of this pattern was a -22.61% decline and the second -18.83%. If the corrections are on a -4% progression, we can assume a -14.60% decline this time. That falls marginally below the 0.382 Fibonacci retracement level (assuming the 2.0 Fib extension from the October 26 2023 bottom will be the peak).
As a result, we are expecting $155.00 as a fair pull-back currently and buy entry for the long-term. A break below the 1D MA50 (blue trend-line), will be the technical confirmation of the sell signal.
-------------------------------------------------------------------------------
** Please LIKE 👍, FOLLOW ✅, SHARE 🙌 and COMMENT ✍ if you enjoy this idea! Also share your ideas and charts in the comments section below! This is best way to keep it relevant, support us, keep the content here free and allow the idea to reach as many people as possible. **
-------------------------------------------------------------------------------
💸💸💸💸💸💸
👇 👇 👇 👇 👇 👇

$AMZN Momentum IndicatorNASDAQ:AMZN Momentum Indicator, strong uptrend conditions. A momentum indicator is a technical analysis tool used to measure the rate at which the price of a security is changing. It compares the current price of an asset to its price at a previous point in time, typically over a specified period. This comparison helps traders and investors gauge the strength and direction of price movements. Momentum indicators are often used to identify potential trend reversals, confirm the strength of an existing trend, or generate buy and sell signals. Examples of popular momentum indicators include the Relative Strength Index (RSI), Moving Average Convergence Divergence (MACD), and Stochastic Oscillator.

NVIDIA 800 After earnings !NVIDIA’s recent earnings report has given investors several reasons to be optimistic about the company’s future. Here are some key takeaways:
Record Revenue Growth
NVIDIA reported a record revenue of $18.12 billion for the third quarter ended October 29, 20231. This is a significant increase of 206% from a year ago1. Such strong revenue growth is a positive sign and could potentially drive the stock price higher.
Data Center Revenue
The data center segment, which offers cloud and AI services, reached a record high of $14.51 billion in revenue in the third quarter1. This segment’s performance is crucial as it represents a significant portion of NVIDIA’s business. Continued growth in this area could further boost investor confidence.
Artificial Intelligence (AI) Boom
NVIDIA is benefiting significantly from the artificial intelligence (AI) boom2. The demand for AI chips is surging, and NVIDIA, being a leading player in this space, stands to gain immensely. This trend is expected to continue, providing a solid growth trajectory for the company.
Analysts’ Expectations
Analysts expect NVIDIA’s revenue to more than triple from the same period a year ago2. They anticipate NVIDIA’s revenue could reach $20.38 billion for the final quarter of fiscal 20242. If NVIDIA meets or exceeds these expectations, it could result in a bullish sentiment among investors.
Custom Chip Unit Plans
Reports suggest that NVIDIA is planning to launch a new business unit focused on custom chips2. This move could help NVIDIA capture a piece of the growing custom chip market and reinforce its position as the world’s most valuable chip company amid the AI boom2.
In conclusion, NVIDIA’s strong financial performance, growth in its data center business, benefits from the AI boom, and strategic plans for expansion all contribute to a bullish outlook for the company post-earnings.

#AMZN Forming a head & shoulders on the dailyLooks to me like amazon is trying to form this mini Head and shoulders top. Should the neckline at $167.50 break, the target pretty much takes you to the gap close level at $160.00 which is where we gapped from recent results. Recent reports that Jeff Bezos has sold up to $6bn of stock in amazon could sour sentiment slightly on the stock. We also had some bad retail sales for January in the US which could be seen as another negative for the stock.Also note how the MACD is about to roll over here. Aggressive traders could look to pre-empt this and short the right shoulder between 170-171 using a stop loss as a move above 172.50. More conservative traders to look for the break of the neckline at $167.50 in order to enter. Target to the gap at $160.00

AMZN to $1881HR Chart
Amazon ( NASDAQ:AMZN ) has developed a bullish flagpole formation that is more easily seen on the hourly charts. This may serve as a continuation pattern that will launch AMZN to a 52 week high of $188 -- a level that hasn't been tested since July of 2021. Fibonacci retracement levels for the current trading pattern support the $188 ceiling as this value rests near the 168.1% level.
On-Balance Volume (OBV) has a positive slope which suggests that bullish investors are outpacing the bears. I also recently began using the Relative Strength Index (RSI) and Moving Average Convergence/Divergence (MACD) indicators. While my experience with RSI and MACD is limited, the RSI appears to be approaching a bearish crossover before the MACD crosses above its signal line. I interpret this as a possible correction to the pennant support line (the 4th leg) with a near immediate recovery.
1D Chart
A share price in the $180s should be carefully watched as this level has been a significant area of resistance in the past. As tempted as I am to suggest it may be forming a double top, the middle trough dipped too low and it appears that AMZN may be trading in a horizontal channel. If AMZN surpasses the $188 price ceiling with significant volume then a 12 month price target of $250 is pragmatic. Should the opposite occur then a 12 month target of $80 could also be expected.

Jeff Bezos' $2 Billion Amazon Stock Sell-Off: What Does It Mean?Amazon.com's ( NASDAQ:AMZN ) iconic founder Jeff Bezos recently offloaded approximately 12 million shares of the tech behemoth, amassing a staggering $2 billion in the process. This significant divestiture, disclosed in a regulatory filing last Friday, marks the commencement of a meticulously planned sell-off strategy laid out by Bezos himself, raising eyebrows and prompting speculation about the future trajectory of both the company and its visionary leader.
The timing of Bezos' share sale, strategically spread over two days—Wednesday and Thursday of last week—coincided with Amazon's ( NASDAQ:AMZN ) announcement regarding his intention to part ways with up to 50 million shares in the firm. This calculated move underscores Bezos' commitment to diversification and risk management, while also fueling conjecture regarding his long-term strategic vision for Amazon ( NASDAQ:AMZN ).
According to Amazon's latest annual report, the sale plan was initiated on November 8, 2023, with a stipulated completion date of January 31, 2025, subject to certain conditions. This meticulous planning highlights Bezos' astute financial acumen and his proactive approach to wealth management, ensuring a smooth transition of assets while maintaining his position as a key stakeholder in the company he famously founded as an online bookseller in 1994.
Bezos, who relinquished the reins of Amazon's day-to-day operations in 2021, assuming the role of executive chairman, continues to wield considerable influence within the organization. With a net worth exceeding a staggering $200 billion, as per the Bloomberg Billionaires Index, Bezos remains an indomitable force in the global business landscape, shaping Amazon's strategic direction and cementing his legacy as one of the world's foremost entrepreneurs.
Despite Bezos' unprecedented success and unwavering confidence in Amazon's prospects, his decision to liquidate a substantial portion of his holdings raises pertinent questions about the company's growth trajectory and the broader e-commerce landscape. As Amazon ( NASDAQ:AMZN ) faces intensifying competition and regulatory scrutiny, Bezos' strategic maneuvering serves as a litmus test for investor sentiment and market dynamics in the post-pandemic era.
While Bezos' stock sell-off may be perceived as a prudent move to diversify his investment portfolio and mitigate risk, it also underscores the evolving nature of his relationship with Amazon ( NASDAQ:AMZN )—a company he nurtured from its humble beginnings into a global juggernaut. As Bezos charts a new course in his entrepreneurial journey, navigating uncharted waters and exploring new opportunities, the Amazon ( NASDAQ:AMZN ) faithful await with bated breath, eager to witness the next chapter in the company's storied evolution.
In conclusion, Jeff Bezos' $2 billion Amazon ( NASDAQ:AMZN ) stock sell-off symbolizes a pivotal moment in the company's history, emblematic of its founder's strategic foresight and unwavering commitment to long-term success. As Bezos redefines his role within Amazon ( NASDAQ:AMZN ) and embarks on new ventures, the legacy of innovation and disruption he leaves behind serves as a testament to his enduring legacy as a visionary leader in the digital age.

Spanish High Court Suspends Fine on Amazon and Apple Spanish High Court has decided to suspend fines totaling 194 million euros imposed on tech giants Amazon ( NASDAQ:AMZN ) and Apple ( NASDAQ:AAPL ). The fines, initially levied by the Spanish antitrust watchdog CNMC (Comisión Nacional de los Mercados y la Competencia) in July, are now pending appeal, marking a temporary halt to what has been a contentious legal battle.
The fines, amounting to 143.6 million euros for Apple ( NASDAQ:AAPL ) and 50.5 million euros for Amazon ( NASDAQ:AMZN ), were imposed following allegations of collusion between the two companies to restrict competition in the sale of Apple products on Amazon's platform within Spain. CNMC accused the companies of engaging in anti-competitive behavior by preventing third-party retailers from selling Apple products on Amazon's Spanish marketplace.
The Appeal Process: Court Decision Suspends Fines Pending Appeal
Both Amazon ( NASDAQ:AMZN ) and Apple swiftly announced their intentions to appeal the fines when they were first imposed. Now, with the Spanish High Court's decision to suspend the fines, the appeal process can proceed without immediate financial repercussions for the tech giants. An Amazon spokesperson clarified that the suspension of the fine is standard procedure during the appeal process and does not indicate the court's stance on the case.
Contention and Defense: Differing Perspectives on the Allegations
Amazon ( NASDAQ:AMZN ) and Apple have consistently defended their actions, arguing that their collaboration aimed to benefit consumers and enhance the availability of genuine Apple products on Amazon's platform. Amazon asserted that the agreement with Apple led to an increase in discounts on Apple devices, while Apple emphasized its commitment to protecting customers from counterfeit products.
However, CNMC countered these claims, alleging that the agreement between Amazon and Apple contained clauses that stifled competition and limited the presence of third-party retailers selling Apple products on Amazon's platform. The regulator also accused Amazon of restricting the advertising opportunities for Apple's competitors on its website, further exacerbating the anti-competitive effects of the collaboration.
Impact Beyond Spain
While the focus of this case remains on Spain, its implications extend beyond national borders. A similar investigation was initiated in Italy against Amazon ( NASDAQ:AMZN ) and Apple, although it was ultimately dropped. The outcome of the appeal in Spain could set a precedent for future antitrust cases involving tech giants and their business practices across Europe and beyond.
Conclusion:
As the appeal process unfolds, the fate of the antitrust fines against Amazon ( NASDAQ:AMZN ) and Apple remains uncertain. The decision by the Spanish High Court to suspend the fines provides temporary relief for the tech giants, but the ultimate resolution of the case will have far-reaching consequences for competition in the digital marketplace. Until then, both companies await the final verdict, navigating a complex legal landscape shaped by accusations of anti-competitive conduct.

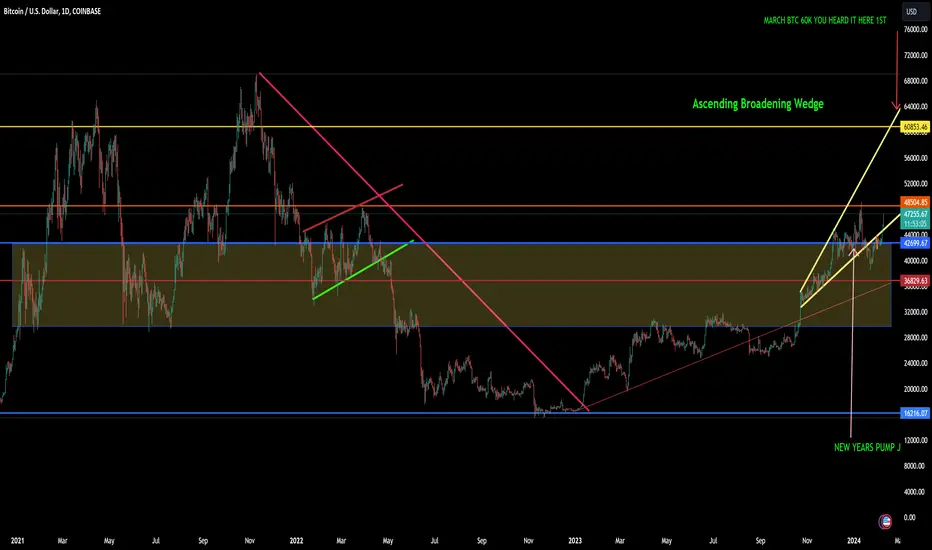
Bitcoin! Back in the mix! COINBASE:BTCUSD AMEX:SPY NASDAQ:MARA Were Back on track folks to March 60K. Now there is so much headroom to move up. My old post was taken down.
Amazon's Strategic Investment in AI: A Path to GrowthAmazon's Strategic Investment in AI: A Path to Growth
As the race for AI dominance intensifies, major tech giants are making substantial investments in AI startups. Amazon, with its vast financial resources, recently committed $4 billion to Anthropic, the creators of AI assistant Claude, in a deal that positions Amazon Web Services (AWS) as Anthropic's primary cloud services provider. The partnership could significantly boost AWS sales, but is Amazon an attractive buy?
Anthropic's Expertise in Generative AI
Anthropic specializes in generative AI, a technology applicable in customer service, AI assistant development, and coding assistance. The company equips clients with a toolkit to craft AI models tailored to their specific needs. With Amazon's investment, Anthropic's data and models will reside on AWS, creating a seamless collaboration between the two companies.
Boosting AWS
This investment could provide a much-needed boost for AWS, which has faced challenges recently, with slower growth rates and declining profitability. As the cloud computing market is projected to grow to $2.4 trillion by 2030, leadership in this sector is crucial.
Strengthening Amazon's AI Position
While Amazon's investment in Anthropic may not be a game-changer, it strengthens Amazon's position in AI, where it lags behind competitors. This $4 billion investment grants Amazon a minority ownership stake in Anthropic and enhances AWS's competitiveness in cloud computing.
AWS's Significance
AWS accounted for 70% of Amazon's operating income in the second quarter, highlighting its importance to the company's profitability. Amazon's transition from a consumer goods-oriented company to a tech-oriented one is evident in its improved gross margins over the past decade.
A Buying Opportunity
Amazon's stock presents an attractive entry point for long-term investors, given its strategic positioning to benefit from AI advancements. If Amazon can restore its high profit margins and invigorate AWS, it has the potential for substantial gains, as the market isn't currently pricing it for perfection.
Please note that this article provides information for general purposes and is not financial advice. Investing in stocks carries risks that individuals should carefully consider before making investment decisions.

Amazon - The New SetupHello Traders, welcome to today's analysis of Amazon.
--------
Explanation of my video analysis:
Starting in 2018 Amazon created a decent bullish triangle continuation pattern and after the breakout Amazon pumped more than +70% towards the upside. Then with the 2022 bear market we saw a quite harsh correction and a perfect retest of previous support. If Amazon now provides a retest of the support mentioned in the analysis, I am looking for more long setups.
--------
I will only take a trade if all the rules of my strategy are satisfied.
Let me know in the comment section below if you have any questions.
Keep your long term vision.

UBER 80 AFTER EARNINGS !! Uber Technologies Inc. (UBER) has seen significant growth in the past year. The ride-hailing and delivery platform’s shares have skyrocketed 111% in the last 12 months1. This return not only far outpaced the broader Nasdaq Composite index, but it also means Uber is now hitting fresh all-time highs1.
Here are some key points to consider for a long position in Uber:
Network Effects: Uber’s business benefits from powerful network effects. The larger Uber gets, the more valuable its services become for all stakeholders2.
Growth Potential: Between Q3 2019 and Q3 2023, gross bookings and revenue increased 114% and 145%, respectively2.
Earnings Forecast: Wall Street analysts expect Uber will release earnings per share of $0.1593. With earnings projections at $9.76 billion, a 5% QoQ increase, and $0.39 earnings per share4.
Market Position: Uber’s network effect protects its competitive position. It would be an extremely difficult task for a new entrant, no matter how well funded, to start a competing ride-hailing or delivery business from scratch

DISNEY BACK TO 95 AFTER EARNINGS Disney, a global entertainment conglomerate, has been facing challenges in recent years. The company’s traditional revenue streams, such as theme parks and movie theaters, have been hit hard by the COVID-19 pandemic1. Furthermore, Disney’s streaming service, Disney+, while successful, is facing stiff competition from other platforms like Netflix, Amazon Prime, and HBO Max1.
Here’s a short idea based on this information:
Short Thesis: Disney’s stock could be overvalued given the challenges it faces. The impact of the pandemic on its traditional businesses and the intense competition in the streaming market could put pressure on its earnings. Therefore, there could be a potential short opportunity.
Key Risks: Disney’s diverse portfolio of assets and strong brand recognition could help it weather these challenges. The success of Disney+ and the potential recovery of its traditional businesses as the pandemic eases could lead to a turnaround in the company’s fortunes.
