AMZN: Bearish setup!!!Amazon, Inc look very interesting to short in weekly timeframe.
So, I love to trade stocks in big timeframe as the big benefit it's the patience and trade in big timeframe we could to earn a lot money in medium to long term and being disciplined.
So, I'm analyzing that Amazon look bearish in weekly timeframe that we could to get benefit trade in bearish trend. Also if you trade in Daily, still bearish. I like to trade stock and crypto in over Day timeframe and also swing trading are the best strategy to do, for me.
So, I'm bearish in Amazon, as the same stock market and cryptocurrencies.
Good luck!!!
Remember,I have another account to trade stock and crypto market, but I have another account just to trade Forex. What we could to get good benefit for our investment.
Amazon

AMZNHELLO GUYS THIS MY IDEA 💡ABOUT GOLD AMZN is nice to see strong volume area....
Where is lot of contract accumulated..
I thing that the Seller from this area will be defend this SHORT position..
and when the price come back to this area, strong SELLER will be push down the market again..
DOWNTREND + Support from the past + Strong volume area is my mainly reason for this short trade..
IF you like my work please like share and follow thanks
TURTLE TRADER 🐢


AMZNHELLO GUYS THIS MY IDEA 💡ABOUT AMZN is nice to see strong volume area....
Where is lot of contract accumulated..
I thing that the buyers from this area will be defend this long position..
and when the price come back to this area, strong buyers will be push up the market again..
UPTREND + Support from the past + Strong volume area is my mainly reason for this long trade..
IF you like my work please like share and follow thanks
TURTLE TRADER 🐢

Sell From Portfolio Ladies and Gentlemen Go short on amazon and if you own it sell it from your portfolio.

Elliott Wave View: Amazon (AMZN) Rallying in a Double ZigzagShort term Elliott Wave view on Amazon (AMZN) suggests the decline to $123.66 ended wave ((A)). Wave ((B)) rally is in progress with internal subdivision as a double three Elliott Wave structure. Up from wave ((A)) low at $123.66, wave A ended at $128.50 and pullback in wave B ended at $127.18. Final leg higher wave C ended at $131.38 which completed wave (W). The stock then pullback in wave (X) with internal subdivision as a zigzag.
Down from wave (W), wave A ended at $126.39 and rally in wave B ended at $128.98. Wave C lower ended at $124.74 which completed wave (X). Wave (Y) higher is in progress with internal subdivision as a zigzag structure. Up from wave (X), wave A ended at $130.28 and pullback in wave B ended at $127.10. Stock should now continue higher within wave C of (Y) to complete the double three rally from 9.1.2022 low. Potential target higher is 100% – 161.8% Fibonacci extension from 9.1.2022 low which comes at $132.47 – $137.26. Near term, as far as pivot at 123.66 low stays intact, expect dips to find support in 3, 7, or 11 swing for further upside.

AMZNHELLO GUYS THIS MY IDEA 💡ABOUT AMZN is nice to see strong volume area....
Where is lot of contract accumulated..
I thing that the buyers from this area will be defend this long position..
and when the price come back to this area, strong buyers will be push up the market again..
UPTREND + Support from the past + Strong volume area is my mainly reason for this long trade..
IF you like my work please like share and follow thanks
TURTLE TRADER 🐢

Amazon | Fundamental AnalysisAmazon has been the undisputed king of e-commerce for years. The industry has been changing in unpredictable ways lately, spurred on by unforeseen events. The company took a huge leap forward at the beginning of the pandemic, and as its growth flattens out, has its high growth ended? And how will it affect Amazon stock?
According to Statista, Amazon leads other e-commerce operators by a wide margin. As of June 2022, it accounted for 38% of all U.S. e-commerce sales, followed by Walmart with 6.3%. This was due in part to Amazon's Marketplace, a platform for third-party shoppers that the company launched in 2000. In 2021, Marketplace accounted for 60% of total gross merchandise volume, about 25% of total U.S. e-commerce sales.
However, after a surge in sales amid a pandemic, growth is slowing. This is due to a combination of factors such as tough comparisons to last year's high growth, going through the flow of stimulus money, and inflation. North American product sales grew 10% year-over-year in Q2.
The pace of growth slowed from pre-pandemic levels, although even in Q2 they continued to build on last year's growth. Total sales were up 27% year over year in Q2 of 2021, and that figure fell to 7% in 2022. Company executives are forecasting an average of 15% growth in Q3, which is still below pre-pandemic levels. For example, in the Q3 and Q4 of 2019, sales were up 24% and 21% year over year, respectively.
The global e-commerce market is expected to continue to grow steadily, from $5.5 trillion in 2022 to $7.4 trillion in 2025. If Amazon maintains its share of the overall e-commerce market, then in theory its sales in this segment will grow organically with the rate of overall e-commerce growth. At this point, double-digit e-commerce sales are still an achievement. However, it is no longer the engine of company growth that it once was. If this were Amazon's only business, the company's stock would not look very inspiring.
Although e-commerce is the company's core business (at least for now), it is only one part of the puzzle.
The other important part is Amazon Web Services (AWS), the cloud computing segment. It remains a huge engine of growth, providing steady growth (33% YoY in Q2) as well as profitability. It accounted for 16% of total sales ($19.7 billion) in Q2 and was the only segment with a positive operating profit ($5.7 billion). Two other reportable segments, North American and International, posted operating losses.
AWS continues to introduce new features and services and expand into new markets, attracting new customers and expanding deals with current ones. The company is well positioned to grow sales for years to come.
In addition, Amazon is doing everything else as well. Although the company announced that it is closing all of its 68 physical Book, 4 Star, and pop-up stores, it has made more progress in grocery sales by opening 12 new Amazon Fresh stores in Q2. That's the key to future dominance. The company is well-equipped to do what you might call an elaborate gamble, and trying new types of business without fear of failure is how it thrives and dominates when it is successful. Otherwise, it shuts them down and moves on.
Amazon continues to make acquisitions that increase its top line and expand its dominance in new industries. The company recently acquired One Medical for $3.9 billion, one of the most expensive acquisitions in its history. A few weeks later, the company also announced the closure of Amazon Care, implying that it was making some revolutionary changes to its health care segment. It looks like Amazon is preparing for some major changes in this area that could disrupt the entire healthcare industry, in addition to digital technology and telemedicine, which are already redefining healthcare.
Despite the slowdown in e-commerce growth, Amazon's story is far from over. E-commerce growth is still in the double digits, so even so, the company remains in growing stock territory. But the other businesses it is entering make it a decent bet for strong growth in the coming years, both e-commerce-related and entirely separate.

Not The Precious Everyone Wanted.AMZN is betting big on The Rings of Power being as successful as The Lord of the Rings.
My first impression, I fell asleep watching it both attempts.
Complete snore fest and doesn’t engage anywhere near the magnitude LOTR did.
What’s that got to do with this online retailer?
Well it’s Prime Video. The underdog in the streaming wars.
I started analyzing AMZN a few weeks ago with this 15m Ascending Triangle
A clean break down, I decided to continue AMZ 15m series to see where it goes.
And finally a warning AMZN would not be in the No Mans Land for very long and provided an SPX level.
The next move for AMZN is bound to CPI and the next FOMC like every other equity that makes up the S&P 500.
There is some bullish sentiment I’m still reviewing that could see a lower CPI print and provide a short term bottom so be cautious.
Spreads are your friend!
But I keep hearing whispers in my head. SELL. SELL. SELL!!!
Thanks for reading my perspective.
Always remember, don’t take investment advice from people on the internet!

SHOUT OUT TO CRYPTO SAVY! AMAZON CRASH PATTERN IN BTC!I think there is a possibility that CRYPTO SAVY might nail it with his AMAZON / BTC comparison that he called out on December 2nd 2021.
Looks like it's playing out perfectly so far. I'll just add the EW count that i think this crash will be to SAVY's analysis.
I think we are in a "WXYXZ" complex correction (as shown in the chart).
I also think we will drop under the 2018 BTC low and bottom somewhere between 1.3k to 2.8k.
Let's see what happens....

XAUUSD Weekly Chart : 09.01.22In this chart, after a few weeks, we will check the weekly chart, we had identified two important levels on the chart and we expected the price to reach those levels and show a reaction, one was the range of $1783 to $1806 and the other $1824! Well, we saw that after the growth of 1200 pips, the price finally reacted to the first level and is falling from there until now, we have to see if the range of $1681 to $1694 can stop the price from falling further or not! If this important Bullish Order Block cannot stop the price from falling, we can expect the price to reach the target of $1678!
Follow us for more analysis & Feel free to ask any questions you have, we are here to help.
⚠️ This Analysis will be updated ...
👤 Arman Shaban : @ArmanShabanTrading
📅 09.01.2022
⚠️(DYOR)
❤️ If you apperciate my work , Please like and comment , It Keeps me motivated to do better ❤️

BTC Pattern for the next 2 years. This chart resembles a correlation between BTC and AMZN (early days).
Anywhere near $10,000 or below will see a heavy buy resistance and will likely accumulate for a year before initiating a new bull cycle.
Of course, BTC might take a different stance and decouple from this pattern due to regulations and restriction, but very interesting to see how it ends.
If you're excited to see where would this end if BTC to follow AMZN foot steps for another 10 years comment below.
Thank you and Do your own research.

Amazon at key area? Amazon
Short Term
We look to Buy at 125.43 (stop at 118.42)
Preferred trade is to buy on dips. Short term bias is bullish. 50 1day MA is at 125.00. Further upside is expected although we prefer to set longs at our bespoke support levels at 125.00, resulting in improved risk/reward.
Our profit targets will be 144.72 and 157.53
Resistance: 146.00 / 170.00 / 188.00
Support: 125.00 / 116.00 / 102.50
Disclaimer – Saxo Bank Group. Please be reminded – you alone are responsible for your trading – both gains and losses. There is a very high degree of risk involved in trading. The technical analysis, like any and all indicators, strategies, columns, articles and other features accessible on/though this site (including those from Signal Centre) are for informational purposes only and should not be construed as investment advice by you. Such technical analysis are believed to be obtained from sources believed to be reliable, but not warrant their respective completeness or accuracy, or warrant any results from the use of the information. Your use of the technical analysis, as would also your use of any and all mentioned indicators, strategies, columns, articles and all other features, is entirely at your own risk and it is your sole responsibility to evaluate the accuracy, completeness and usefulness (including suitability) of the information. You should assess the risk of any trade with your financial adviser and make your own independent decision(s) regarding any tradable products which may be the subject matter of the technical analysis or any of the said indicators, strategies, columns, articles and all other features.
Please also be reminded that if despite the above, any of the said technical analysis (or any of the said indicators, strategies, columns, articles and other features accessible on/through this site) is found to be advisory or a recommendation; and not merely informational in nature, the same is in any event provided with the intention of being for general circulation and availability only. As such it is not intended to and does not form part of any offer or recommendation directed at you specifically, or have any regard to the investment objectives, financial situation or needs of yourself or any other specific person. Before committing to a trade or investment therefore, please seek advice from a financial or other professional adviser regarding the suitability of the product for you and (where available) read the relevant product offer/description documents, including the risk disclosures. If you do not wish to seek such financial advice, please still exercise your mind and consider carefully whether the product is suitable for you because you alone remain responsible for your trading – both gains and losses.

AMAZON formed a 1D MA50/100 Bullish Cross. Accumulation ahead.It's been only 1.5 month since our long-term buy call on Amazon (AMZN):
The price rose aggressively after weeks of accumulation within the 1W MA200/300 and as we projected broke out hitting almost the first important long-term Resistance (1W MA50). On August 16 the price was rejected exactly on the 1D MA200 (orange trend-line), which was the point of rejection on the previous Lower High (March 29) of this 2022 correction phase.
The stock rose almost +45% from its June 14 Low, so profit taking was expected. The 0.382 Fibonacci retracement level broke and the price is just above both the 1D MA50 (blue trend-line) and the 1D MA100 (green trend-line). The former crossed today above the latter forming a technical Bullish Cross, the first such formation since December 03 2021. That was a far from ideal pattern as it broke the uptrend's Higher Lows trend-line and basically was at the start of the 2022 correction phase.
This time the Higher Lows trend-line is much lower (currently around $114.40) so on the medium-term we remain on a downtrend, until the 1W MA50 and Lower Highs Zone break. However, it is the first time we have such a strong and long uptrend on the 1W RSI, with its Higher Lows trend-line still intact.
Practically, as long as the 1D MA50/100 hold, we can expect a re-test of the 1D MA200. If they break, there is still a chance of finding Support on the 0.618 Fib. Further selling can be done below the Higher Lows trend-line.
--------------------------------------------------------------------------------------------------------
** Please support this idea with your likes and comments, it is the best way to keep it relevant and support me. **
--------------------------------------------------------------------------------------------------------

multi-timeframe analysis for AMZNHello guys
As you see in chart, it formed a QM structure on a flip of monthly time frame, after confirming that structure started bullish movement and in way make a island pattern because of two sides gap. The last gap doesn’t fill so if we get short position, we can put target below that gap(target=$125.41).
Price formed a three-drive pattern and with RSI divergence confirmed this pattern, three drive is a great approach.
always do your own research.
If you have any questions, you can write it in comments below, and I will answer them.
And please don't forget to support this idea with your like and comment.
BE PROFITABLE

3 Directions to ConsiderThe previous Ascending Triangle Pattern was bang on target.
The triangles base support is now the Resistance.
The price has no Trend.
Zoom Out to find bigger patterns or trends.
Short squeezed, a lot of stocks opened on an island.
After rejecting 200 MA tech is sitting perched with only a gap down or up.
Inflation and rising Energy costs are pinching pockets.
Credit rates are eating into bottom lines.
Sitting Right up top for an Island Reversal with SPX.
Seems like it would be a good place to buy a straddle.
NVDA is down 4.6% after earnings.
After closing, AMZN announced tonight it will be shutting down Amazon Care.
I’m going to lean bearish for direction.

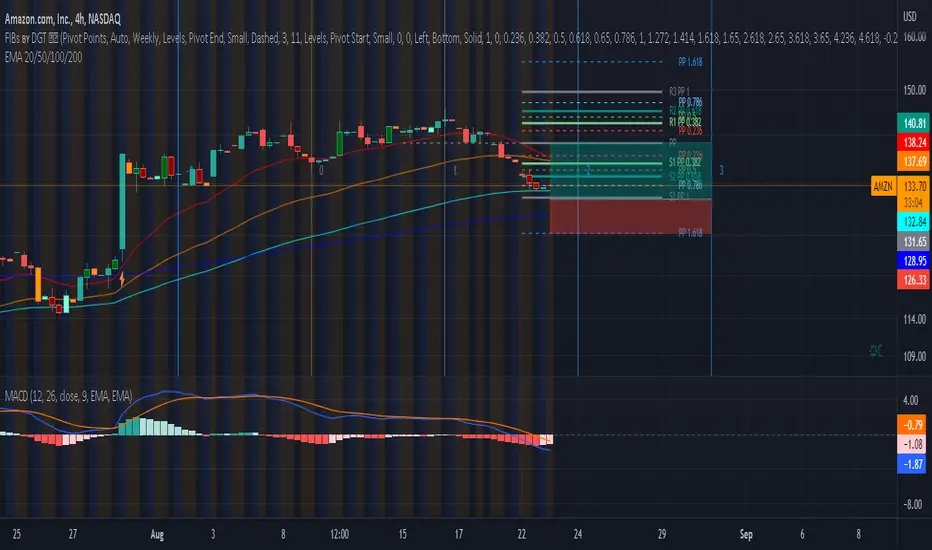
AMZN- Bullish PositionCurrently trading below 20 and 50-day EMA moving average investors can see that the underlying share price of amazon is undervalued. Valued at $133.35 AMZN is trading in line with its 100-day EMA average, it’s important to mention that there is still a strong possibility that the stock will fall even further in line with it’s 200-day EMA before bullish corrections occur. Regardless these technical signals indicate to investors that we should anticipate bullish momentum for this stock.
When looking more closely at the stock and its performance, Fibonacci retracement pivot points shows investors that it’s currently trading at a strong support level of 0.786; further supporting this undervalued and bullish notion. Investors should anticipate corrections towards its resistance level. Investors should also take due care to the strong possibility that the bearish sell trend might reach a stronger support level before bullish corrections occur.
Based on the above technical indication, we have set a buy price in line with the Fibonacci’s lower 1.00 support pivot. We have also set a sell price just above the 20-day EMA level. Based on Fibonacci, we have set a sell price in line with the central PP level, in between it’s resistance and support.
SGFY: Sell the rumour, buy the news!Signify Health
Short Term - We look to Sell at 29.83 (stop at 33.46)
There is market rumour that Amazon, United Health and CVS are interested in buying this company. This led to a surge in the stock in premarket. We are trading at overbought extremes. A lower correction is expected. Bespoke resistance is located at 30.00. Selling spikes offers good risk/reward.
Our profit targets will be 20.04 and 18.00
Resistance: 30.00 / 34.00 / 40.00
Support: 20.00 / 16.00 / 12.00
Please be advised that the information presented on TradingView is provided to Vantage (‘Vantage Global Limited’, ‘we’) by a third-party provider (‘Signal Centre’). Please be reminded that you are solely responsible for the trading decisions on your account. There is a very high degree of risk involved in trading. Any information and/or content is intended entirely for research, educational and informational purposes only and does not constitute investment or consultation advice or investment strategy. The information is not tailored to the investment needs of any specific person and therefore does not involve a consideration of any of the investment objectives, financial situation or needs of any viewer that may receive it. Kindly also note that past performance is not a reliable indicator of future results. Actual results may differ materially from those anticipated in forward-looking or past performance statements. We assume no liability as to the accuracy or completeness of any of the information and/or content provided herein and the Company cannot be held responsible for any omission, mistake nor for any loss or damage including without limitation to any loss of profit which may arise from reliance on any information supplied by Signal Centre.

Amazon monthly may need reworkingthe long term picture for amazon.com, and really the whole dotcom sector has looked bleak until recently. i would wait to cross above this pivot and trama to turn up before i thought we could continue recovering in technology. id aim for upper horizontals as we cross above levels and lower horizontals as we cross below.

Amazon Bear RetracementSign of Bearish trend continuation
-Candlesticks are moving below MA200
-Magnitude of Downtrend Line B is much stronger than of downtrend Line A, confirming strong bearish trend
-Candlestick fail to stay above MA200 after retracement R1
Strength of Retracement line R2 is stronger than of R1, signifying more uptrend momentum. However, candlesticks might have issues challenging hurdles of 0.618 fib retracement of Line B and MA 200.
Heavy selling might occur around the range of 151 to 164, where there is much higher trading volume. Holders that bought at this range or higher might choose to sell in order to breakeven or recoup losses.(Boxed)
If the expected long-term downtrend continues, Strong support might only be found at 88 to 95 range, where the highest volume have been traded for past 900 days since March 2020. (Boxed)

AmazonOn the Nasdaq correction wave B should lead to the price range of 123-128, there you can safely buy more. At the moment the paper is oversold by momentum and waiting for correction.

AMZN - Final Corrective Wave Down AheadThis is a WEEKLY linear chart for reference.
I believe Amazon is in the process of finishing a corrective wave that will lead to the final leg down in the sequence to the lower channel line.. roughly a 40% move.
As you can see there has been a lot of price activity oscillating around the median line. I believe this resolves to the down side.
The current candle is just 1 day into the weekly candle so it's bound to take on various shapes. I believe the white channel line will contain price.
Here is a WEEKLY LOG chart view
